Advisor Perspectives welcomes guest contributions. The views presented here do not necessarily represent those of Advisor Perspectives.
I propose a new framework to solve many problems associated with retirement income planning, one that answers questions investors often ask, such as: “How much retirement income can I have with only a 10% chance of failure?” and “How much do I need to have now to draw $50,000 for 30 years with full certainty?”
My framework provides better answers than the current industry benchmark: safe withdrawal rates (SWRs) can be raised from 4% to 4.6% by cutting down the risky investments – not by increasing risk. My framework also brings transparency to the tradeoff between risk and income, so that investors and advisors can make decisions with which they remain comfortable throughout retirement.
The private wealth management literature is full of differing perspectives on the retirement income problem, including the benefits and inefficiencies of the 4% rule-of-thumb. Nobel laureate William Sharpe’s article and Robert Huebscher’s article cover the benefits of owning bonds and the higher withdrawal rates that result. Many articles have also been published on each aspect of the retirement income problem with analytical and empirical analysis leading to a specific recommendation for each decision, whether it be asset allocation, drawdown order, or the amount and timing of annuity purchases.
Typically, each one of those analyses comes with a useful rule-of-thumb that is applicable in isolation. The usefulness of those rules is limited, however, when trying to analyze a comprehensive asset allocation. For example, the amount of portfolio that is converted to annuities used may affect the optimum asset allocation for the rest of the portfolio. Yet, no comprehensive framework exists that synthesizes and models the asset allocation decision and other decisions during retirement distribution phase; therefore, I propose a new one.
Goal risk among the efficient portfolios
Current business practices in private wealth management rely on choosing a portfolio from an efficient frontier after assigning investors a score using a psychological risk questionnaire. This practice works very well for the wealth accumulation and growth phase, when investor goals can be expressed as an expected return with a defined volatility. When the investor moves to the decumulation phase of the portfolio, however, he or she will usually have a more specific disbursement goal, such as $50,000 in pre-tax income annually. I present an alternative way of choosing among the efficient portfolios that is more effective and at the same time intuitive for the investor and his or her advisor.
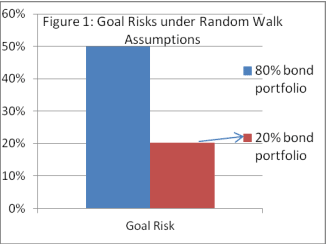
Let’s introduce a new risk metric, called goal risk, which represents the chance that a specific goal will not be accomplished. Let’s start with a counter-intuitive finding: a 20% bond and 80% stock portfolio can be half as risky (in goal risk terms) as a portfolio with 80% bonds and 20% stocks. How is that possible?

Suppose one of your conservative clients wants to invest $409 towards an inflation-adjusted goal of $1,000 in 30 years. You would typically choose a conservative portfolio like an 80% bond portfolio. The $409, growing at a conservative rate of 3%, will reach the target of $1,000 in 30 years. The return of 3% is the historical average returns for this portfolio, using data from the last 84 years.
Let’s understand the implications of that decision. The chance of realizing the mean return of 3% is 50% under a random walk assumption. However, if the if $409 were invested in a 20% bond portfolio with a historical average return of 5.5% and a historical standard deviation of 16.9%, then under the same random walk assumptions, the chance that he or she will not achieve the goal is 20%. So, a portfolio with 20% bonds can be less than half as risky (a 20% versus 50% chance) in achieving the goal compared to portfolio with 80% bonds, as shown in figure 1. (Stocks and bonds referred to in this article are large-cap stocks and intermediate-term government bonds respectively. Average returns mentioned above are mean of logarithmic real returns.)
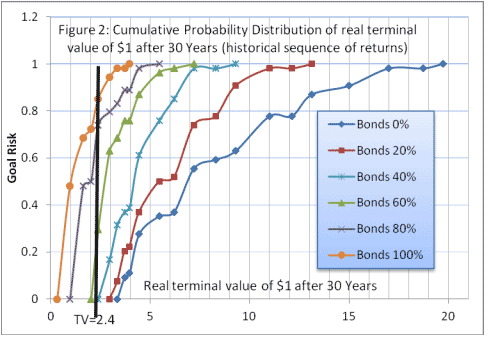
Now, let’s see the goal risk using a historical sequence of returns instead of a random walk. The goal of $1,000 with an investment of $409 implies a terminal value ratio of 2.4 ($1,000/$409). Figure 2 shows that the 20% bond portfolio has a zero goal risk of achieving that terminal value, whereas the goal risk using an 80% bond portfolio is 67%. The dark black vertical line shows the terminal value of 2.4, which touches the x-axis before the 20% bond line touches it and it intersects the 80% bond line at 67% goal risk.
That brings us to one key finding: goal-based risk is a more relevant metric in portfolio selection for a specific disbursal goal compared to the standard deviation of the portfolio returns. Moreover, the goal risk is easier for an investor to understand, as compared to standard deviation. The ease of interpretation can help investors determine the goal risk with which they are comfortable and understand the implications of that decision.
In the two-asset class example I used, both the 20% bond and the 80% bond portfolio are mean-variance efficient portfolios; we are evaluating which one of these efficient portfolios has lesser goal risk.
My historical sequence-of-returns analyses are based on data from 1926-2009 found in the 2010 Ibbotson Classic Yearbook. In this section, I showed results using both a random walk assumption and historical sequence-of-returns to prove the validity of the argument under both methodologies. The rest of my analysis going forward will use only historical sequence-of-return analysis, as I have reservations about using random walk assumptions for long-term analysis (see an article I wrote on this subject).
Goal risk-based portfolio selection from the efficient frontier
Current practice also doesn’t differentiate among recommended asset allocations based on the investment horizon. Typically, a long-term asset allocation is selected, with long term defined as 5-7 years. The recommended asset allocation for the investor doesn’t vary based on whether the investment horizon was 10 years or 30 years. In the next section, I will demonstrate that one’s recommended asset allocation, when planning for a single withdrawal goal, varies significantly with the investment horizon. With a zero-goal risk constraint, the recommended portfolio would be 60% bonds for 10-year horizon, and 0% bonds for 30-year horizon.
Single withdrawal planning
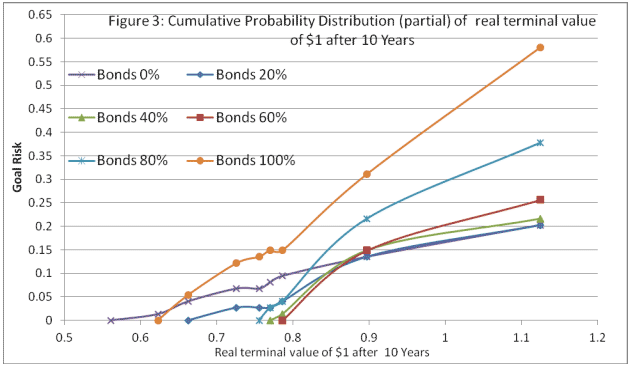
Take an investor who needs an inflation-adjusted $1,000 in 10 years and wants to determine the amount-to-invest (ATI) now and the proportion to invest in each asset class in a fixed asset allocation portfolio with annual rebalancing. I will use figure 3, which is constructed using a historical sequence-of-annual-returns to demonstrate the analysis.
The payoff for each portfolio at a given level of risk can be found by traversing along the horizontal line represented by the desired goal risk. Among all portfolio combinations at a goal risk level, the recommended portfolio is the one that has the maximum payoff for the unit of risk being taken, and yields the highest terminal value. (All the portfolios in the figure above except the 100% bond portfolio are on the efficient frontier of stocks and bonds.) For example, at 0% goal risk, the 60% bond portfolio has the best payoff among the portfolios illustrated above. At 20% goal risk, the 20% bond portfolio has the best payoff. At 40% goal risk (not shown in the figure), the 0% bond portfolio has the best payoff. After the recommended portfolio has been chosen, its terminal value can be inverted to find the ATI.
When the analysis is run for asset allocations that are 5% apart in bond holdings,(for simplicity, figure 3 shows asset allocations that are 20% apart), the best terminal value at 15% goal risk, achieved with 15% bond portfolio, is 1.043. Inverting that terminal value we get the ATI as 0.959. If $959 were invested today and annually rebalanced in a 15% bond – 85% stock portfolio, it would reach the target goal of real $1000 at 15% goal risk.
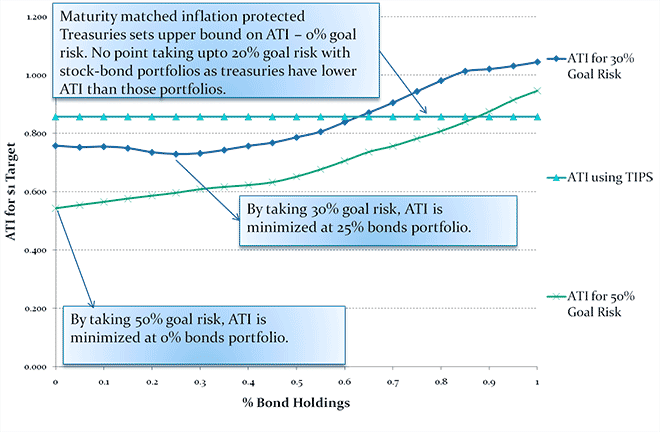
An ATI of $959 seems too high to reach a real $1,000 target in 10 years. Let’s calculate the ATI using Treasury Inflation Protected Securities (TIPS), an attractive alternative for an investor with a goal expressed in inflation-adjusted terms. TIPS can be used to reach an investor’s goal at zero goal risk, simply by purchasing TIPS with a maturity matching the desired horizon.This helps decide whether it is worthwhile to invest in stock and bond funds at the chosen goal risk level.
The ATI for TIPS can be calculated by discounting using the real yield under the assumption that the yield is on a hypothetical, zero-coupon TIPS. (For this article, the yield on TIPS was taken from the April 9, 2010 edition of the Wall Street Journal. )
Figure 4: ATI and goal risk sensitivity for a 10-year investment horizon
Using a 10-year horizon, for a goal risk of up to 20%, it doesn’t make sense to invest in a risky stock-bond portfolio, as the ATI using TIPS is lower than those ATIs. As can be seen in the figure 4, the ATI is minimized at a 25% bond portfolio for a 30% goal risk constraint – so, a 25% bond portfolio is the recommended portfolio at that risk level. Similarly, for a 50% goal risk constraint, the recommendation is a 0% bond portfolio. If the investor is willing to take no more than 20% goal risk, the recommendation would be to buy TIPS and hold them to maturity.
Let’s extend this analysis to a 30-year investment horizon. Figure 2 shows that 100% stocks is the recommended portfolio at all goal risk levels. The advisor can customize this result to individual investors by using a different ATI. An investor with zero goal risk will need to invest $286 now to reach real $1,000 in 30 years, whereas an investor willing to take 15% goal risk will need to invest $245 to reach the same goal.
I have excluded the analysis of how far the investor might end up from the goal in the event that the goal is not achieved. That would be valid constraint to have on the portfolio selection, and I will cover that in a follow-up article.
Multiple withdrawal planning
Having demonstrated the method to choose a portfolio among efficient portfolios for a single withdrawal, we will move to choosing a portfolio for multiple withdrawals. Let’s take a typical retirement distribution, wherein inflation-adjusted withdrawals are required over a period of 30 years. For simplicity, we will assume the required withdrawals are $1 annually, inflation-adjusted.
One approach is to conduct an independent analysis similar to the single withdrawal portfolio for each horizon to select the optimum portfolio and determine ATI for that horizon. Then one can sum up the ATIs obtained for each horizon to obtain the cumulative ATI for 30 years. For example, using annual returns, the cumulative ATI obtained using the above approach for 30 years of real $1 withdrawals at zero goal risk is $28.72, which is a withdrawal rate of 3.48% (calculated as 1/28.72).
By doing the above, we are effectively setting aside 30 independently managed sub-portfolios corresponding to each year of the income need, with each sub-portfolio having its own optimum asset allocation. That would be similar to the Lockbox Separation concept pioneered by William Sharpe. A disadvantage of this approach, when used with goal risk-based planning, is that it is overtly conservative – that’s why the withdrawal rate is so low. The plan is conservative because it builds protection for a bad market in each of the withdrawal years, whereas a bad market can (and likely will) happen in only few of the 30 years, but not in all 30 years.
[I define the withdrawal rate as the ratio of annual real dollar withdrawals to starting assets, where the real dollar withdrawal is the same every year. The safe withdrawal rate is the withdrawal rate with zero goal risk (i.e., the rate just sufficient to exhaust assets at the end of 30 years in the worst case scenario path). The withdrawal rate at any goal risk is the rate that will fail to meet the required annual real withdrawal in percentage of scenario paths represented by the goal risk.]
Most advisors build a single retirement portfolio to fund income needs for all 30 years. That practice has merit, as the risks of a bad market and the benefits of a good market are being shared across income needs over multiple investment horizons. I will analyze a single portfolio of risky assets, and I will address the benefits and pitfalls of multiple sub-portfolios (not 30, but more than one) in a follow-up article.
As with single withdrawals, TIPS play a role in the portfolio construction for those with multi-withdrawal needs. For now, I will assume that for any investment horizon, if the ATI using TIPS is lower than the minimum ATI obtained among all efficient portfolios, then the maturity-matched TIPS will be used to meet the income need for that horizon.
The inventory of TIPS in the market is missing maturities for few years of the 30-year period. Yields have been approximated for those maturities by using the yield of the closest available lesser-maturity TIPS in the market. The ATI for TIPS can be calculated by discounting using the real yield under the assumption that the yield is on a hypothetical zero-coupon TIPS.
Once the maturity-matched TIPS have been determined, then various efficient portfolios need to be evaluated for the remaining investment horizons. The principle is the same as before: select that portfolio from the efficient portfolios that minimizes the ATI at a given goal risk constraint.
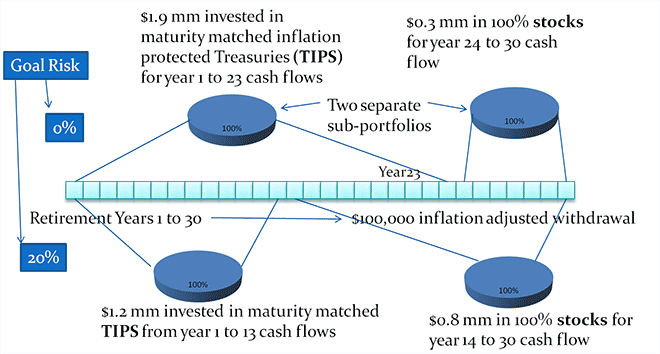
I will explain the calculations using a zero goal-risk example. At zero goal risk, TIPS are better-performing than any combination of stock and bond funds until the 23rd year. ATI for those 23 years using TIPS is $18.90. After the TIPS segment is determined, the software can analyze various asset allocations and the ATI under each allocation to achieve the goal of $1 withdrawal from year 24 to 30 at zero goal risk.
The results from the software-based optimization at 0% and 20% goal risk based on monthly sequence of returns analysis are presented below. You can view other combinations at the freely accessible online demo (no registration required) of the advice engine here. The withdrawals are pre-tax amounts and taxes are ignored for all calculations.
Figure 5: Recommendations for a retirement distribution portfolio at different risk levels
The withdrawal rate for zero goal risk is 4.6% (calculated as $100K/ $2.2 mm), which is much higher than the SWR of 4% widely quoted in the industry. When we increase the goal risk to 20%, the withdrawal rate rises to 4.9%. I am restricting my analysis to large-cap stocks; small-cap stocks would lead to higher withdrawal rates as well.
Other retirement distribution decision points
With goal risk-based portfolio selection, we have a base framework to make optimum decisions for other distribution decision points outlined by Joel Bruckenstein in his chapter titled “The Search for Software” in the book Retirement Income Redesigned. The recommendation is made on the combination of decision points that minimizes the ATI or equivalently maximize the withdrawal rate for a given goal risk constraint. Here is a brief outline of how this framework can be used for those decisions:
-
Order of drawdown: The choice of an effective drawdown-order strategy across taxable, tax-deferred and tax-free accounts can be made by choosing the strategy that sustains the maximum withdrawal rate at a given goal risk constraint. All strategies, such as partial IRA withdrawals to take advantage of lower tax brackets in early years, can be analyzed in the framework.
-
Annuities: Since the ATI for a systematic withdrawal portfolio and incremental ATI for each additional year one might live can be determined, the advisor has the metrics to make decisions regarding annuities. The software can optimize the mix of timing and quantity of annuities in an overall asset allocation.
-
Timing and choice of method of Social Security payments: Various alternatives for the start of Social Security and the appropriate method for one’s spouse can be included in the optimization process to minimize the ATI.
-
Reverse mortgages: Various options in using a reverse mortgage, such as immediate or use in case of shortfall, can be modeled to see their impact on the cumulative ATI.
Benefits and applications of the new framework
Pre-retirees can develop their retirement plan using this framework. The advantages of the framework for the retirement distribution problem are briefly outlined below:
- Better planning for uneven income needs
- Support for mental accounting by planning for different goals at different risk levels. For example, one can plan to cover basic expenses at a low goal risk and discretionary expenses at higher goal risk.
- Support for flexible planning horizons – any length horizon can be supported
- Joint optimization of all interacting decision points, for example the drawdown order across different types of accounts impacts the asset allocation in each account.
Although the analysis in this article is based on historical sequence-of-returns, my framework does not depend on them. The framework will work with scenarios generated using any means.
Manish Malhotra is President of Fiducioso Advisors Inc., a firm serving RIAs and other advisors. Fiducioso specializes in creation and management of private retirement portfolios for retail clients of the advisors. This article has been distributed for informational purposes only and should not be considered as financial advice.
Feedback on this article can be provided via email to , or by posting comments on twitter mentioning @fiduciosoAdv.
The author would like to thank Michael Kolfman, my colleague at Fiducioso, for implementing the software-based optimization for multiple withdrawals.
Read more articles by Manish Malhotra