Videos
Short videos from the industry's leading investment firms

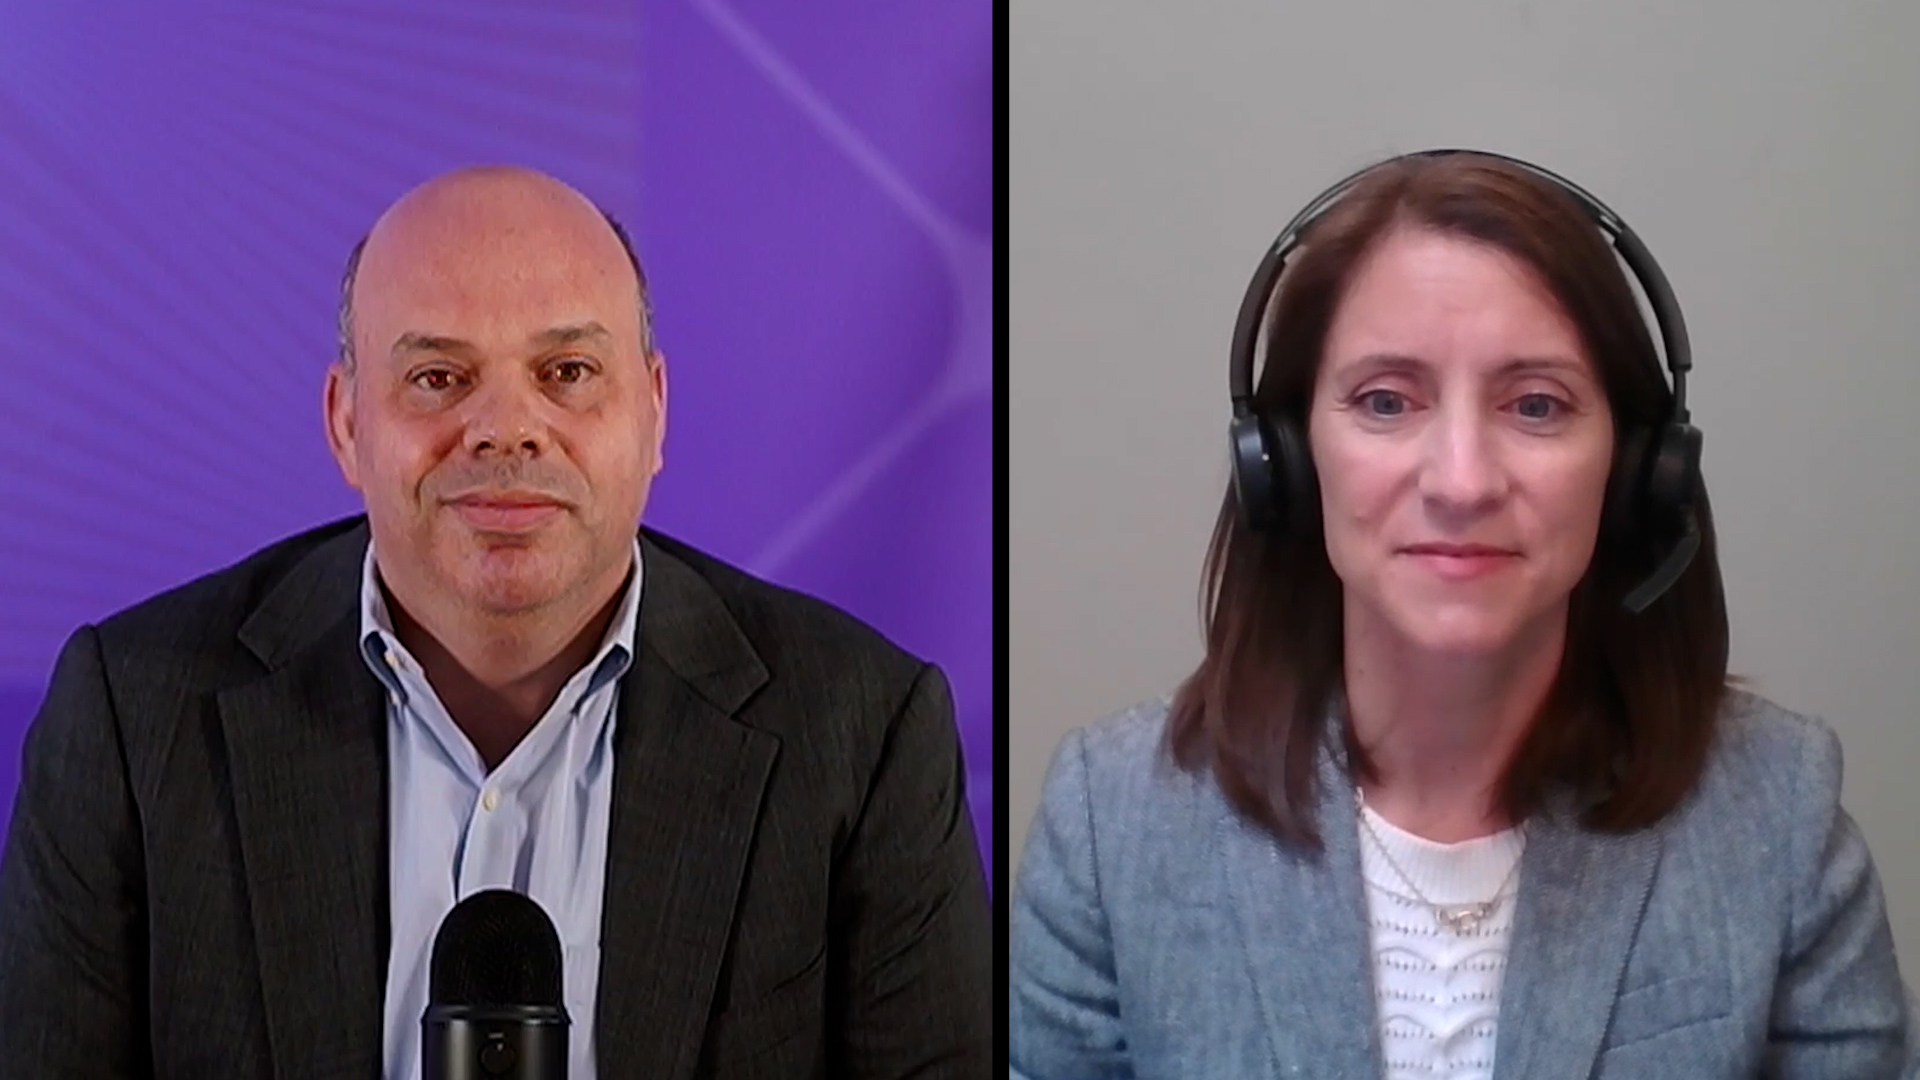
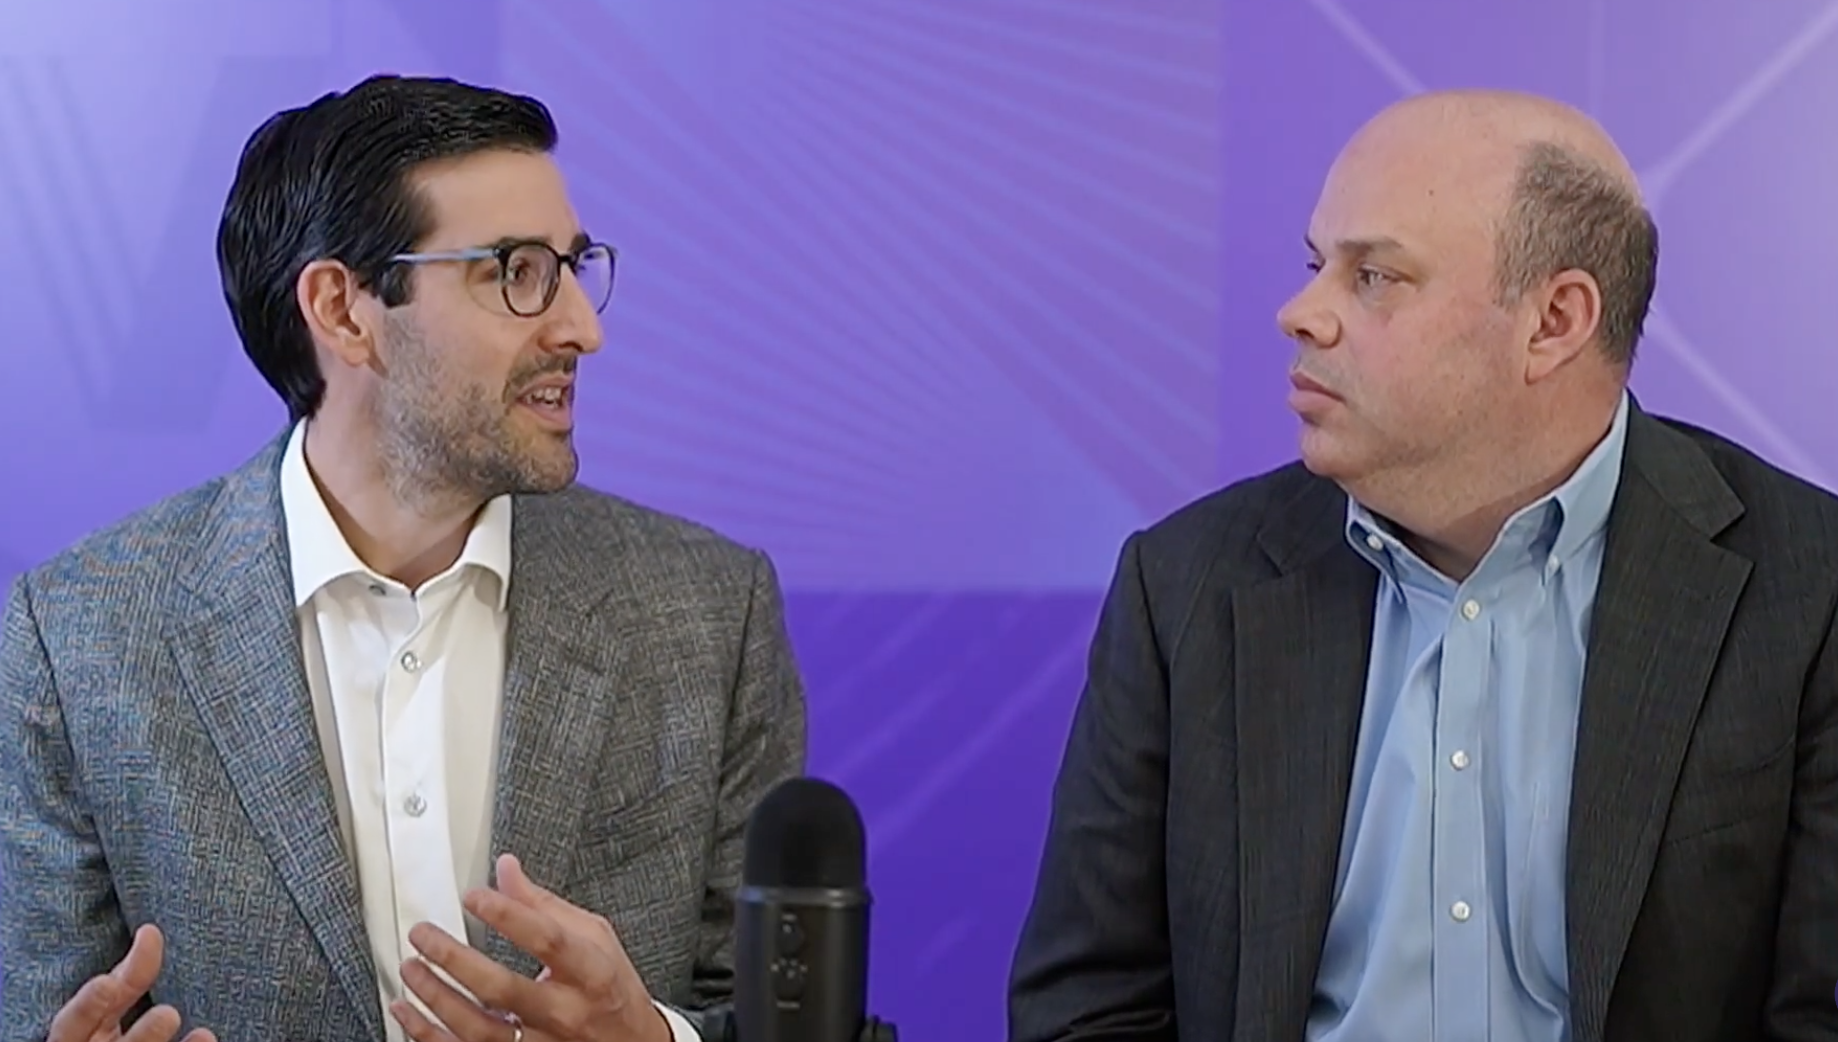
ETF 360 | Michael Schnackenberg of Eventide
by Evan Harp,
Michael serves as Head of Distribution for Eventide. He is responsible for Eventide's product, distribution, and education strategy. Mr. Schnackenberg leads Eventide's Sales, Marketing, Key Accounts, and Eventide Center for Faith and Investing teams.
The Fed's Interest Rate Decision: December 10, 2025
by Jennifer Nash,
The Federal Funds Rate (FFR) is the interest rate banks charge each other to borrow money overnight. It's set by the FOMC and is one of the Federal Reserve's primary tools to implement monetary policy and is a key driver of economic activity. This video examines the Federal Funds Rate and reviews the Fed's interest rate meeting on December 9-10th, 2025.
Risk Management Matters: How Summit Global Investments Navigates Market Volatility
Join Cynthia Murphy, Investment Strategist at VettaFi as she speaks with David Harden, CEO and CIO of Summit Global Investments (SGI), about the firm's history, its proprietary managed risk philosophy, and how its ETF strategies are built for today's dynamic market environment.
John Davi of Astoria Portfolio Advisors on Market Trends and Portfolio Diversification

The interview features Cynthia Murphy and John Davi, Founder, CEO, and CIO of Astoria Portfolio Advisors, discussing their firm's investment philosophy and the current market environment. Davi explains Astoria's three verticals: managing risk-based ETF portfolios, running quantitative stock selection models, and offering their own equity, fixed income, and alternative/real asset ETFs. The conversation highlights key market concerns like high inflation and the dominance of the "Mag Seven" stocks, with Davi recommending diversification into international stocks, mid-cap stocks, financials, industrials, and inflation-fighting strategies like gold and Bitcoin, especially for traditional 60/40 portfolios.
Infrastructure Redefined: Investing Today for Resilient Portfolios Tomorrow

The future is now: 5G, fiber optics, power grids, and digital networks. Brock Campbell, CFA of BNY Investments reveals how BKGI (the BNY Mellon Global Infrastructure Income ETF) delivers inflation protection, steady income, and exposure to essential growth assets.

The Fed's Interest Rate Decision: October 29, 2025
by Jennifer Nash,
The Federal Funds Rate (FFR) is the interest rate banks charge each other to borrow money overnight. It's set by the FOMC and is one of the Federal Reserve's primary tools to implement monetary policy and is a key driver of economic activity. This video examines the Federal Funds Rate and reviews the Fed's interest rate meeting on October 29, 2025.