Who is better at value investing: robots or people? How have robots – the quantitatively-driven passive funds that hold, for example, low price-to-book stocks – fared against actively managed value mutual funds?
A provocative paper forthcoming in the Financial Analysts Journal, “Facts About Formulaic Value Investing,” by U-Wen Kok, Jason Ribando, and Richard Sloan, argues that robots are poor value investors.[1]
You need people – analysts studying companies – to pursue value strategies successfully, argue the authors. The reason is that robots have no intuition for the data and can only take the data literally, while, in value investing, the key to success is in knowing when certain types of data, such as earnings and book value, can be trusted and when they are exaggerated or manipulated.
But is this true? The article is erudite and well-crafted and refers to all the right people. For example:
More recently, Asness, Frazzini, Israel, and Moskowitz (2015) reached a similar conclusion about the performance of standalone formulaic value strategies. Recent research has also shown that the performance of book-to-market and other formulaic value strategies in the United States has become weaker since their initial publication (see Asness et al. 2015; Fama and French 2016; McLean and Pontiff 2016)….
But active managers have had great difficulty beating their benchmarks on average over long periods of time, in practically every capital market. If active value investors are the exception, beating robotically-constructed value benchmarks with some degree of consistency, we’d like to know that.
To evaluate the claim that robots “stink” at value investing, I begin by applying a formula inspired by the great finance professor and Goldman Sachs partner Fischer Black, who believed that most financial research was data mining.[2] Here is the formula:
- Don’t look at the data.
- Think about the question.
Value investing is about comparing a company’s price to some measure of its fundamental value, buying the cheap companies, and holding them until you’ve made a profit (if you ever do).[3] This process can be mimicked by a value benchmark, which performs the above-described tasks robotically but which is subject to Kok et al.’s critique. So we can test the idea that robots stink at value investing by comparing the long-term performance of a value benchmark to that of an unbiased universe of active value managers.
No one is suggesting that a robot is better than all human value managers. In any investment category, there will always be a lucky or extraordinarily skillful few who beat all relevant benchmarks for long periods of time. The trick is figuring out, in advance, which managers these will be.
Is value investing a good idea?
Asking whether robots or humans are better at value investing is very different from asking whether value investing is a good idea. That question can only be answered by determining whether the conditions that caused value to beat growth historically are likely to be repeated. These conditions are usually believed to be behavioral: investors overreact to both good and bad news about companies, causing popular stocks to be overpriced and unpopular ones to be underpriced.[4]
Let’s first briefly ask whether value investing is a good idea, then turn to the question of robots versus people.
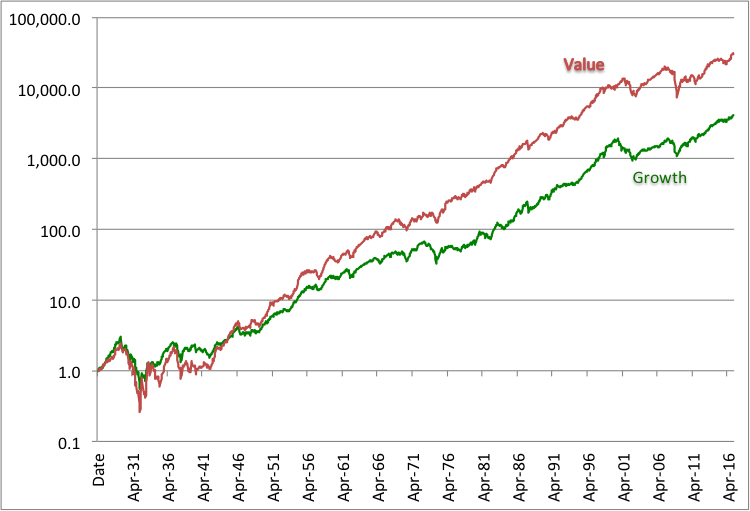
Exhibit 1 shows the cumulative total returns on value and growth benchmarks constructed by Fama and French [1992]. Starting in July 1926 they classify, each year, all large-cap U.S. stocks into three categories: value (the 30% of stocks with the lowest price-to-book ratios), growth (the 30% of stocks with the highest price-to-book ratios) and neutral or core (the remaining stocks). The value benchmark outperformed the growth benchmark by a cumulative 7.3-to-1 ratio, or about 2% per year.
Exhibit 1
Cumulative total returns on Fama-French U.S. large-cap value and growth benchmarks, July 1926-March 2017

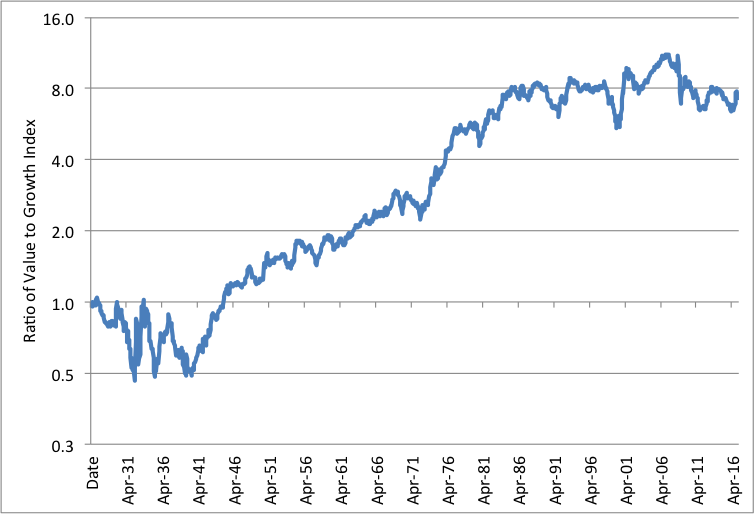
Exhibit 2 shows the ratio of the cumulative value index to the cumulative growth index in Exhibit 1. Asness, Frazzini, Israel, and Moskowitz [2015], the researchers cited in Kok et al.’s study, are clearly right that the value effect became weaker after it was discovered in the 1980s. This is not a big surprise, because most capital market anomalies become weaker or disappear after they’re discovered and exploited; that’s how markets work. Asness and his illustrious team did not address the question of robots versus people.
Exhibit 2
Ratio of Fama-French U.S. large-cap cumulative value to cumulative growth benchmark, July 1926-March 2017
Source: Constructed by the author, based on data from Ken French’s web site
In fact, using the Fama-French large-cap value index as the metric, the value effect just about disappears around 1985, the year that Rosenberg, Reid, and Lanstein [1985] published their landmark study showing that value had beaten growth.[5] Coincidence? Maybe not.
Is there a value effect? The answer, as I said earlier, depends on whether you think that the behavioral conditions that caused value to beat growth resoundingly over 1940-1985 and in some earlier and later periods, especially 2000-2007, will exist in the future. Even Jeremy Grantham, as devoted a value investor as we have today, thinks they might not. He has questioned the relevance of traditional value metrics looking forward. Noting the increase in corporate profitability and monopoly-like characteristics in recent decades, Grantham asks, “What does this mean for value investing?” and replies:
What it does not mean is that cheaper is not better. But price to book was never a measure of cheapness. The low price to book ratios reflect the market’s vote as to which companies have the least useful assets. Only if the market gets carried away with pessimism or feels uncomfortable with the career risk of owning companies in temporary trouble will such ratios work. Sometimes they do and sometimes they don’t. A fully-fledged dividend discount model with strong quality adjustments and epic struggles to correct for accounting slippage is ideally what is needed. [Grantham 2017]
I have not seen any evidence that investors are less prone to irrational exuberance or unwarranted panic than they used to be, although the institutional setting, including the shift from retail to professional investing and the massive move into index funds, has indeed changed. I tend to agree with Warren Buffett – and with the current views of Grantham – that value is the right lens for looking at any active investment decision, but that, in Buffett’s great phrase, “growth is part of the value equation.”[6] Value as traditionally construed, then, is part of a larger discipline of buying assets for less than they will someday be worth – a formula that asks us to consider growth rates in determining asset values.
In sum, value investing is a good idea, but I’d be surprised if value investing, by robots or people, ever works as well again over a long period of time as it did over 1940-1985, when it generated huge excess returns.
Robots versus people
As a proxy for all forms of robotic value investing, let’s first use the Fama-French benchmark consisting of the bottom 30% of U.S. large cap stocks ranked by price-to-book. If the world’s dumbest robot wanted to start a value fund, this would be it, because it defines “value” based on a single fundamental variable; moreover, that variable is chosen not for its relevance but for the ease of obtaining data on it.[7]
I’m not saying that Fama and French are dumb; far from it – they are great capital market historians and empiricists. But, given the wealth of fundamental data now available, an investor wanting to capture the value effect could surely try harder. It also happens that the world’s dumbest robot value index [WDRVX] is the straw man for quite a bit of Kok et al.’s analysis.[8]
To conduct the robots versus people test, I obtained monthly returns from Morningstar on all the U.S. large-cap actively-managed value mutual funds for which they had data. The data start in 1992 and end in early 2017. I removed duplicate share classes, so my analysis covers 106 funds in January 1992 and 318 funds in March 2017. I calculated an active-manager composite by taking a simple (equally weighted) average of the monthly returns of the funds.
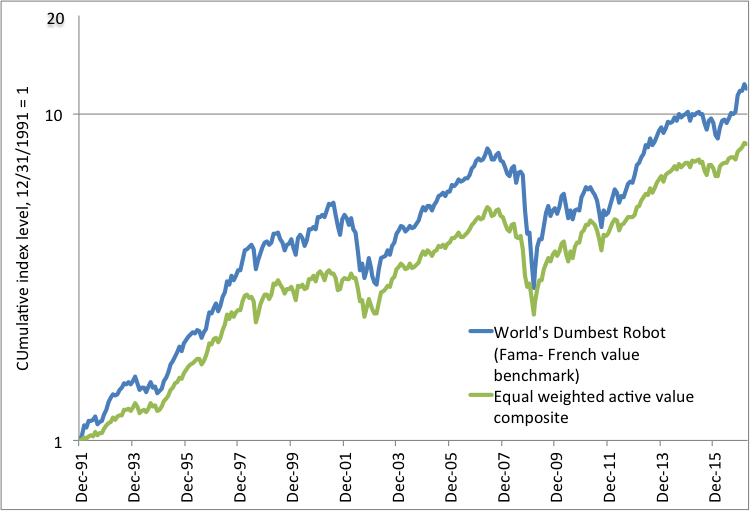
The results are in Exhibit 3. The world’s dumbest robot won! Like the 2016 Chicago Cubs, the robot started with a massive lead and never lost it. The cumulative index representing the robot was ahead of the manager composite as of every single month-end for more than 25 years.[9] The compound annual return was 1.71 percentage points higher for the robot than for the manager composite.
Exhibit 3
World’s Dumbest Robot Value Fund (WDRVX) vs. active value composite,
cumulative total returns, January 1992-April 2017
Source: Constructed by the author, based on data from Morningstar and Ken French’s web site
Digging deeper: Distribution of fund returns for full period and by subperiod
But we’re not done. We know (without looking) that some active value managers were good. How many beat the Fama-French benchmark, or dumb robot? Exhibit 4 shows the results, breaking them down by subperiod.[10] A fund is only counted in Exhibit 4 if it existed at both the beginning and end of the time period shown.
Exhibit 4
U.S. large-cap value fund results for full period and by subperiod
Only 59 funds survived over the whole period. Very long-lived funds tend to do well; if they don’t, fund management companies kill them off or merge them into another fund.[11] Yet, over a period spanning more than a quarter-century, the Fama-French value benchmark beat all but two of those 59 funds. Those two funds were the Dodge and Cox Stock Fund and the Sound Shore Fund.
What caused the superior performance of the benchmark? In a generally rising market, it’s hard to beat a benchmark. Most active managers take various diversifying bets and also hold cash. But the extent of most active managers’ underperformance during the full 1992-2017 is not accounted for by these factors. A majority of active managers did not make good decisions on average, decisions that were easy enough that a robot could make them.
Results by subperiod
During the Tail of the Great Bull (1992-1999), the Fama-French value benchmark outperformed all but one fund (Torray Fund). In a straight-up market, benchmarks have an advantage because they do not hold cash; furthermore, active managers often diversify by holding less value-laden stocks. But the outperformance of the benchmark is astounding – it beat the median active value fund by 500 basis points per year, compounded over eight years.
The Tech Crash and Recovery period (2000-2007) threw growth investors for a loop, while value roared ahead of market averages much in the way that it did before 1985. But the Fama-French benchmark fell to the middle of the pack as many active value managers outperformed it. During this period, value index funds began to be more popular and provided a more widely accepted alternative to active value management. This may partially explain the fall in the rank of the benchmark, as only the better active managers survived the competitive pressure from value index funds.
Finally, the current period, which I call the Global Financial Crisis and Recovery (2008-2017), is widely thought of as one during which value failed to deliver. Still, the Fama-French value benchmark narrowly outperformed the S&P 500, as did the median active value manager. Interestingly, the benchmark produced a return below that of the median manager, a result we had not seen before.
A smarter robot?
To see if I was missing something, I also compared the manager universe to a potentially smarter robot, one that tracks the Russell 1000 Value index. This sophisticated index is constructed using multiple factors, a considerable advance over any single-factor model like the Fama-French value index. If the idea of a style index is to replicate what human analysts typically do, looking at multiple factors is a good start. Of course, no style index can fully mimic the intuition that a human would bring to the problem. That’s why I’m calling the Russell 1000 Value a smarter robot, but a robot nonetheless.
The results are a blowout. Over 1995-2017, the smarter robot beat WDRVX and the manager composite. Once again, the month-by-month results look like the standings of the 2016 Cubs: the robot’s cumulative index was ahead of the manager composite as of every month-end.[12]
Bottom line…
First, the popularity of value investing may have led to “overgrazing” and an erosion of the value premium. Such overgrazing is difficult to identify and measure.
Second, regarding the important question of active versus passive, Kok, Ribando and Sloan raise legitimate concerns about the use of “robots,” or passive processes, to construct portfolios (style index funds). These funds not only ignore human knowledge about individual companies and sectors but also throw away any intuition that human analysts might have about the exaggeration, intentional or otherwise, of book values, earnings, or cash flows. The Fama-French value benchmark also ignores past growth rates, which can be calculated mechanically, as well as forecasts of future growth rates, which are based on intuition and research.
Yet the robots comfortably beat the active manager composite and almost all of the individual managers over the full period and in one of the three subperiods. In the other two subperiods it was close to a tie. If there is a threat to robot value managers from typical human value managers, I did not find evidence of it. Active management is hard.
The very best value managers, of course, earned – and will earn – returns superior to any benchmark. They may, in fact, be more likely to do it in the current century, because value index funds have now grown to the point that they have driven many of the bad active managers out of business.
But, as I said earlier – and it bears repeating – the trick is in identifying such skilled active managers in advance. There is no magic formula for doing that.
BIBLIOGRAPHY
Asness, Clifford S., Andrea Frazzini, Ronen Israel, and Tobias Moskowitz. 2015. “Fact, Fiction and Value Investing.” Journal of Portfolio Management, vol. 42, no. 3 (Fall): 34–52.
Basu, Sanjoy. 1977. “Investment Performance of Common Stocks in Relation to Their Price-Earnings Ratios: A Test of the Efficient Market Hypothesis,” Journal of Finance, Vol. 32, no. 3 (June), pp. 663-682.
Black, Fischer. 1993. “Beta and Return.” The Journal of Portfolio Management, Vol. 20, No. 1 (Fall): pp. 8-18.
Fama, Eugene F., and Kenneth R. French. 1992. “The Cross‐Section of Expected Stock Returns.” Journal of Finance, vol. 47, no. 2 (June): 427–465. Updates by the authors at http://mba.tuck.dartmouth.edu/pages/faculty/ken.french/data_library.html
Kok, U-Wen, Jason Ribando, and Richard Sloan. 2017. “Facts About Formulaic Value Investing.” Financial Analysts Journal, forthcoming.
Grantham, R. Jeremy. 2017. “This Time Seems Very, Very Different.” GMO Quarterly Letter (1st quarter).
Ibbotson, Roger G., and Thomas M. Idzorek. 2014. “Dimensions of Popularity.” Journal of Portfolio Management, Special Anniversary Issue.
Rosenberg, Barr, Kenneth Reid, and Ronald Lanstein. 1985. “Persuasive Evidence of Market Inefficiency,” Journal of Portfolio Management, Vol. 11, No. 3 (Spring): pp. 9–16.
Sexauer, Stephen C., and Laurence B. Siegel. 2017. “Floods and Deserts: Why the Dream of a Secure Pension for Everyone is Still Unattained.” Journal of Retirement (Spring).
[1] According to Julie Segal, whose Institutional Investor article reported on the paper, they “suck” at it; this is a family newspaper, so I’ll tone down my language.
[2]In 1993, Fischer Black wrote:
When a researcher tries many ways to do a study, including various combinations of explanatory factors, various periods, and various models, we often say he is “data mining.” If he reports only the more successful runs, we have a hard time interpreting any statistical analysis he does. We worry that he selected, from the many models tried, only the ones that seem to support his conclusions. With enough data mining…[or,] less formally…“hindsight,”…. all the results that seem significant could be just accidental.
Data mining is most severe when many people are studying related problems. Even when each person chooses his problem independently of the others, only a small fraction of research efforts result in published papers. By its nature, research involves many false starts and blind alleys. The results that lead to published papers are likely to be the most unusual or striking ones. But this means that any statistical tests of significance will be gravely biased.
The problem is worse when people build on one another’s work. Each decides on a model closely related to the models that others use, learns from the others’ blind alleys, and may even work with mostly the same data. Thus in the real world of research, conventional tests of significance seem almost worthless.
In particular, most of the so-called anomalies that have plagued the literature on investments…[such as the value effect,]… seem likely to be the result of data mining. We have literally thousands of researchers looking for profit opportunities in securities. They are all looking at roughly the same data. Once in a while, just by chance, a strategy will seem to have worked consistently in the past. The researcher who finds it writes it up, and we have a new anomaly. But it generally vanishes as soon as it’s discovered. [Black 1993]
[3] By a “profit” I mean an above-market rate of return (adjusted for the differential risk of the portfolio and the market).
[4] Ibbotson and Idzorek [2014] explicitly relate stock returns to popularity.
[5] The finding is actually older than that, having been documented by the late Sanjoy Basu in 1977, but maybe Basu’s study appealed more to academics than portfolio managers; that’s how I remember it, anyway. Thus, even though Fama and French [1992] is the best-known value-beats-growth study, it is far from being the first one.
[6] Interview with Warren Buffett, CNBC.com, March 2, 2015.
[7] Book value should not be very good at measuring fundamental value. It says, basically, that an asset is worth what you paid for it, minus depreciation at the rate prescribed by accounting standards that prevailed at the time, with no adjustment for inflation.
In times when most corporate assets were physical, and inflation was not important, book value may have had some merit as an indicator of fundamental value. Today, however, an increasing proportion of assets are intangible (patents, copyrights, business processes, contracts, and goodwill) and inflation had a profound impact on asset values from the 1960s until about the end of the last century. It is therefore a mystery that sorting stocks on price-to-book-value should do much of anything, but the results are clear: price-to-book-value is one of the most powerful anomalies in finance, and it proxies for other value metrics quite effectively.
[8] The ticker symbol WDRVX is entirely fictitious.
[9] Of course, the robot did not win in each individual month; it’s the cumulative index (set at December 1999 = 1.00) that was ahead at every month-end, thus the analogy to baseball standings (the Cubs did not win every game).
[10] Since the number of funds in the database continually changes, I calculate the statistics in Exhibit 4 using the funds for which data exist for the whole period or subperiod, except for calculating the manager composite which is the time series consisting of the simple average, each month, of the funds for which data were available that month.
The three market environments are from Sexauer and Siegel [2017], where the choice of dates is explained, although I’ve changed the names of the time periods.
[11] The Morningstar database is not survival biased; it contains returns for funds that did not survive. However, our singling out funds for analysis that had return data at both the beginning and end of the study period (or subperiod) means that our analysis is survival-biased. A typical investor in 1992 may have had an even worse experience than that shown in Exhibit 4, in that there were 106 funds as of the start date, and those that dropped out probably had subpar returns on average.
[12] It is also possible to imagine an even dumber robot than WDRVX – for instance, one that splits the market in half instead of taking the bottom 30% by price-to-book. Some value indices do that, but I didn’t have the data – my point being that I didn’t pick a particularly slow “rabbit.”
Read more articles by Laurence B. Siegel