The Failure of Mutual Funds over Long Horizons
Membership required
Membership is now required to use this feature. To learn more:
View Membership Benefits It’s common for a mutual fund to outperform its benchmark over a short time horizon – a few years – as happened with Cathie Wood’s ARKK. But new research shows that mutual funds fail dismally when performance is measured over the long horizons that retirement-focused investors face.
While investment decisions can stretch over decades, much of the research on mutual fund performance has examined outperformance over relatively short horizons. Since investors are concerned about long-term outcomes, Hendrik Bessembinder, Michael Cooper and Feng Zhang, authors of the study, “Mutual Fund Performance at Long Horizons,” published in the January 2023 issue of the Journal of Financial Economics, examined the frequency with which individual mutual funds outperformed benchmarks in terms of compound (annualized) returns over various horizons. They began by noting: “The majority of the existing empirical literature focuses on observed monthly returns and constructs performance measures, e.g. Sharpe ratios, alphas, etc. that rely on the conditional or unconditional arithmetic mean of those monthly returns.” Thus, their focus was on the impact of volatility on long-horizon returns.
Their data sample included nearly 8,000 U.S. equity mutual funds covering the 30-year period 1991-2020. They relied on a simple single-factor (beta) market model because their focus was on the effects of the compounding of random returns over long horizons, not on the question of which benchmarks or factor models were most appropriate. They chose the SPDR S&P 500 ETF Trust (SPY) as their broad market benchmark – SPY returns are net of any fees, trading costs or other expenses, and investors could have captured compound SPY returns using a simple buy-and-hold strategy with dividend reinvestment. Following is a summary of their findings:
- The percentage of funds that outperformed market benchmarks decreased with the horizon over which returns were measured.
- On average, funds were contained in the database for just 11 years.
- The excess beta-adjusted compound return was negative for the majority of funds and was even negative for some funds where the alpha estimated from monthly returns was positive – one of every six funds in the sample that had a positive monthly arithmetic mean market-adjusted return had a negative lifetime market-adjusted buy-and-hold return.
- In the monthly data, equity mutual fund returns exceeded the matched-month return to the SPY ETF for 47.2% of observations. The percentage of sample funds that generated buy-and-hold returns that exceeded buy-and-hold returns to the SPY decreased to 41.1% at the annual horizon, 38.3% at the decade horizon and 30.3% at the full sample horizon.
- Only 29.6% of a sample of the largest funds outperformed the SPY in terms of compound full sample returns – the finding that most funds underperformed the SPY was quite uniform across size-based samples.
- Fees had large effects over long horizons.
- Over 20% of funds failed to outperform one-month U.S. Treasury bills during the sample period, and more than 40% of those funds that were present in the data for less than five years underperformed Treasury bills over their lives – demonstrating the importance of the role that survivorship bias can play in the data.
- The cross-sectional distribution of long-horizon fund buy-and-hold returns was strongly positively skewed (such skewness was not observable in monthly returns) and increased with the length of the horizon. The positive skewness in compound long-horizon returns is of substantial practical importance because, in a positively skewed distribution, a potentially large majority of possible future realizations are less than the mean outcome.
- Reflecting the positive skewness in returns, the median compound fund return was less than the mean compound fund returns at all horizons except monthly.
- While positive skewness implies that many funds underperformed, some funds performed well. Out of 7,883 sample funds, 442 delivered a positive full sample compound return more than twice as large as the compound return to the SPY over the matched months, and 160 delivered compound returns three times as large as the SPY during the matched months of the full sample.
- Mutual fund investors’ aggregate wealth decreased by $1.31 trillion relative to the SPY benchmark over the sample period 1991-2020.
The fact that one of every six funds in the sample that had a positive monthly arithmetic mean market-adjusted return also had a negative lifetime market-adjusted buy-and-hold return should not be a surprise because it is well known that the arithmetic mean exceeds the geometric mean in any return sample with positive volatility. Their finding emphasizes that short-term arithmetic measures of returns such as monthly alphas – and Sharpe ratios, which rely on arithmetic mean returns in the numerator – can be misleading for long-term investors.
Their findings led Bessembinder, Cooper and Zhang to conclude that there is “a fundamental shortcoming of alpha estimated from short-horizon returns as a performance measure for a long-horizon investor.” They added: “The results reported here imply that the evaluation of fund performance is intrinsically linked to return horizon: a given fund’s performance relative to benchmarks can be positive over short horizons and negative over long horizons, even when results are measured from a single dataset.”
Bessembinder, Cooper and Zhang’s findings are based on a single-factor model, which benchmarks returns to the single factor of market beta, using the benchmark of SPY (to include live fund costs). We can also compare long-horizon mutual fund performance to more appropriate risk-adjusted benchmarks thanks to the SPIVA scorecards that compare compound mutual fund returns to compound appropriate index benchmarks for horizons of up to 20 years.
Comparison to SPIVA results
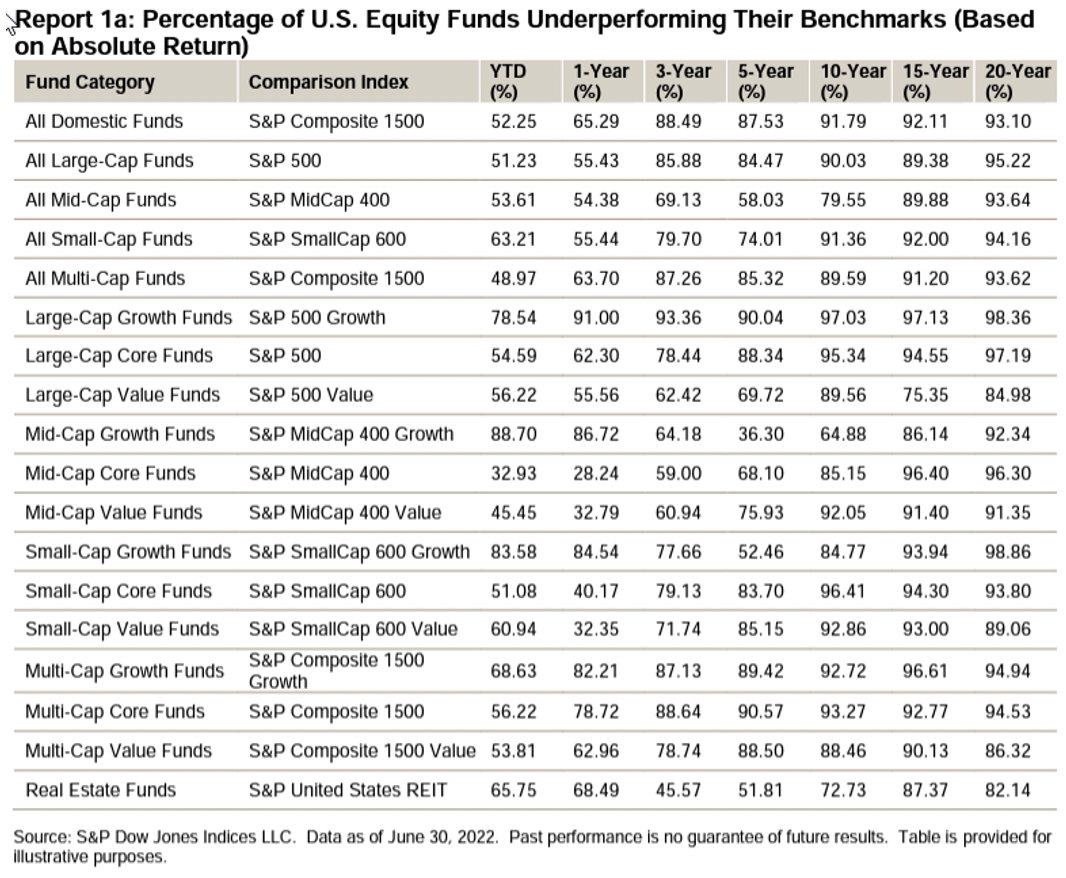
The following table presents the findings from the SPIVA U.S. Mid-Year 2022 Scorecard. As the investment horizon increases, failure rates generally increase. And adjusting the benchmark to be reflective of the index that most closely reflects a fund’s holdings, the failure rates are dramatically higher than those found by Bessembinder, Cooper and Zhang. That demonstrates that most of the outperformance found by them is well explained by factor exposures, not alpha (skill). At the 20-year horizon, of the 18 categories in the table, only four produced underperformance rates of less than 90%, while five produced failure rates of more than 95%. And for taxable investors, the failure rates would be even higher, as taxes can be the greatest cost of active management, often greater than either turnover costs or fund expenses.
Investor takeaways
The evidence presented demonstrates why active investing is a loser’s game. While it is possible to win, the odds of doing so are so small that it isn’t prudent to try. It’s like playing the lottery in that the return distribution for a long-horizon investor (and there should not be any other kind) is positively skewed with far more losers than winners (the median return is below the mean return). Investors are best served with a passive index (like SPY) or by identifying the equity factors they want exposure to and the depth of that exposure, and then selecting the systematic (passive or index) fund that provides the most cost-efficient exposure.
Larry Swedroe is head of financial and economic research for Buckingham Wealth Partners.
For informational and educational purposes only and should not be construed as specific investment, accounting, legal, or tax advice. Certain information is deemed to be reliable, but its accuracy and completeness cannot be guaranteed. Third party information may become outdated or otherwise superseded without notice. By clicking on any of the links above, you acknowledge that they are solely for your convenience, and do not necessarily imply any affiliations, sponsorships, endorsements or representations whatsoever by us regarding third-party websites. Indices are not available for direct investment. Their performance does not reflect the expenses associated with the management of an actual portfolio nor do indices represent results of actual trading. Information from sources deemed reliable, but its accuracy cannot be guaranteed. Performance is historical and does not guarantee future results We are not responsible for the content, availability or privacy policies of these sites, and shall not be responsible or liable for any information, opinions, advice, products or services available on or through them. The opinions expressed by featured authors are their own and may not accurately reflect those of Buckingham Strategic Wealth® or Buckingham Strategic Partners®, collectively Buckingham Wealth Partners. Neither the Securities and Exchange Commission (SEC) nor any other federal or state agency have approved, determined the accuracy, or confirmed the adequacy of this document. LSR-22-433
Membership required
Membership is now required to use this feature. To learn more:
View Membership BenefitsSponsored Content
Upcoming Virtual Events View All


