Low-volatility strategies are often cited as an anomaly offering higher returns without a corresponding increase in risk. But the so-called low-volatility factor is well explained by other factors, and new research shows it does not reduce exposure to “systemic,” broad-economic risks.
The superior performance of low-volatility (and the related factor of low-beta) stocks was first documented in the literature in the 1970s – by Fischer Black (in 1972), among others – even before the size and value premiums were “discovered” In 1993. The low-volatility anomaly – lower volatility stocks, with their lower exposure to equity systematic risk, outperformed higher volatility stocks – has been shown to exist in equity markets around the world. Interestingly, this finding has been true not only for stocks but for bonds. It led academic researchers to dig deeper into the evidence to determine if low volatility/beta is a unique factor.
Is low volatility a unique factor?
Both Robert Novy-Marx’s 2016 study, “Understanding Defensive Equity,” and Eugene Fama and Kenneth French’s 2015 study, “Dissecting Anomalies with a Five-Factor Model,” found that the low-volatility and low-beta anomalies were well explained by asset pricing models that included the newer factors of profitability and investment (in addition to market beta, size and value). And Stefano Ciliberti, Yves Lemperiere, Alexios Beveratos, Guillaume Simon, Laurent Laloux, Marc Potters and Jean-Philippe Bouchaud, authors of the 2017 paper, “Deconstructing the Low-Vol Anomaly,” found that once the common factors of value and profitability were controlled for, the performance of low volatility/low beta became insignificant. They concluded that “although the low-vol (/low-β) effect is indeed compelling in equity markets, it is not a real diversifier in a factor-driven portfolio that already has exposure to value-type strategies. In a nutshell, the dividend yield factor explains (as expected) the dividend part of the low-vol performance, while the earnings-to-price factor explains the ex-dividend part.”
Two other papers provided valuable insights into the low-volatility anomaly. In his 2012 paper, “Enhancing a Low-Volatility Strategy is Particularly Helpful When Generic Low Volatility is Expensive,” Pim van Vliet found that while, on average, low-volatility strategies tended to have exposure to the value factor, that exposure was time varying. The low-volatility factor spent about 62% of the time in a value regime and 38% of the time in a growth regime. The regime-shifting behavior affected the performance of low-volatility strategies. When low-volatility stocks had value exposure, they outperformed the market by 2.0 percentage points on average. However, when low-volatility stocks had growth exposure, they underperformed by 1.4 percentage points, on average.
Luis Garcia-Feijóo, Lawrence Kochard, Rodney Sullivan and Peng Wang, authors of the 2015 study, “Low-Volatility Cycles: The Influence of Valuation and Momentum on Low-Volatility Portfolios,” found that there was no alpha in a four-factor model except in extremely cheap low-volatility environments.
Macro risk and low-volatility stocks
David Blitz contributes to the literature on the low-volatility factor with his September 2022 study, “Macro Risk of Low-Volatility Portfolios,” in which he examined the exposures of low-volatility portfolios to 23 various sources of systematic risk including interest rate (six metrics), implied volatility (two metrics), liquidity (two metrics), commodity (two metrics), sentiment (five metrics), macroeconomic (four metrics) and climate risk factors (two metrics) in order to determine if they reduced the exposure to other sources of systematic risk. Blitz was motivated by the concern that because of their concentration in certain segments of the stock market, low-volatility portfolios might be similarly or even more exposed to some specific sources of systematic risk – a lower overall volatility and beta does not necessarily imply that low-volatility portfolios protect investors against all possible risk factors. For instance, what if interest rates and inflation rise rapidly (low-volatility stocks have been shown to have exposure to the term premium, as their cash flows are more bond-like), the oil price shows big swings, or industrial production plummets?
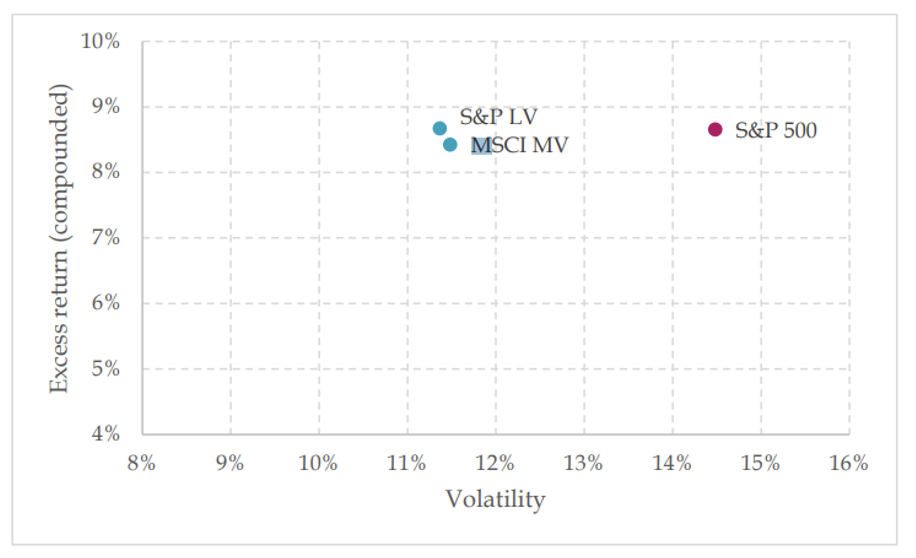
For his data set, Blitz used the S&P 500 Index as the reference point and two generic low-volatility strategies, the MSCI USA Minimum Volatility Index and the S&P 500 Low Volatility Index. The former is based on minimum variance optimization, while the latter consists of the 100 stocks in the S&P 500 with the lowest volatility over the past one year, inversely weighted by their volatilities. In addition, he considered 10 equally weighted decile portfolios of stocks sorted on their preceding 36-month volatility based on a universe consisting of the 1,000 largest U.S. stocks at each point in time (source, Paradox Investing). The chart below shows the risk and return of low-volatility portfolios versus the market over the period 1991-2021:
Following is a summary of Blitz’s key findings:
- Low-volatility portfolios exhibited a lower exposure to every structural risk factor that is a significant driver of overall systematic risk. In addition, for almost every risk factor, the low-volatility portfolio had the smallest exposure and the high-volatility portfolio the largest exposure, with a pattern in between that was almost perfectly monotonic.
- While low-volatility stocks had exposure to term risk, they were less rate sensitive than the market in an absolute sense.
- Both the market and the low-volatility portfolios had insignificant exposures to the risk-free rate level and the slope of the yield curve level – these two indicators did not appear to be relevant drivers of systematic equity risk.
- While the market did have highly significant exposures to changes in the TED spread (difference between the 3-month LIBOR and 3-month T-bill rate), changes in the break-even inflation rate (derived from inflation-linked bond prices) and changes in the default spread (difference between the yield on BAA- and AAA-rated bonds), low-volatility portfolio exposures to these three metrics were approximately one-third to one-half lower – they were considerably less exposed to these sources of systematic risk.
- While the market had very strong negative betas toward changes in the VIX (implied volatility of S&P 500 Index options) and the MOVE Index (implied volatility of Treasury bonds) – rising implied volatilities tend to coincide with negative equity returns – these exposures were much smaller for low-volatility portfolios.
- Low-volatility portfolios dampened the significant exposures of the market toward liquidity risk.
- The market had a highly significant beta toward changes in the oil price, while the low-volatility portfolios had an oil beta that was only about half as large. In addition, low-volatility stocks were less exposed to changes in aggregate carbon emissions – suggesting that low-volatility portfolios reduce exposure to climate risk.
- All the betas relative to the gold price were insignificant – it was not a relevant systematic risk factor.
- While the market had highly significant sentiment betas, low-volatility portfolios had consistently smaller betas – low-volatility portfolios were consistently less exposed to changes in sentiment.
- While the market had highly significant exposures toward all the macroeconomic indicators (GDP, unemployment, industrial production and CPI) over the subsequent quarter, low-volatility portfolios had consistently weaker exposures to these macroeconomic risk factors. The reduction in the exposures varied between roughly 20% (for unemployment) and 50% (for CPI).
- Low-volatility portfolios were less sensitive than the market to changes in aggregate corporate earnings.
Blitz did find one case when low-volatility portfolios did not reduce exposure to systematic risks.
The exception that proves the rule
As Blitz noted, no investment strategy is entirely foolproof (without risk). Instead of providing downside protection during the COVID pandemic of 2020, low-volatility portfolios experienced losses similar to the market portfolio and then lagged the market in the subsequent recovery. Blitz offered this hypothesis for the failure of low-volatility portfolios during this event: “What makes the Covid pandemic so different from the wide variety of macroeconomic risks that low-volatility portfolios can generally cope with very well? The problem appears to be that Covid caught investors completely off guard. Online stocks that used to be rather speculative, such as Zoom and Netflix, suddenly became defensive holdings when the world went in lockdown, while traditionally safe offline stocks, such as commercial real estate, suddenly became high risk. Past stock prices do not properly reflect a certain risk factor if investors previously dismissed it as irrelevant or were simply unaware of it. Bond markets, commodity markets, sentiment, and macroeconomic indicators structurally affect stock price movements, allowing low-volatility portfolios to adapt continuously to this information. But when a novel risk factor rapidly becomes the dominant theme, data-driven methods understandably need some time to adjust.”
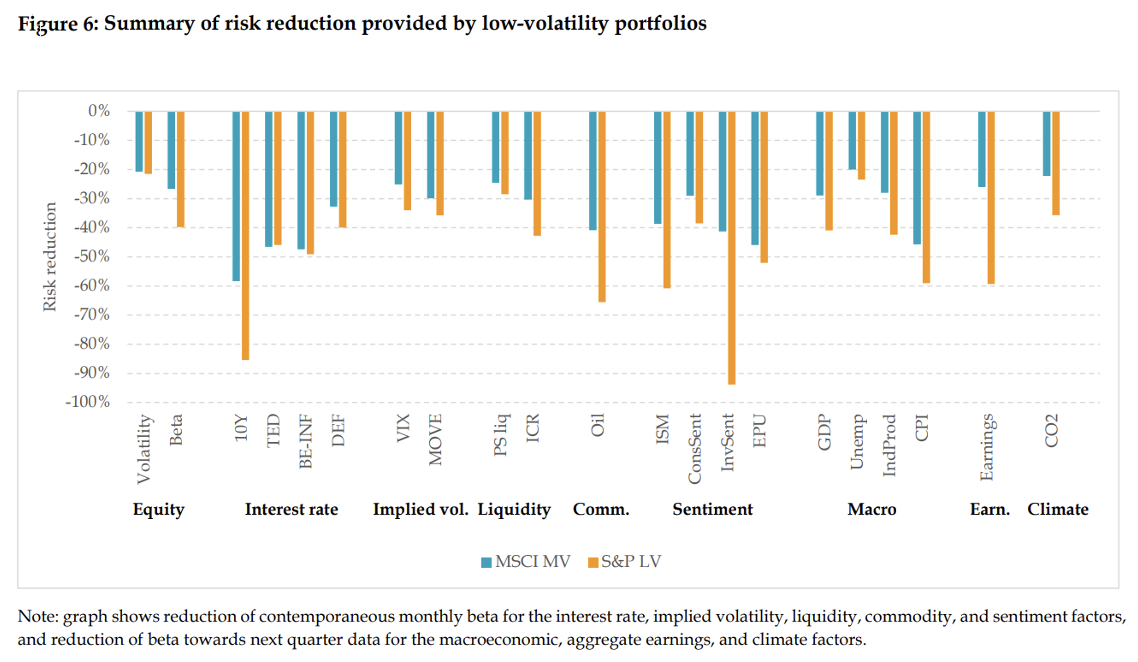
His findings led Blitz to conclude: “Low-volatility portfolios offer remarkably robust protection against a wide range of macroeconomic risk factors. … The reductions in beta exposures range from at least 20% to over 90% across the different risk factors.” (See Figure 6 above.)
Investor takeaways
Blitz showed that low-volatility strategies had reduced exposure to systematic risks. That should not be a surprise because, by definition, they have reduced market exposure. With that said, it is possible that low-volatility portfolios could have had increased exposure to certain specific sources of systematic risk due to their concentration in certain industries. Blitz showed that this fear does not appear to be justified because low-volatility portfolios reduced exposure to all 23 sources of systematic risk he examined. Another interesting benefit for those who care about sustainable investing (such as ESG strategies) is that Blitz showed that low-volatility portfolios reduce climate risk.
For those interested in pursuing low-volatility strategies because of their reduced exposure to systematic risks, the evidence from the research papers produced two important findings. First, the returns to low-volatility strategies are well explained by other common factors (there is no significant alpha in low-volatility strategies), and the returns to low-volatility strategies are highly regime dependent – they have performed best when they are in the value regime (they are cheap) and have underperformed when in a growth regime (they are expensive). With that in mind, I will examine the valuation of the iShares Edge MSCI USA Minimum Volatility Factor ETF (USMV), with $28.4 billion in assets, as of September 14, 2022, relative to that of value and growth index funds. Morningstar reported that USMV had a P/E of 18.8. The P/E of the iShares MSCI USA Value Factor ETF (VLUE) was less than half of that, at 9.1. On the other hand, the P/E of the iShares Core S&P US Growth ETF (IUSG) was 21.1, just 12 % higher than that of USMV. In other words, low volatility’s popularity has driven valuations much closer to the growth regime; one is paying a high price to obtain the risk-reduction benefits. And as the research showed, low volatility has not performed very well in such regimes. Forewarned is forearmed.
Larry Swedroe is head of financial and economic research for Buckingham Wealth Partners.
For informational and educational purposes only and should not be construed as specific investment, accounting, legal, or tax advice. Certain information is based upon third party data and my become outdated or otherwise superseded without notice. Third party information is deemed to be reliable, but its accuracy and completeness cannot be guaranteed. By clicking on any of the links above, you acknowledge that they are solely for your convenience, and do not necessarily imply any affiliations, sponsorships, endorsements or representations whatsoever by us regarding third-party websites. We are not responsible for the content, availability or privacy policies of these sites, and shall not be responsible or liable for any information, opinions, advice, products or services available on or through them. The opinions expressed by featured authors are their own and may not accurately reflect those of Buckingham Strategic Wealth® or Buckingham Strategic Partners®, collectively Buckingham Wealth Partners. LSR-22-386
Read more articles by Larry Swedroe
 Low-volatility strategies are often cited as an anomaly offering higher returns without a corresponding increase in risk. But the so-called low-volatility factor is well explained by other factors, and new research shows it does not reduce exposure to “systemic,” broad-economic risks.