New research shows that those who invest in stocks with positive environmental, social and governance (ESG) scores have improved the behavior of those companies.
While sustainable investing continues to grow in popularity, economic theory suggests that if a large enough proportion of investors choose to favor companies with high sustainability ratings (green businesses) and avoid those with low sustainability ratings (brown or “sin” businesses), green share prices will be elevated, and brown/sin shares will be depressed. In equilibrium, the screening out of certain assets based on investors’ tastes should lead to a return premium on the screened assets.
The result is that the green companies will have a lower cost of capital because they trade at a higher P/E ratio. The flip side of a lower cost of capital is a lower expected return to the providers of that capital (shareholders). And the brown/sin companies will have a higher cost of capital because they will trade at a lower P/E ratio, the flip side of which is a higher expected return to the providers of that capital. Thus, green companies that adhere to positive ESG principles are rewarded with higher valuations, lower costs of capital (both debt and equity) and are less vulnerable to systemic risks. The flip side is that because ESG investors favor companies with high ESG scores and avoid those with low ESG scores, those brown/sin companies with low ESG scores will tend to have higher costs of capital, putting them at a competitive disadvantage. Therefore, we should expect that one positive result of the popularity of ESG investing is that it will cause companies to focus on improving their ESG scores to lower their costs of capital. Are companies paying attention and are they reacting?
ESG scores are rising
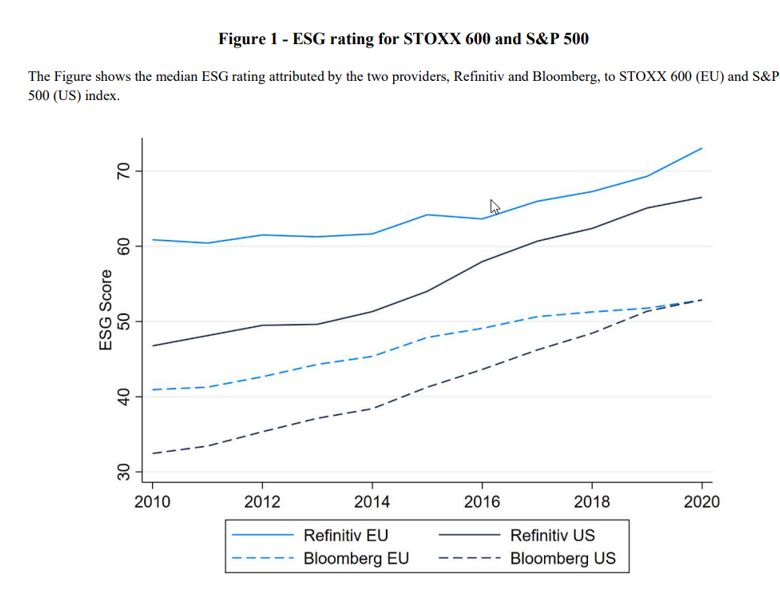
Giulio Anselmi and Giovanni Petrella, authors of the September 2022 study, “ESG Ratings: Disagreement Across Providers and Effects on Stock Returns,” examined the ESG ratings assigned by two providers, Refinitiv and Bloomberg, to companies listed in Europe (companies in the STOXX 600 European Index) and the U.S. (companies in the S&P 500 Index) over the period 2010-2020. Among their findings was that median score increased significantly in recent years for both European and U.S. companies. Figure 1 from their paper also shows that while European companies had exhibited higher scores than U.S. companies, the Refinitiv scores show that the gap has narrowed considerably since 2010, and Bloomberg’s scores show that the gap was closed by 2020.
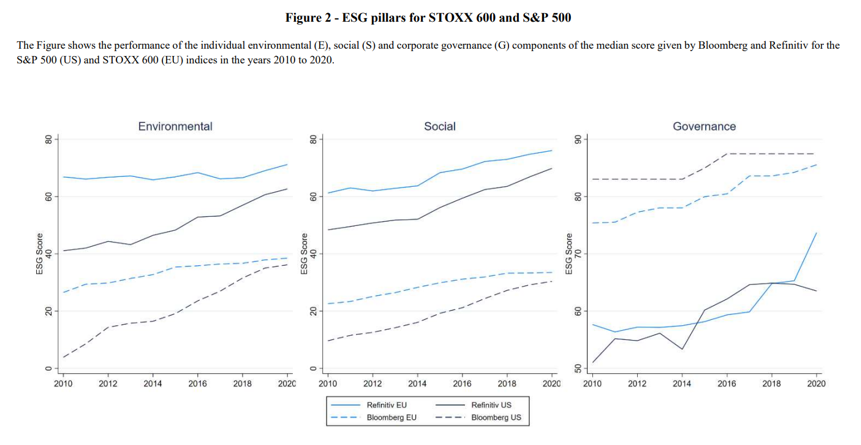
Figure 2 below shows the trend of the median score for the individual components (E, S and G) of the ESG score. The scores have improved in all three categories. For the environmental and social pillars, European companies demonstrated better performance than U.S. companies (though the gaps have significantly narrowed), while the results are less clear for governance.
Figures 1 and 2 highlight the fact that there is significant divergence in ESG scores among the leading raters. This finding is consistent with prior research.
Divergences in ratings
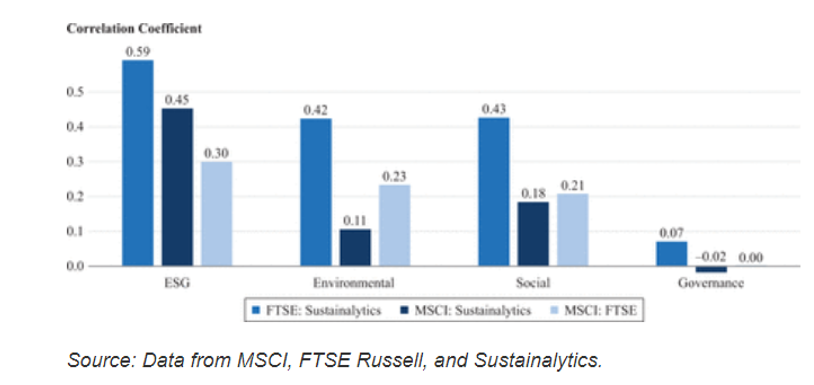
Elroy Dimson, Paul Marsh and Mike Staunton, authors of the study, “Divergent ESG Ratings,” published in the November 2020 issue of The Journal of Portfolio Management, found that while data is essential for making investment decisions and most institutions rely wholly or partly on external providers of ESG data, there is minimal correlation between ESG ratings from alternative agencies. The following chart from their study shows that the pairwise correlations of rankings from three leading providers are quite low. This is especially true for the individual components; for governance, they are virtually uncorrelated. Such divergences create problems for investors.
Dimson, Marsh and Staunton explained that the divergences are caused by a variety of factors:
- There is variety and inconsistency in the metrics that purport to measure much the same thing. The diversity of measures gives rise to considerable dissimilarity in ratings, reflecting firm-specific attributes, differing terminologies, metrics and units of measurement.
- There are differences in how raters define the benchmark for comparisons. For example, Sustainalytics compares companies to constituents of a broad market index, whereas S&P compares companies to industry peers.
- At the company level, ESG ratings are plagued by missing data. When a company does not reveal metrics, some raters assume the worst and assign a score of zero. Others impute a score that reflects the data of peers that do report. More sophisticated approaches use statistical models to estimate missing metrics but are often unclear about why a company gets a low or high rating.
- Reflecting the expansion in the volume of public information and the lack of consensus on metrics, there is greater scope for raters to disagree about the scores for particular companies.
- Weighting schemes vary greatly.
Investor takeaways
The empirical evidence of improving ESG ratings clearly demonstrates that, through their cash flows favoring companies with more favorable ESG ratings, sustainable investors are causing companies to focus on improving their ESG scores to either gain a competitive advantage or avoid being placed at a disadvantage – there is greater corporate awareness of these issues, and awareness is followed by action. That’s good news for sustainable investors, who are not only able to express their values through their investments, but now have evidence that they are causing companies to become better citizens and capitalism to evolve to address sustainability.
Larry Swedroe is head of financial and economic research for Buckingham Wealth Partners.
For informational and educational purposes only and should not be construed as specific investment, accounting, legal, or tax advice. Certain information is based upon third party data which may become outdated or otherwise superseded without notice. Third party information is deemed to be reliable, but its accuracy and completeness cannot be guaranteed. Indices are not available for direct investment. Their performance does not reflect the expenses associated with the management of an actual portfolio nor do indices represent results of actual trading. Information from sources deemed reliable, but its accuracy cannot be guaranteed. By clicking on any of the links above, you acknowledge that they are solely for your convenience, and do not necessarily imply any affiliations, sponsorships, endorsements or representations whatsoever by us regarding third-party websites. We are not responsible for the content, availability or privacy policies of these sites, and shall not be responsible or liable for any information, opinions, advice, products or services available on or through them. The opinions expressed by featured authors are their own and may not accurately reflect those of Buckingham Strategic Wealth® or Buckingham Strategic Partners®, collectively Buckingham Wealth Partners. Neither the Securities and Exchange Commission (SEC) nor any other federal or state agency have approved, determined the accuracy, or confirmed the adequacy of this article. LSR-22-448
Read more articles by Larry Swedroe
 New research shows that those who invest in stocks with positive environmental, social and governance (ESG) scores have improved the behavior of those companies.