Wild swings in the “world’s safest asset” are once again acting as a driver for volatility across global markets.
Treasury yields saw a sharp reversal Monday after the 10-year benchmark briefly breached 5%, with bonds flipping around as a resilient US economy makes it hard for investors to work out when the Federal Reserve will halt rate hikes. Surging government bond issuance and geopolitical tensions are also clouding the outlook.
Here’s some charts that put the recent moves in context:
Bond Swings Beginning to Infect Equities
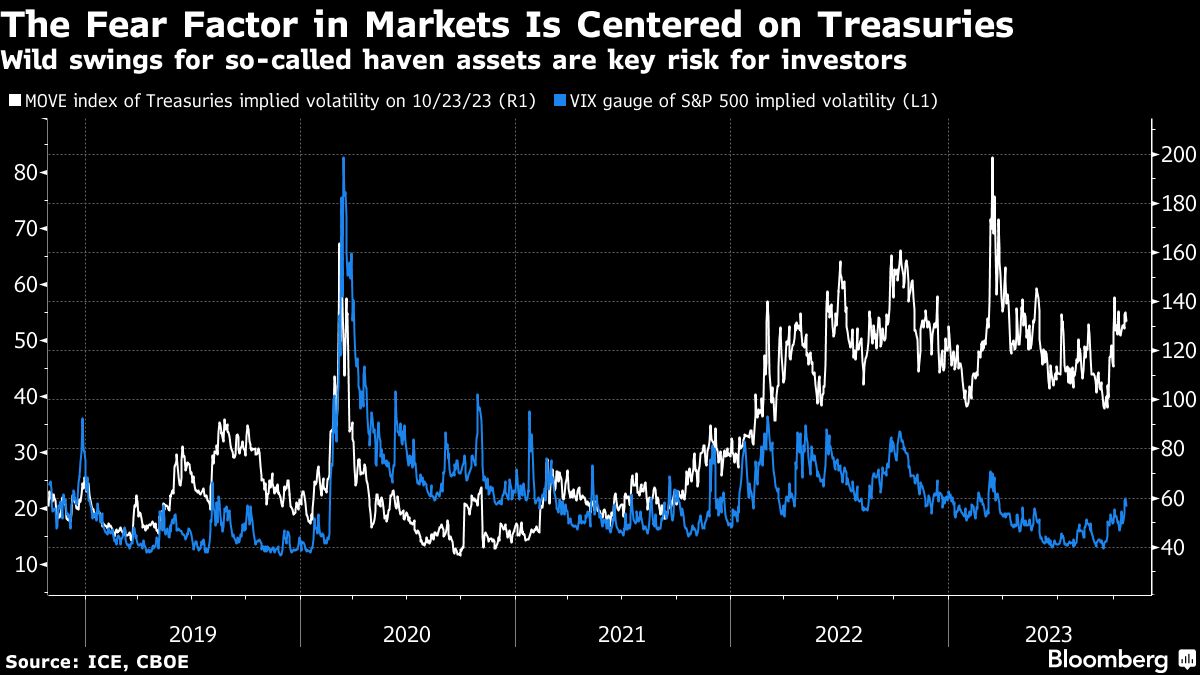
The so-called fear gauge for Treasuries — ICE’s BofA MOVE index of implied volatility — has been elevated since the Federal Reserve began its tightening cycle, without having a significant impact on the equivalent equities indicator, the VIX index. That’s changing this month as bond volatility rebounds.

Treasuries Swing More Than Stocks
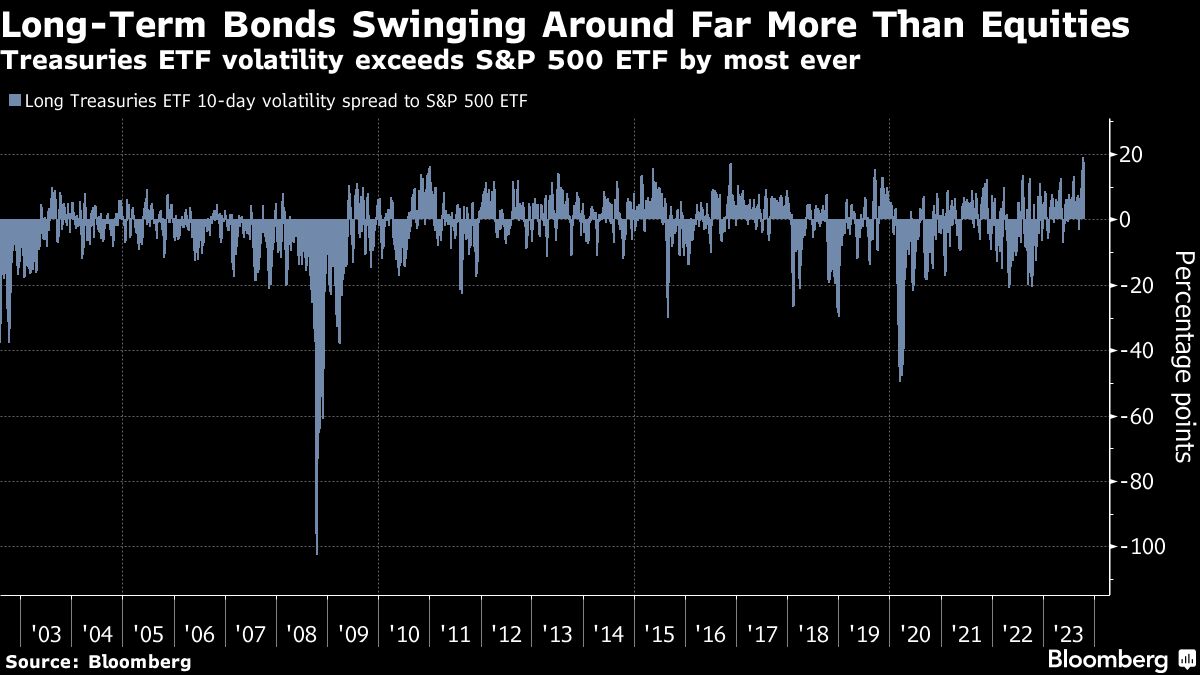
Ten-day volatility for an iShares exchange-traded fund tracking longer-dated bonds is more than 15 percentage points above that of a popular ETF tracking the S&P 500. That’s flipped their traditional relationship on its head since the volatility on the bond fund has averaged 2 points lower than the equities one over the past 20 years.
“That volatility is telling you that the markets are confused,” said Stephen Miller, a three-decade bond market veteran who now works as an investment consultant at GSFM. “You can also blame the geopolitics for that a bit, as well as some of the ill-disciplined approach to fiscal policy that we’ve seen out of the US.”
Treasuries More Volatile Than Most Peers
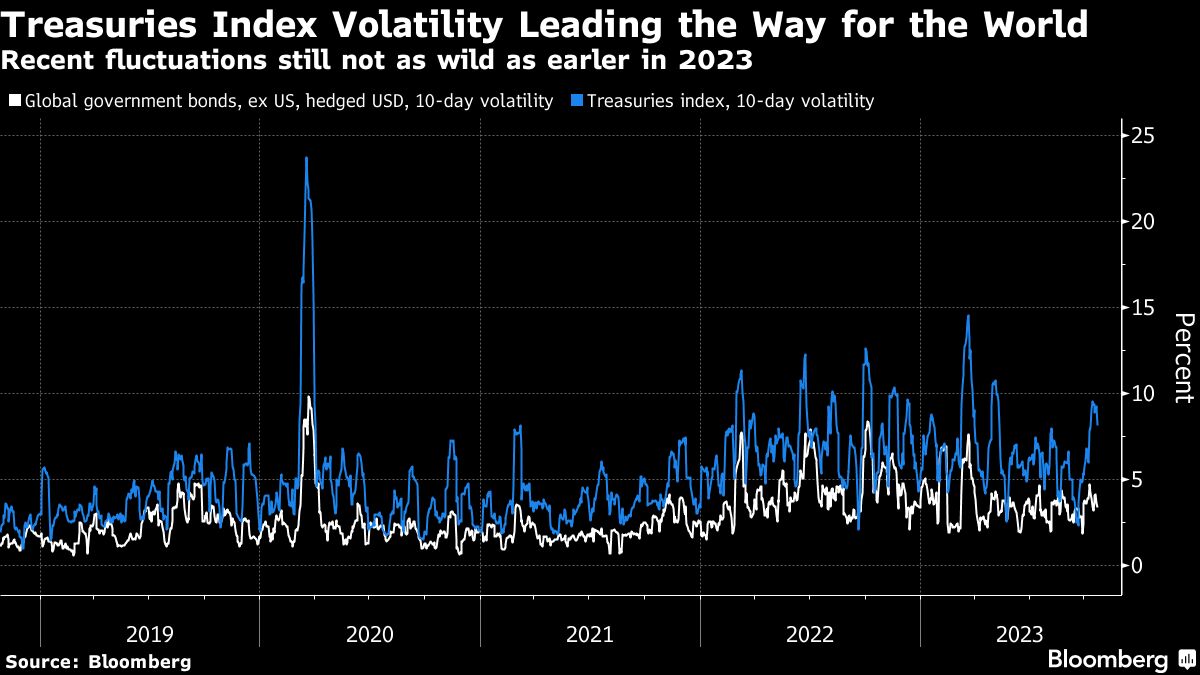
Still, investors in a total-return Treasuries index will have seen bigger swings earlier this year, a function of comparing percentage moves in a basket of bonds to absolute yields in the securities themselves. Ten-day volatility for Bloomberg’s gauge of US bonds is running well below 2023 peaks, though above swings for non-US government debt.
Some Developed Bond Markets Still Wilder
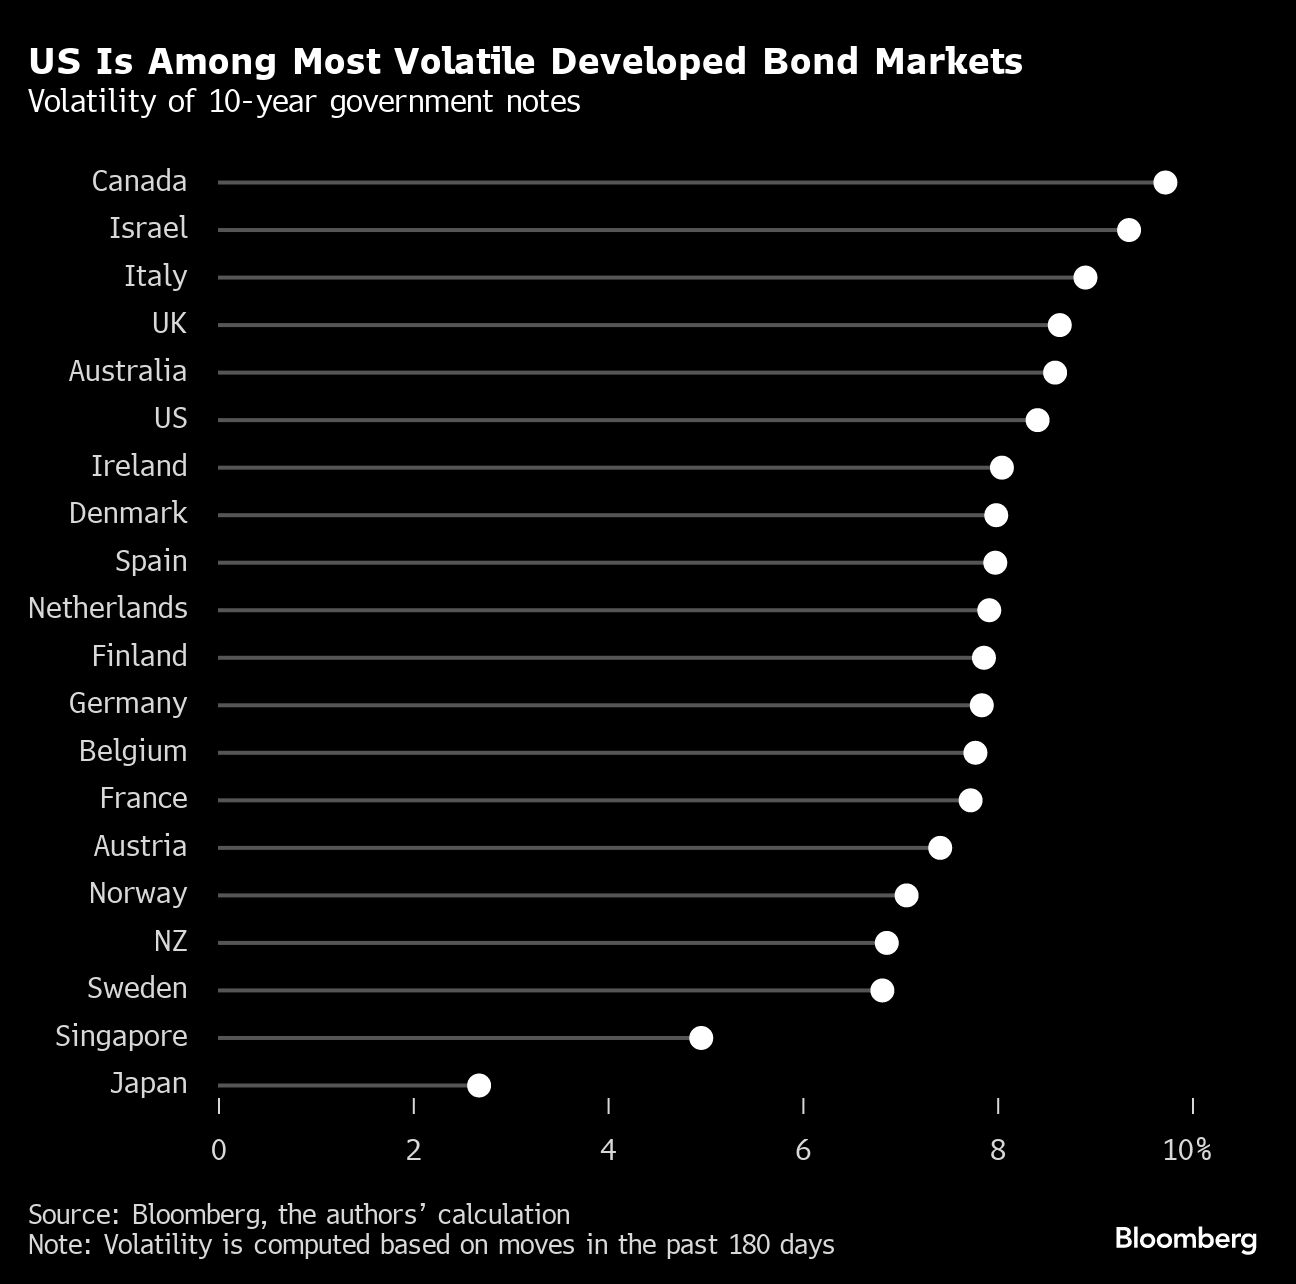
While US government bond price volatility is well above that for most peers, it is still eclipsed by markets such as Canada, Israel, Italy and the UK.
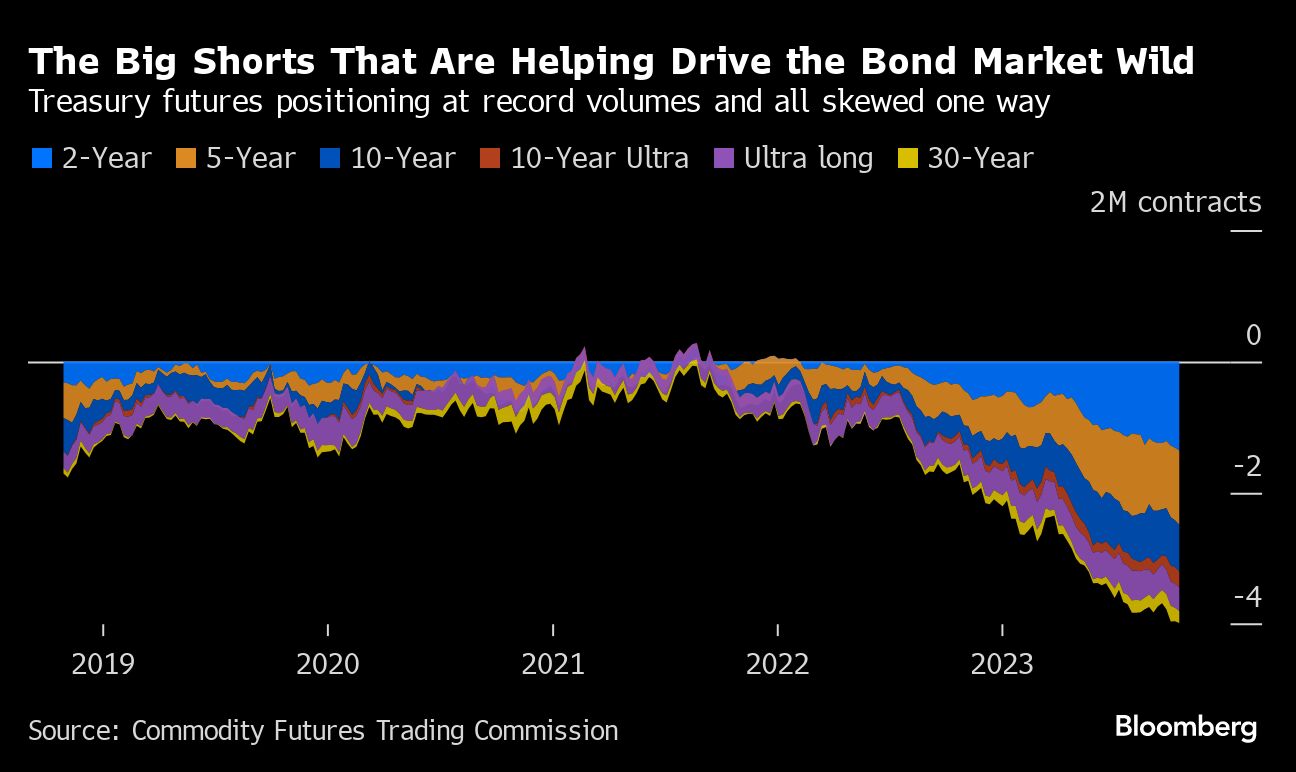
Big Shorts May Be Fueling Instability
Monday’s sudden turnaround smacked of short covering — and futures traders have never been so overwhelmingly skewed toward betting on declines in bonds. The extremes in positioning have been blamed on an explosion in so-called basis trades — placed to benefit from the mismatch between the prices of futures and of the underlying bonds.
The fact that such trades helped blow up the Treasuries market amid the pandemic adds to concerns these big shorts are a major source of turmoil.
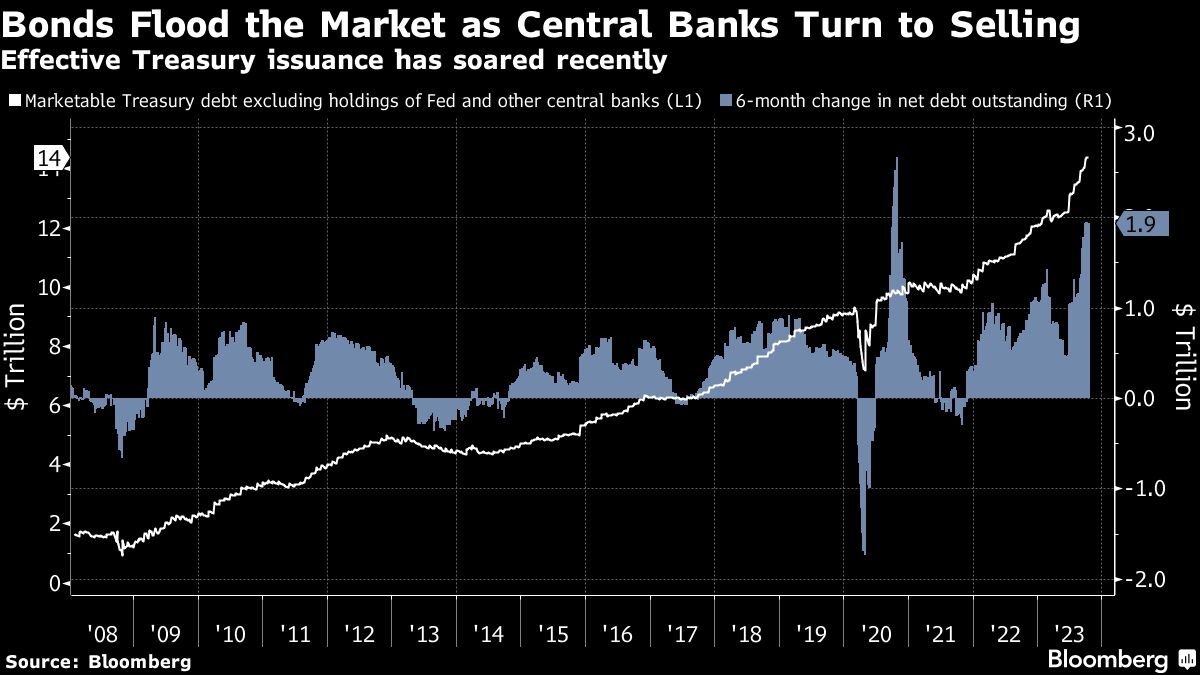
Supply Surge Makes Market Fragile
Then there’s the problem of far more supply than the market has been used to. While the US government is boosting issuance, the Fed and other central banks are turning from buyers to sellers. That’s sent effective net issuance soaring.
Suddenly, price matters for Treasuries in a way it has rarely done over the past decades.
A message from Advisor Perspectives and VettaFi: To learn more about this and other topics, check out our most recent white papers.
Bloomberg News provided this article. For more articles like this please visit
bloomberg.com.
Read more articles by Garfield Reynolds