Advisor Perspectives welcomes guest contributions. The views presented here do not necessarily represent those of Advisor Perspectives.
In a recent piece, I analyzed the construction of downside-protected strategies. Here, I propose a measure of the relative attractiveness of these strategies over time and examine their historical performance.
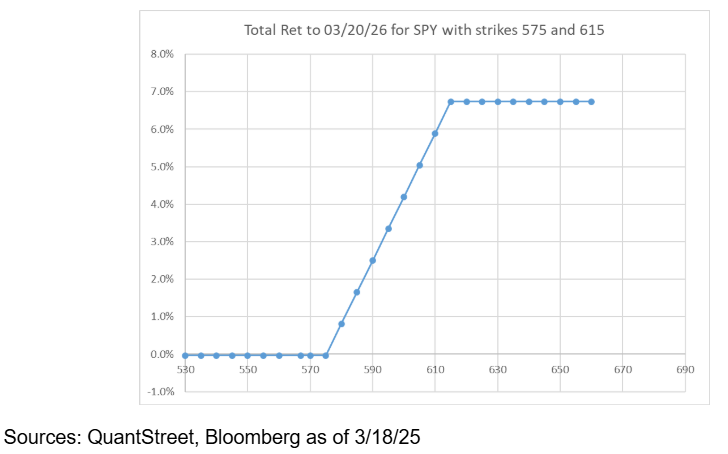
To briefly recap, using one-year T-bills and call options (or using the underlying stock and one-year put and call options), investors can produce the following payout, shown in the below graph, as a function of the future price of the SPDR S&P 500 ETF Trust (SPY). (SPY is an ETF that tracks the S&P 500 index.)
If, in one year, SPY finishes at or below 575, investors will receive a 0% return on their investment. If SPY finishes at or above 615, investors will receive a payout capped at 6.7%, the upside cap. For values between 575 and 615, investors’ payouts will increase dollar-for-dollar with the level of SPY. For the present analysis, the downside is limited to a zero percent return in all cases, and the strategy starts to make money if the future SPY price exceeds its current level. As we discuss in the original piece, the trade can be constructed differently. One variation is to allow for a negative downside, which would then increase the upside cap.
You can think of the 6.7% in the above example as a measure of the “attractiveness” of this zero-loss strategy. Upside caps lower than 6.7% make the strategy look less attractive, because the amount of possible upside due to a strong underlying market return is lower. Similarly, upside caps higher than 6.7% make the strategy look more attractive.
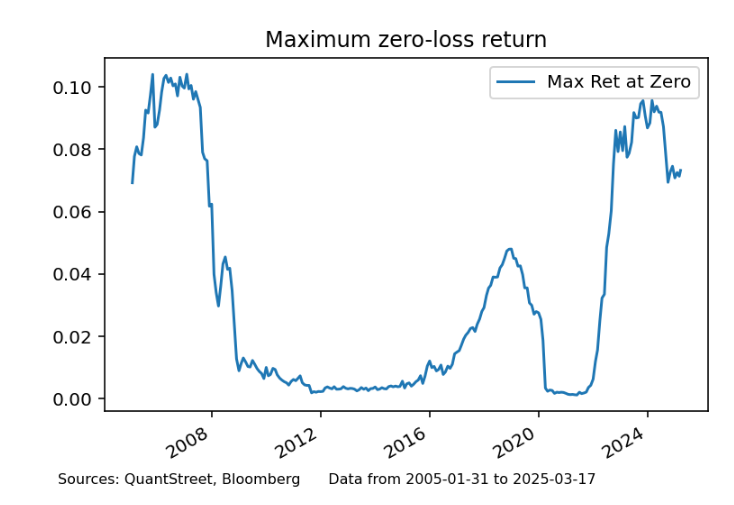
The next chart shows the upside cap of such one-year zero-loss strategies over the last 20 years.
The maximum upside of the strategy was as high as 10% back in early parts of the sample. Then the upside cap dipped to almost zero after the global financial crisis, increased to just under 5% in 2018, fell back to zero during the onset of COVID-19, and increased recently to a high of 9.6% in late 2023 and early 2024, before falling to the current 7% range. Based on the above chart, the current upside cap is still at a high level relative to its history, although it is around 2.5% lower than its recent peak.
Drivers of the upside cap
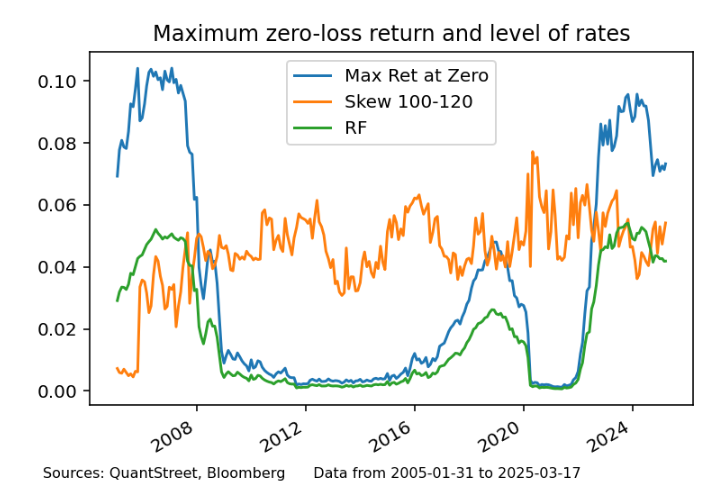
To better understand what drives this variation in the upside cap, the next chart reproduces the above picture while adding two more time series: the one-year T-bill rate (in green) and the 100-120 option skew (in orange, explained below).
It is immediately clear from the chart that one of the main drivers of the upside cap is the prevailing level of one-year interest rates. The reason is that one of the replicating strategies for the payoff shown at the start of this article is to buy a one-year T-bill and a call spread (which buys an at-the-money call and sells an upside strike call calibrated to ensure the trade has zero downside). The higher the yield on the one-year T-bill, the more that part of the trade earns, and the higher will be the upside cap. When the yield on the one-year T-bill is close to zero, the upside cap on the strategy also gets close to zero. When the one-year T-bill rate is high, the zero-loss strategy’s upside cap is similarly high.
The option skew part of the trade gets us into wonky options stuff. The call spread involved in constructing the limited downside strategy buys an at-the-money call option and sells an upside-strike call option. The difference in implied volatility between the option being bought and the option being sold is called the “option skew.” The higher the skew, the more expensive the call spread, which means the upside cap of the limited downside strategy will be lower. The lower the skew, the cheaper the call spread, which leads to a higher upside cap. More details about this are in the appendix.
A rule of thumb is that: 1) when one-year T-bill rates are high; and 2) when the option skew is low, the upside cap on the zero-loss strategy will be high. Right now, rates are relatively high, but so is the skew, which means the upside cap on the zero-loss strategy is a bit off from its recent highs.
Historical performance
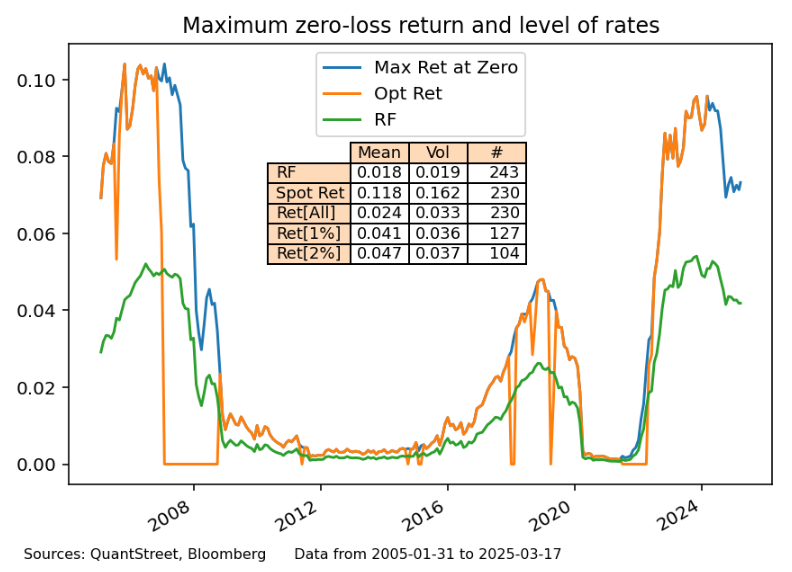
To better understand how the strategy performed historically, the next figure shows the zero-loss strategy upside cap (in blue), the return on the one-year T-bill (in green), and the actual year-ahead return realized by the zero-loss strategy over the subsequent year (labeled Opt Ret, in orange). The Opt Ret series is occasionally equal to the upside cap (labeled Max Ret at Zero), occasionally equal to zero, and at all other times, is between these two extremes. Note that all three series represent investable returns.
The table in the figure uses rolling monthly observations to calculate the mean and standard deviation (or volatility) of year-ahead returns. The “#” column in the table shows the number of one-year-ahead periods available for calculating average returns and volatilities (except for the one-year T-bill rate, labeled “RF,” which just uses the prevailing level of the one-year yield in every month).
The first row in the table shows that the return from investing in a one-year T-bill over this time period averaged 1.8% per year, with a volatility of 1.9%. The next row, Spot Ret, tracks the annual returns of the SPY ETF. In this sample, SPY had an average return of 11.8% per year, with a volatility of 16.2%. The row labeled Ret[All] shows that the average one-year-ahead return from entering the zero-loss limited downside strategy in every month of the sample was 2.4% per year, with a volatility of 3.3%.
However, this arguably understates the economic benefit of this strategy, because it is unlikely that investors would have entered this trade when the upside cap was very low. For example, from 2012 to 2016, the upside cap on the strategy was close to zero, so the relative benefit of the investment was minimal. The next two rows of the table show the limited downside strategy average return and volatility, conditional on entering the trade only in months when the upside cap is above some threshold. Ret[1%] shows that when the trade is entered only when the upside cap is above 1%, the average historical return has been 4.1% per year, with a volatility of 3.6%. If the entry threshold for the upside cap is set to 2%, the strategy’s average return is 4.7% with a volatility of 3.7%.
Conclusion
Investors and advisors must decide whether the above return profiles are a good match for their portfolios. In addition, entry points matter. Obviously, entering the zero-loss limited downside position when the upside cap is a paltry 1% or lower is likely a bad idea. Entering the position when current short-term rates are high and when the option skew (i.e., cost of buying the call spread) is low – which together contribute to a high upside cap – could be attractive, depending on one’s specific circumstances.
Appendix
Back in the 1970s, Robert Merton, Myron Scholes, and Fischer Black derived their famous option pricing formula. One of the important inputs into the option pricing formula is the market’s belief about what future stock volatility will look like; this is called the “implied volatility” (in practice, the implied volatility reflects several other considerations as well). Because options give their holders the right, but not the obligation, to buy or sell stock in the future, higher volatility makes option prices higher. (You can read more about this here.)
A call spread, which gets purchased as part of the limited downside strategy, involves buying a low strike call option and selling a high strike call option (the strike is the price at which the option allows you to buy a stock in the future). The call spread is relatively cheap – which raises the upside cap of the strategy – when the implied volatility of the option being bought is relatively low compared to the implied volatility of the option that is being sold. The option skew (the orange line in the third chart) is a measure of the difference between the low strike option’s implied volatility and the implied volatility of the higher strike option.
Because of events surrounding the October 1987 stock market crash, the implied volatility of lower strike options is usually higher than the implied volatility of higher strike options. The 100-120 option skew is a measure of the difference between the implied volatility of at-the-money options and the implied volatility of options whose strike equals 120% of the spot price.
When the skew is higher, the price received for the upside call is relatively lower, and the limited downside strategy has a lower upside cap. When the skew is lower, the price received for the upside call is relatively higher, and the limited downside strategy has a higher upside cap.
Harry Mamaysky is a professor at Columbia Business School and a partner at QuantStreet Capital.
QuantStreet is a registered investment advisor. It offers wealth planning, separately managed accounts, model portfolios and portfolio analytics, as well as consulting services. The firm’s approach is systematic and data-driven, but also shaped by years of investing experience. To work with or learn more about QuantStreet, contact the firm at [email protected].
A message from Advisor Perspectives and VettaFi: To learn more about this and other topics, check out some of our webcasts.
Read more articles by Harry Mamaysky
 Advisor Perspectives welcomes guest contributions. The views presented here do not necessarily represent those of Advisor Perspectives.