Whistling Past the Graveyard
Membership required
Membership is now required to use this feature. To learn more:
View Membership Benefits The views presented here do not necessarily represent those of Advisor Perspectives.
Surely, you’ve heard this comforting advice, trotted out for those preparing to retire: “Good news! You will only have to cover 70% of your pre-retirement spending, because … you don’t have the money to fund anything more!”
Oops. We said the quiet part out loud. It would indeed be sweet if, at the instant of retirement, you could reduce your spending by 30% to live just as well as the moment before you retired. (It’s maddeningly difficult to trace the origins of this bit of financial folklore; many credit it to decades-old research by T. Rowe Price.)
Think about it. Was there any other point in your life where you could have cut spending by 30% without any reduction in lifestyle? Oh, you might have had occasion to cut spending by 5%. That’s believable: First, a screaming match with your spouse about their profligate habits, then pulling the teenagers’ credit cards, then cancelling this year’s cruise because you were so bored last time — yeah, maybe.
But 30% less? Voluntarily, even though you have plenty of money and now have a lot more free time here in retirement?
Oh, come on.
Spending provides utility — human happiness, insofar as that can be gained from spending. No one outside a monastery voluntarily accepts lower utility without external compulsion — especially not a decrease, where external compulsion means you did not save enough to maintain the lifestyle that you willingly chose in your mature 50s and were able to fund while you were working.
In this life, you spend whatever you don’t save. If you were to save 30% of your income while working, and then stopped saving at retirement, then of course retirement spending might be only 70% of that pre-retirement income. In other words, you would continue to spend exactly as before. (This is a common cause of confusion: To repeat, we’re discussing reducing spending to 70% of its pre-retirement level, not spending 70% of pre-retirement income, assuming you’ve been saving 30% of income.)
Because that is the human way — if spending doesn’t actually kick up for a while, per Dave Blanchett’s widely quoted article on the retirement smile (in which spending is high during the initial “go-go” retirement years, then falls as health begins to fail, then rises during the final, medically intensive years).
The Fairytale of Decreased Spending
What could be more reassuring than believing that your spending will fall substantially in retirement, thus decreasing the amount you must save in order to meet that spending? Superficially, this seems to make sense: FICA taxes go away, as do your mortgage payments, college tuition bills, and commuting costs. Plus, you now have all sorts of free time in which to fix up the house and take advantage of early bird meals and geezer movie tickets.
Trouble is, for each of these happy stories, there’s an equal and opposite counterargument: First and foremost, the government does not include FICA taxes in the personal consumption measures discussed below. Next, few retirees pay off both their mortgages and kids’ college expenses precisely at age 64 years and 11 months. Finally getting to see Paris and visits to grandkids will more than offset your commuting costs, and all that extra free time may well be consumed by other expensive activities.
But please don’t take our word for it: There is an immense amount of data out there on how people spend before and after retirement. And, alas, this research reveals two serious problems that undermine the happy talk about how spending will surely drop.
First, overall, it’s not actually true: The best data show that the spending falls far less than the 20%–30% conventional wisdom. Anqi Chen and Alicia Munnell’s 2021 Center for Retirement Research (CRR) study, for example, showed that spending fell only about 0.75% per year in their overall population, and 0.3% per year for the healthiest and wealthiest groups. At the mid-point of a 20-year retirement, this computes to, respectively, spending decreases of 7.5% and 3%.
Another authoritative study by Michael Hurd and Susann Rohwedder echoed the above relationship between wealth and post-retirement spending changes. Their data showed only an overall 4.4% drop in consumption. More tellingly, they found changes of -7.4%, -18.3%, -1.6%, and +6.6%, respectively, in the first (lowest) through fourth (highest) wealth quartiles.
This data sequence suggests that those in the lowest wealth quartile, perhaps because they spent their lives pinching pennies, saw only a relatively modest 7.4% consumption fall. Those in the second quintile, who took the biggest hit to spending, may not have realized that in spending almost everything they earned while working, they accumulated too little to continue that spending when wages stopped. Those in the third quartile were nearly able to maintain their pre-retirement consumption, while the wealthiest began splashing out in a way they had not while working.
Another study by B. Douglas Bernheim and his colleagues, which sorted retirees by both wealth and income, likewise showed the smallest/largest consumption falloffs at the highest/lowest wealth and income quartiles. Additionally, those simultaneously in both the highest wealth and income quartiles spent more in retirement.
Finally, the famous Blanchett “smile” piece showed significant drops in post-retirement consumption in only two of their four subgroups, little change in one subgroup, and a significant rise in the remaining subgroup — the one with high net worth and low pre-retirement spending.
Underfunded Retirements
In a previous piece we talked about the gross inadequacy of 401(k) savings, with the median account balance at retirement barely cracking six figures. It might be objected that retirees have other assets. Many 401(k) owners have defined benefit (DB) plans and IRAs, and many more have substantial housing assets and a healthy Social Security stream. Does including these additional asset piles change the picture?
Perhaps the best compilation of data on the financial health of retirees comes from a study by MIT’s legendary James Poterba, which dissected the total assets of multiple age cohorts. We strongly recommend that anyone managing other people’s money — or their own — download and read it carefully before rendering an opinion about the adequacy of Americans’ retirement savings.
In the first through fourth quartiles of income for Americans 65 and older, the percentages of income from Social Security were, respectively, 85%, 84%, 57%, and 18%. Perhaps the most stunning data in the paper comes from the compilation of retirement accounts by the types owned by Americans aged 55–64 — that is, pre-retirees — in descending order of total assets:
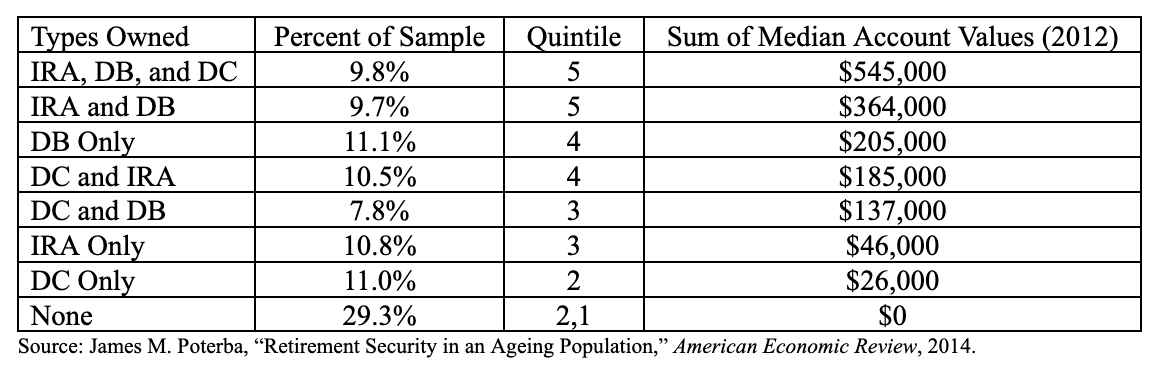
These data are more than a decade old, and one might think that the high subsequent security returns paint a sunnier picture. Sadly, no: While Poterba has not updated the above comprehensive survey, the data on DC plan balances is downright depressing. For example, Vanguards’ “How America Saves” series shows that between 2013 and 2024, the median DC plan balance of the age 55–64 cohort that they custody increased from only $72,957 to $95,642 — slightly less than the CPI rise, a disappointing result that is likely due to “leakage” of balances and the dynamism of the evolving age cohorts.
Only the top quintile of retirees represented in the above table — roughly, the first two groups — have anything close to a passable nest egg, and even those in the fourth quintile would be hard pressed to sustain $10,000 of real annual spending (in 2012 dollars). The bottom three quintiles represented in the bottom four rows correspond to the bottom half of the distribution described earlier, who depend on Social Security for 84%–85% for their retirement income, for whom sustaining even 70% of their pre-retirement spending would be a stretch.
The Difference Between a Choice and a Requirement
At the risk of assaulting an already deceased equine, happy talk about decreased spending in retirement strikes us as the whistling-past-the-graveyard rationalization of those who fear they haven’t saved enough. Yes, Virginia, on average, spending does fall after retirement, but this has nothing to do with disappearing FICA payments, mortgages, and college tuition, let alone eating out before 6 p.m. or paying a buck less for the matinee, and everything to do with suppressing feelings of dread about whether one has got enough money.
In plain English, the average retiree spends less than while working because they have to, not because they want to. Advisors and prospective retirees should take care not to confuse the two.
Edward F. McQuarrie, Ph.D., is Professor Emeritus at Santa Clara University. He writes about financial history and its implications for retirement planning. Working papers describing his research can be downloaded here.
William J. Bernstein is a neurologist, the co-founder of Efficient Frontier Advisors, an investment management firm, and a writer with several titles on finance and economic history. He has contributed to the peer-reviewed finance literature and has written for several national publications, including Money Magazine and The Wall Street Journal. He has produced several finance titles, and four volumes of history, The Birth of Plenty, A Splendid Exchange, Masters of the Word, and The Delusions of Crowds about, respectively, the economic growth inflection of the early 19th century, the history of world trade, the effects of access to technology on human relations and politics, and financial and religious mass manias. He was also the 2017 winner of the James R. Vertin Award from the CFA Institute.
A message from Advisor Perspectives and VettaFi: To learn more about this and other topics, check out some of our webcasts.
Membership required
Membership is now required to use this feature. To learn more:
View Membership BenefitsSponsored Content
Upcoming Virtual Events View All


