Advisor Perspectives welcomes guest contributions. The views presented here do not necessarily represent those of Advisor Perspectives.
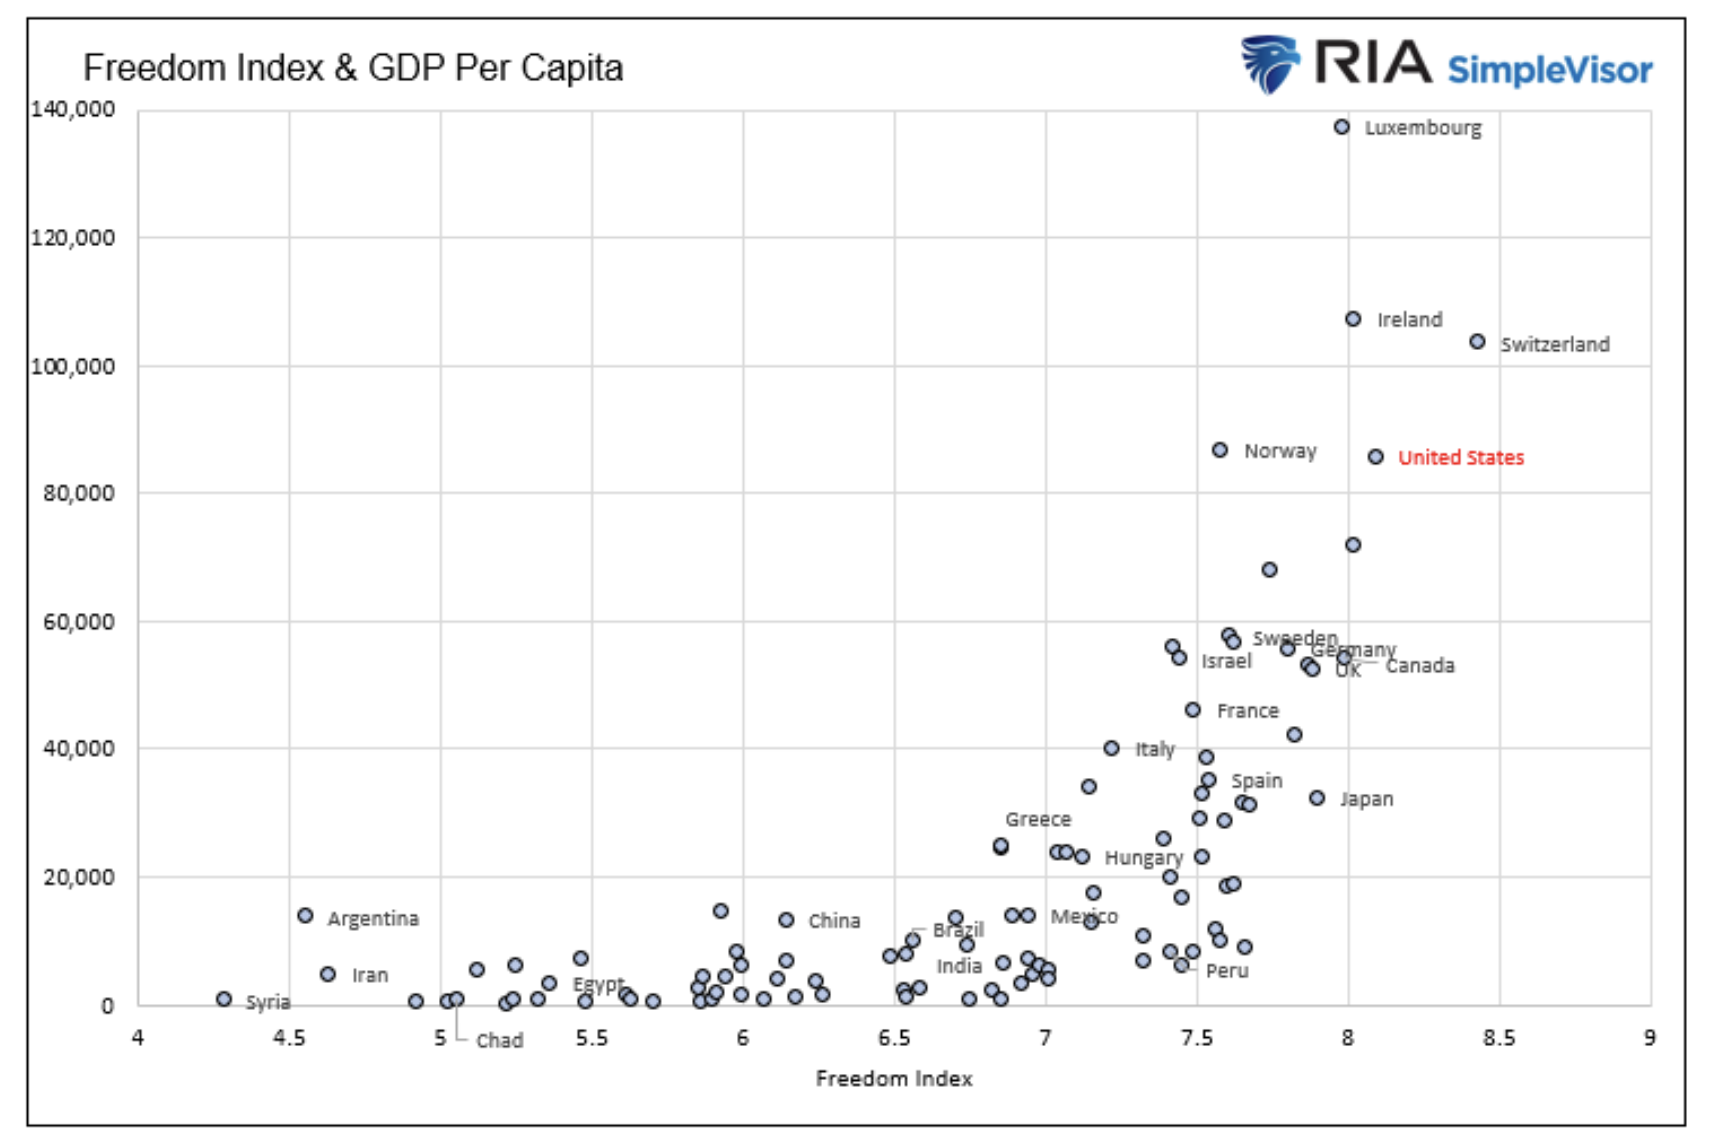
The graph below presents another opportunity to revisit how capitalism and the economic freedom it entails lead to prosperity.
The scatter plot below shows the intersection of The Fraser Institute’s Economic Freedom Index with per capita GDP for 102 of the largest economies. Before analyzing the graph and what it implies, let's gain a better understanding of its X-axis — the Economic Freedom Index.
The Freedom Index
All countries' economic and political policies, laws, and regulations exist on spectrums. In turn, where a country lies on these spectrums helps define its level of economic and political freedom.
- The economic spectrum spans from market-driven capitalism to centrally planned communism, with socialism positioned somewhere in between.
- The political spectrum ranges from libertarian to authoritarian.
Measuring a country's position on each spectrum is a very difficult task. Although not perfect, the Fraser Institute’s Economic Freedom Index is a highly regarded source for this measurement. Their index is based on five factors of economic and political freedom as listed below.
- Size of government
- Legal system and property rights
- Sound money
- Freedom to trade internationally
- Regulation
Underlying these five broad categories are 60 subcomponents. For example, tax rates are part of the size of government, while the legal enforcement of contracts is a part of the legal system and property rights.
With that, let's review a few graphs to see the relationship between the Economic Freedom Index and GDP, income, and income equality.
GDP & Income
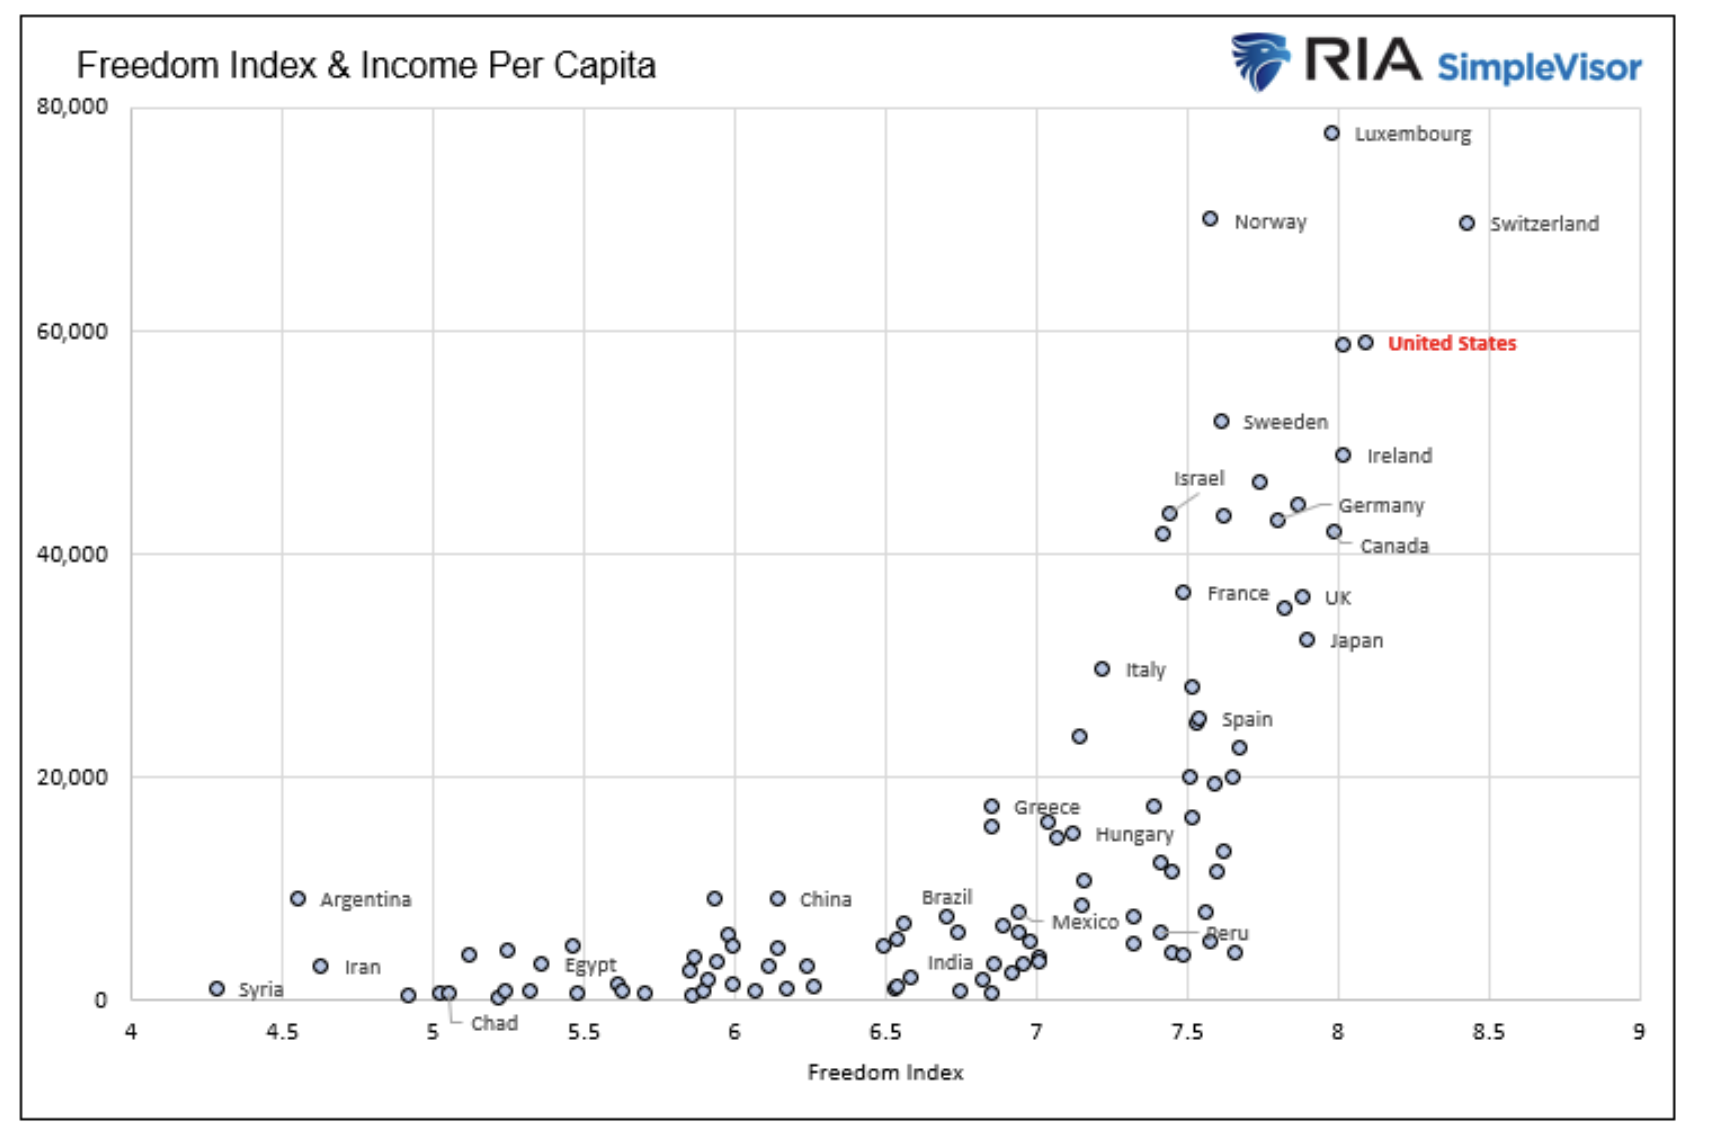
The first scatter plot below is the one we led with. It illustrates the relationship between each country's Freedom Index and its GDP per capita. The second, involving income per capita and the Freedom Index, provides a more precise measure of how citizens' wealth relates to economic freedom. Labeling every dot with the corresponding country name would clutter the graph. Accordingly, we only label a limited number of nations across the plot. The Freedom Index is calculated for 165 countries. However, our graphs below include only the 102 nations that also have reliable GDP and income data.
When the Freedom Index exceeds 7.0, a positive correlation exists between the Index, GDP, and income per capita. However, below 7.0, this relationship is absent. For example, in the income per capita graph, the R-squared value for points above 7.0 is statistically significant at 0.4731. In contrast, below 7.0, the R-squared drops to 0.1007, which is statistically insignificant.
We can’t explain why the economic advantages of economic freedom become apparent only once a country reaches a relatively high index score. However, the graphs confirm our beliefs: Countries with the most economic freedom tend to experience the greatest economic growth and have the highest incomes.
Interestingly, there isn't much difference between some European countries that lean toward more socialist policies and those considered capitalist, like the United States, Japan, and Switzerland. Could our perceptions or definitions of how countries' political and economic systems work be off?
Income Distribution
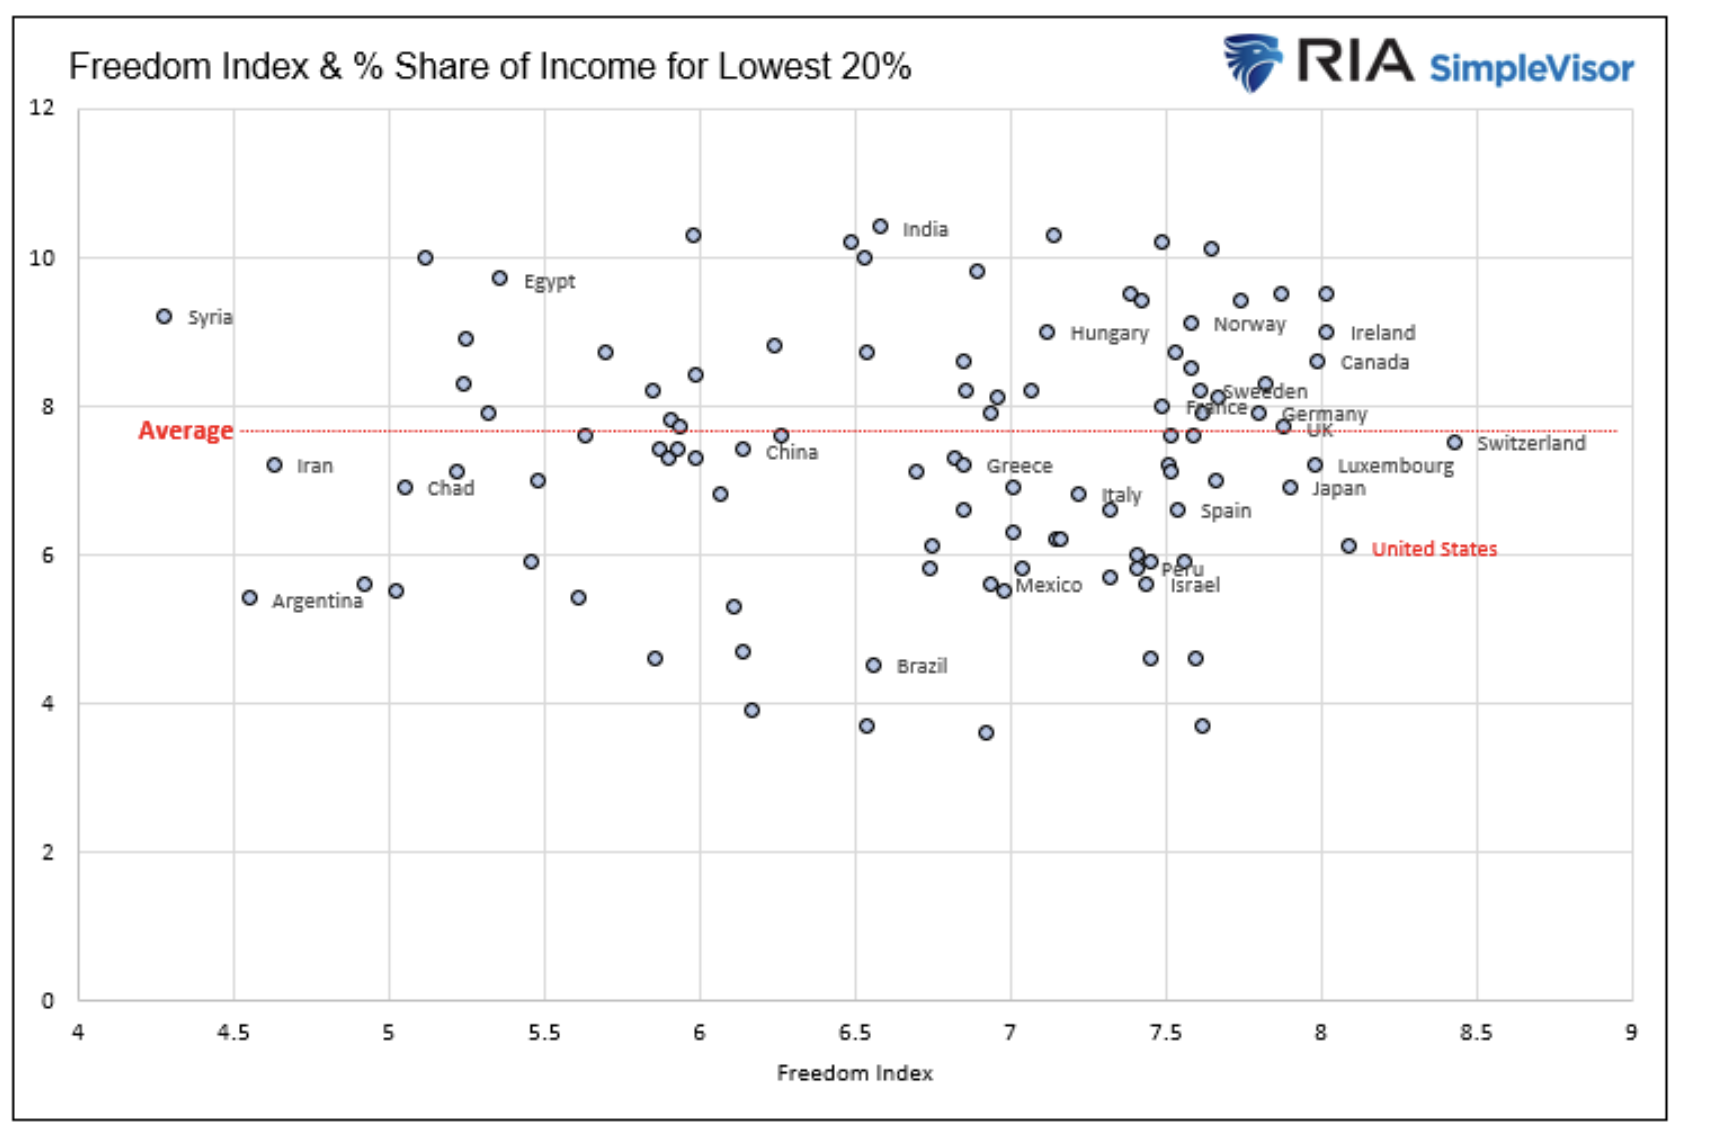
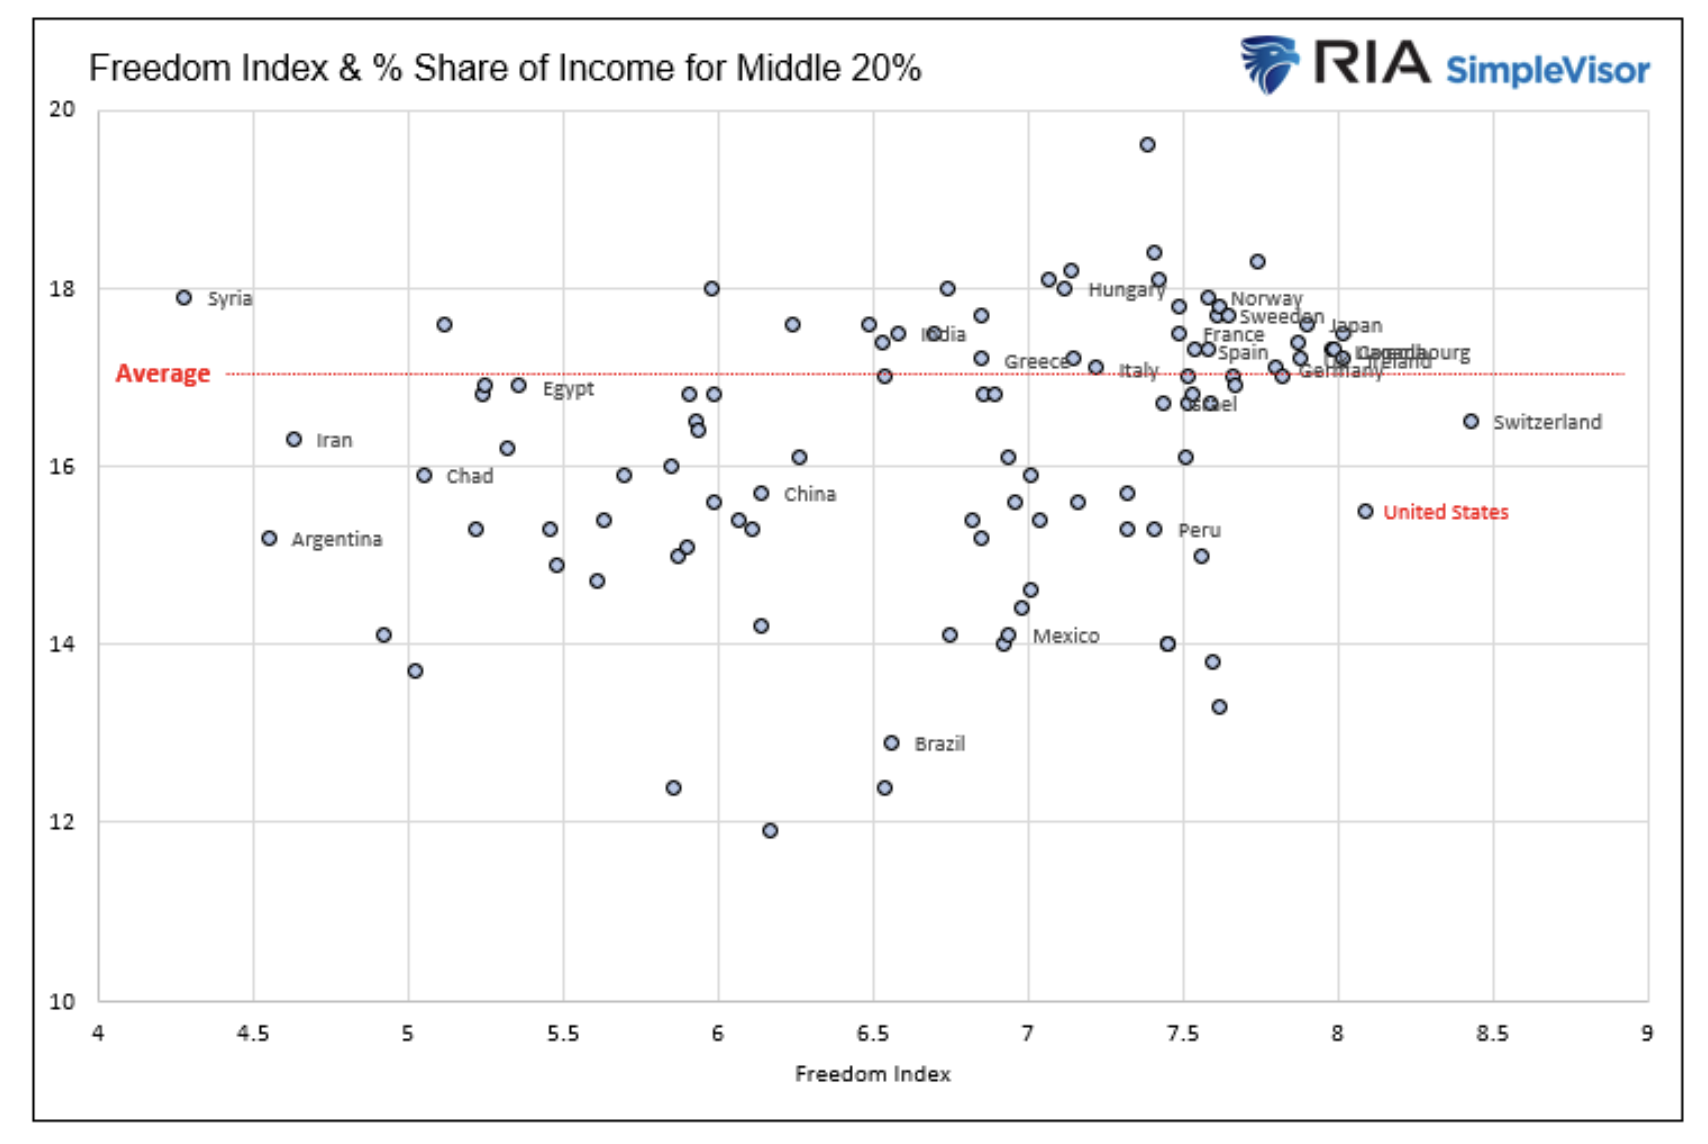
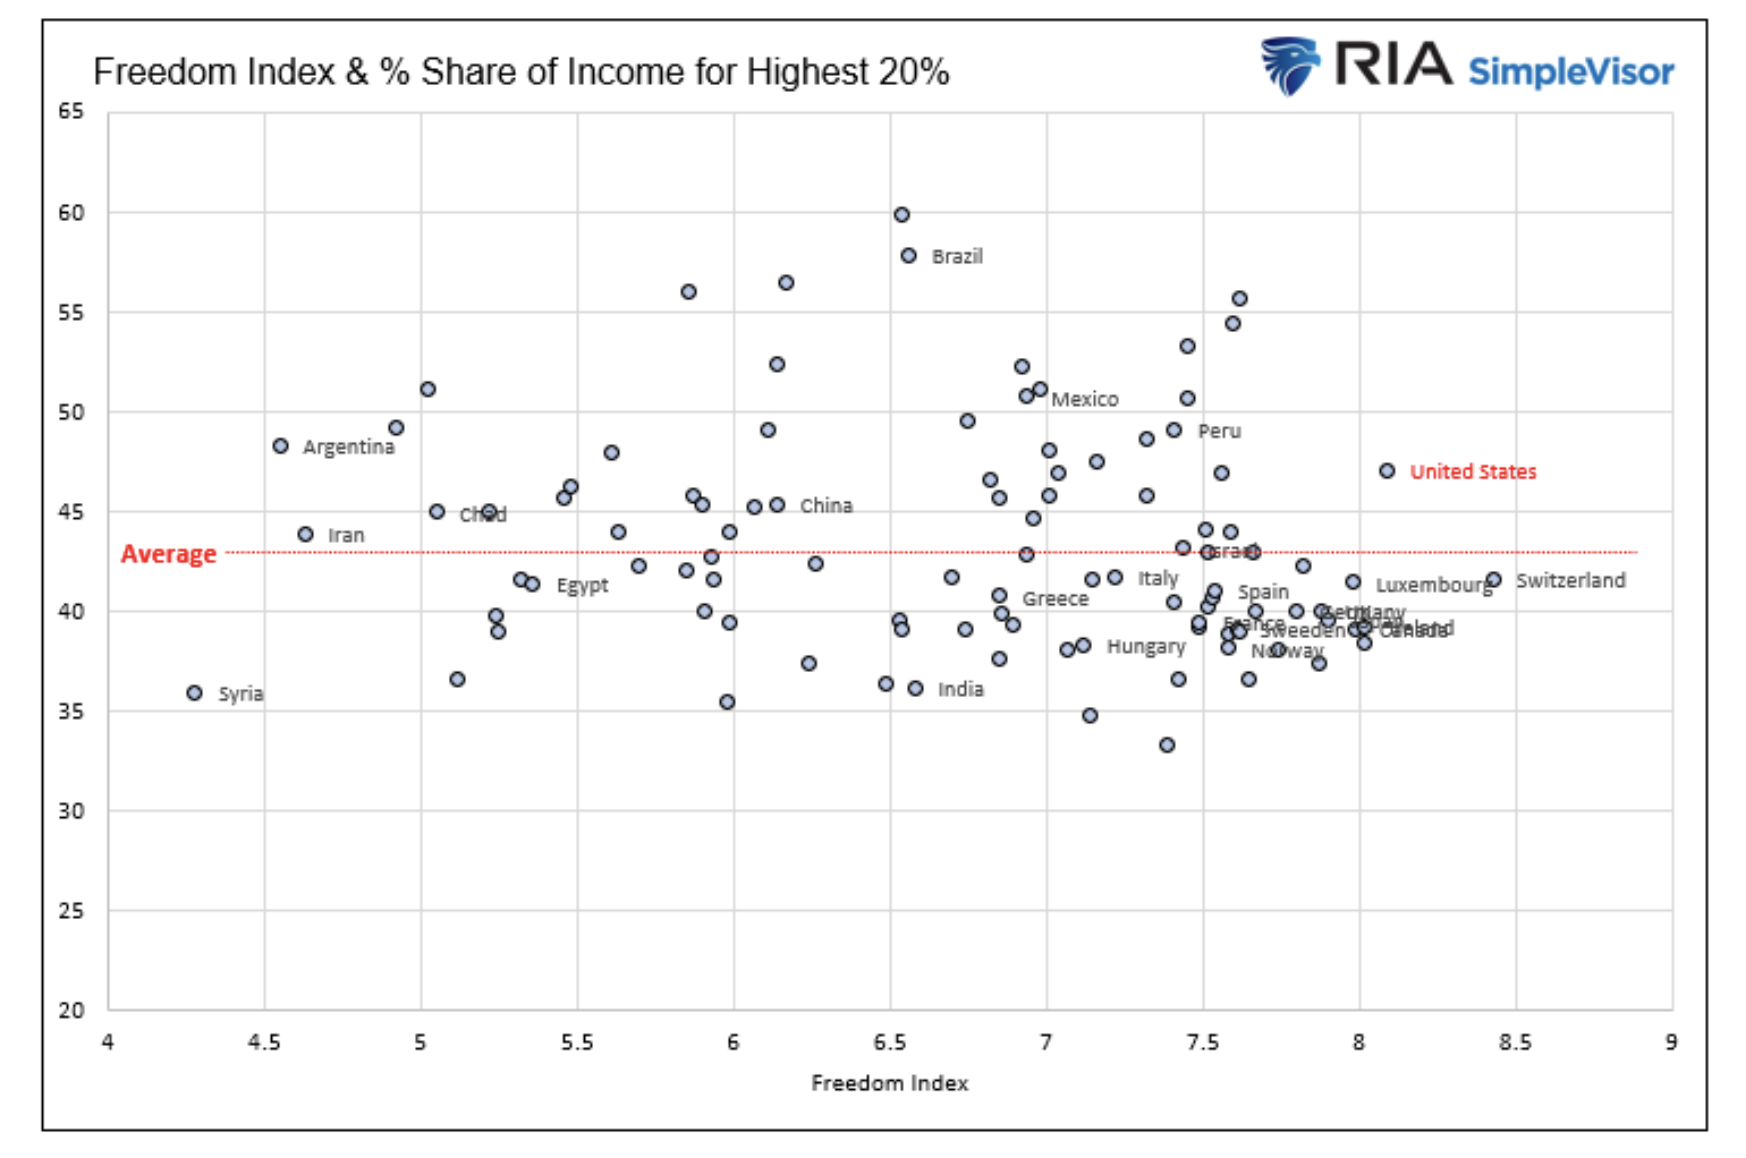
While wealth and GDP per capita are practical overall measures, they don’t reveal how wealth is distributed among citizens. The following set of graphs replaces income per capita with the shares of income held by the bottom 20%, the middle 20%, and the top 20% of society.
As all three graphs indicate, there appears to be no correlation between income distribution and the Freedom Index. But we can use the data to see how economies balance income distribution.
For instance, the wealth gap in the United States shows up in these graphs. The top 20% of income earners in the U.S. are above the average for countries with a Freedom Index of 7.0 or higher, while the middle and lowest groupings are below the average.
The “socialistic” European countries have a more even income distribution. In many of these nations, the top 20% of earners are below the average, the middle 20% are generally above the average, and the lowest are spread around the average.
Which Freedom Factors Matter Most?
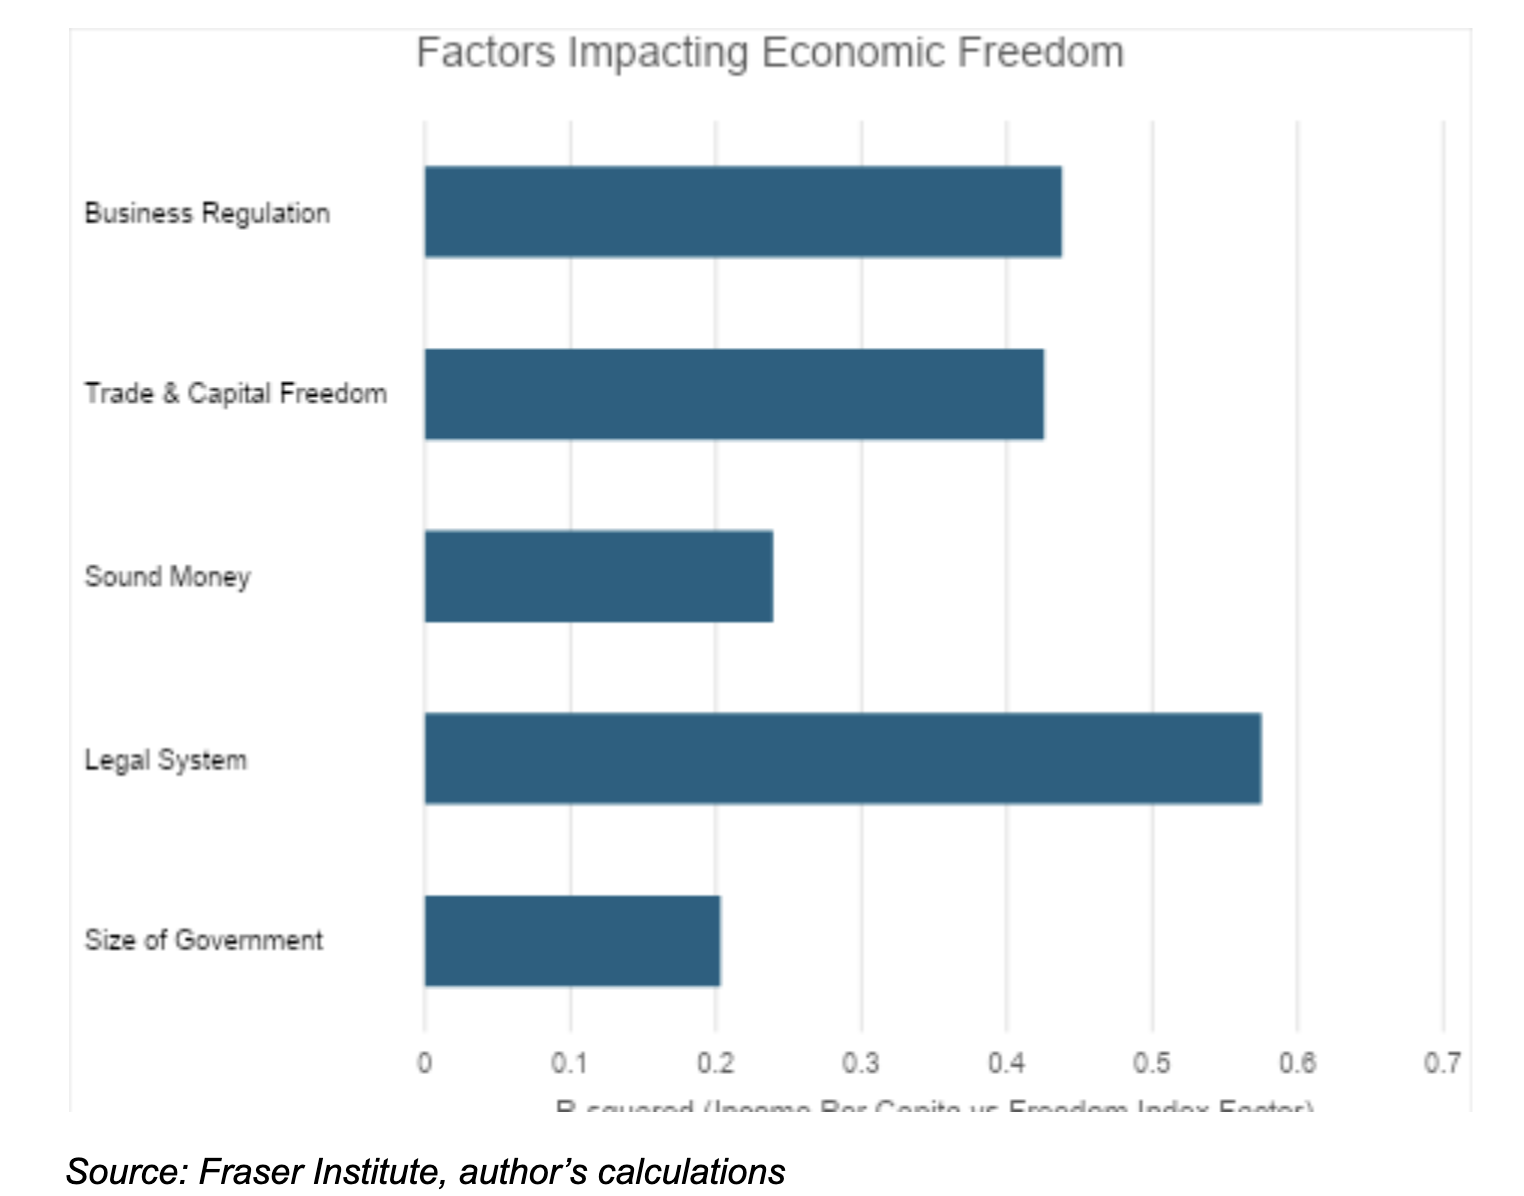
As we wrote earlier, the Economic Freedom Index is divided into five main categories, which comprise 60 subcomponents. To better quantify the importance of these factors, we calculated the R-squared values (statistical significance) for all of them in relation to per capita income.
The first graph below shows that a nation's legal system strength has the strongest link to wealth. Next is the level of business regulations and the freedom to trade and invest internationally. Sound money and government size have weaker correlations.
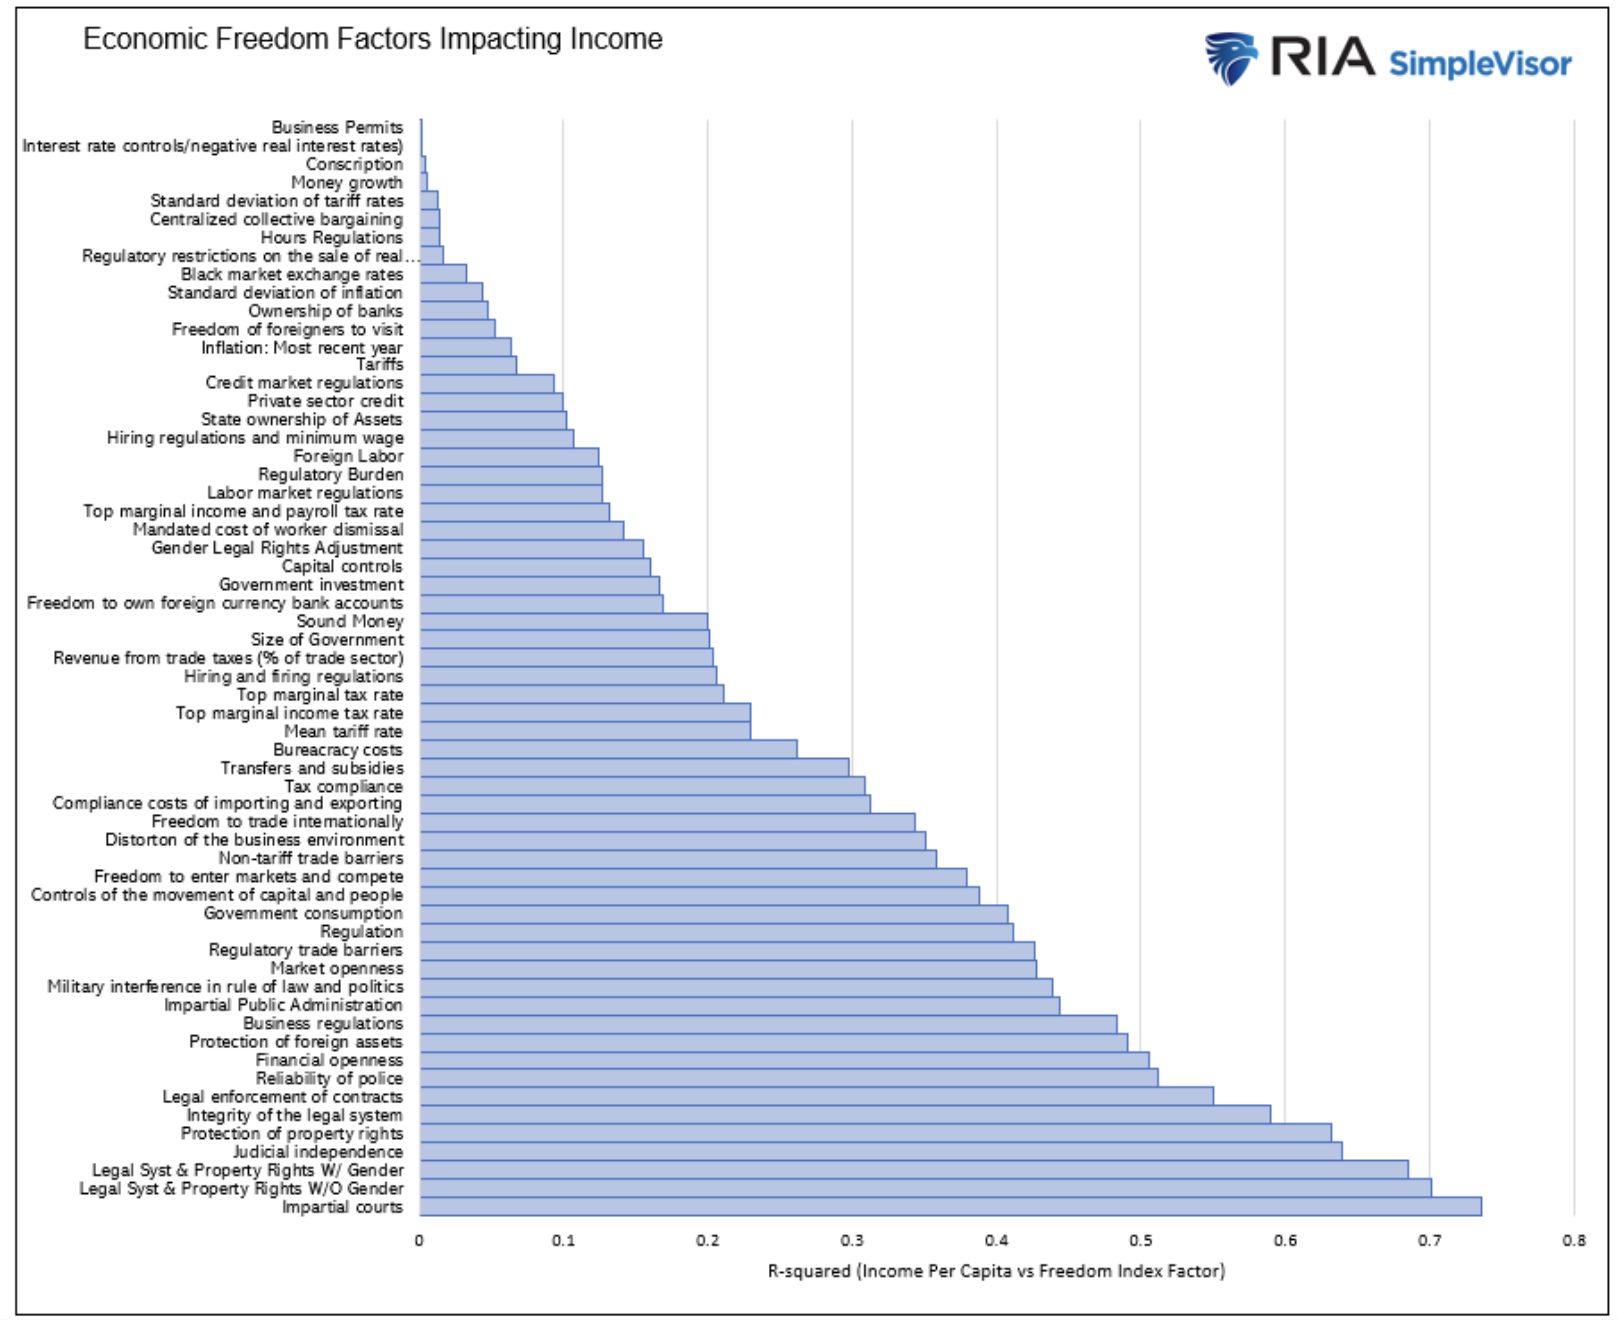
The subfactor with the most substantial impact on income is the impartiality of courts. Property rights and judicial independence follow. Among the least correlated to income per capita are those related to central bank policies, such as money growth and interest rate controls.
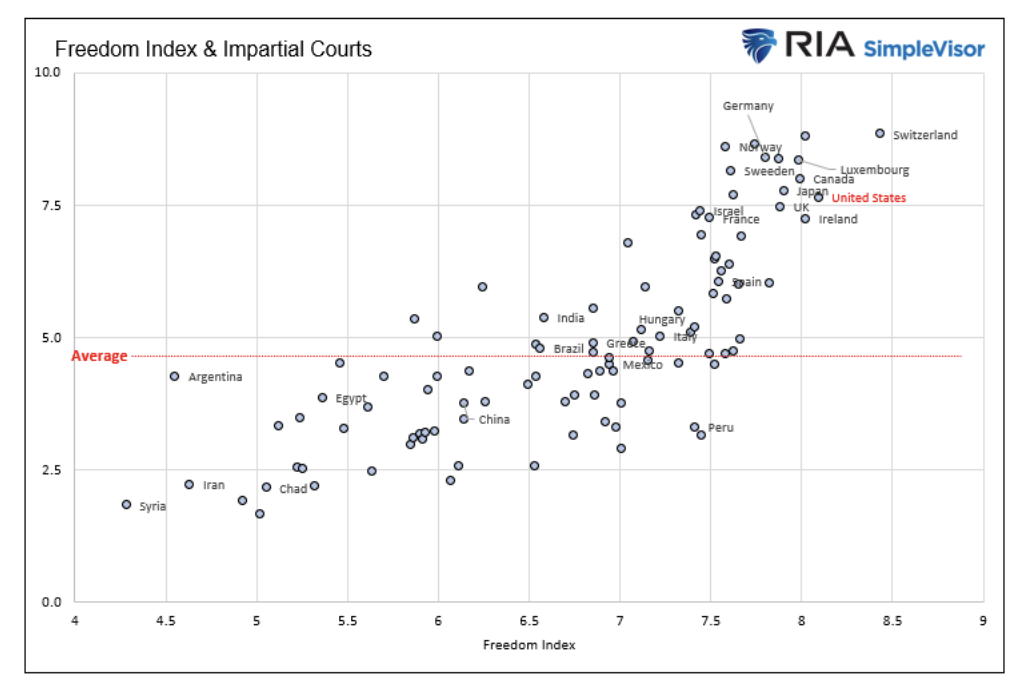
The graph below illustrates a strong correlation between the Freedom Index and its most significant relationship: impartial courts. Interestingly, the graph displays a consistent positive relationship between impartial courts and the Freedom Index across the entire range of the Index. As you may recall, our previous graphs show little correlation between the Freedom Index and income and GDP when the Freedom Index is below 7, and a positive correlation when it exceeds that level.
Global & U.S. Trends
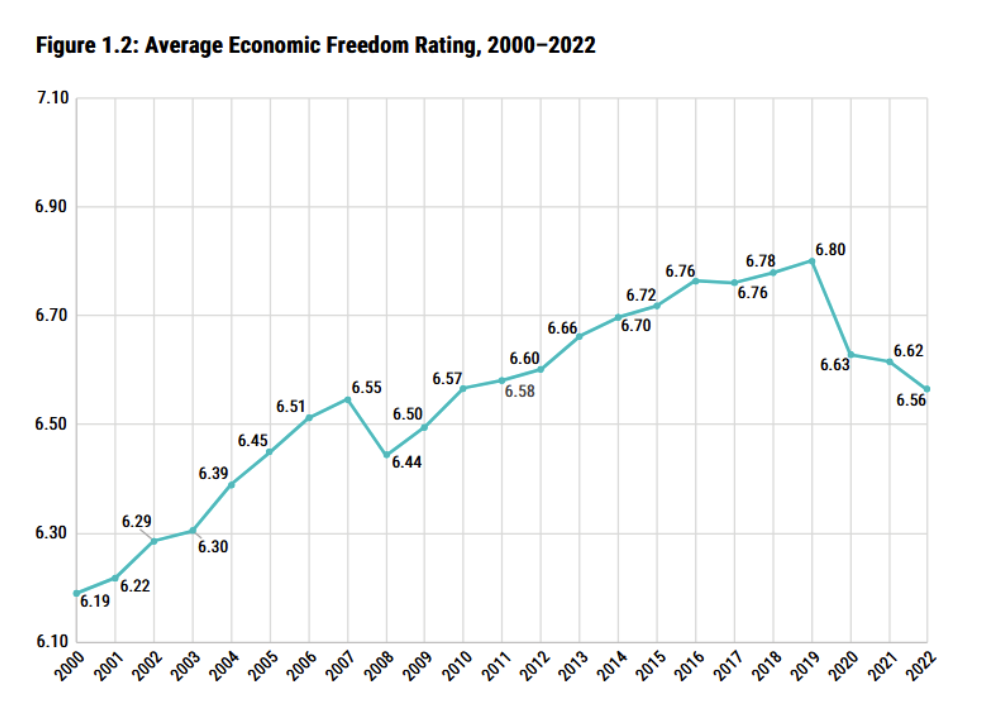
Unfortunately, as we share in the graphic below, courtesy of the Fraser Institute, the average economic freedom index for all nations has been declining since the pandemic. Based on the relationships we established earlier, if this trend continues, we should expect global GDP and incomes for most of the largest developed countries to grow at slower rates, or decline in some instances.
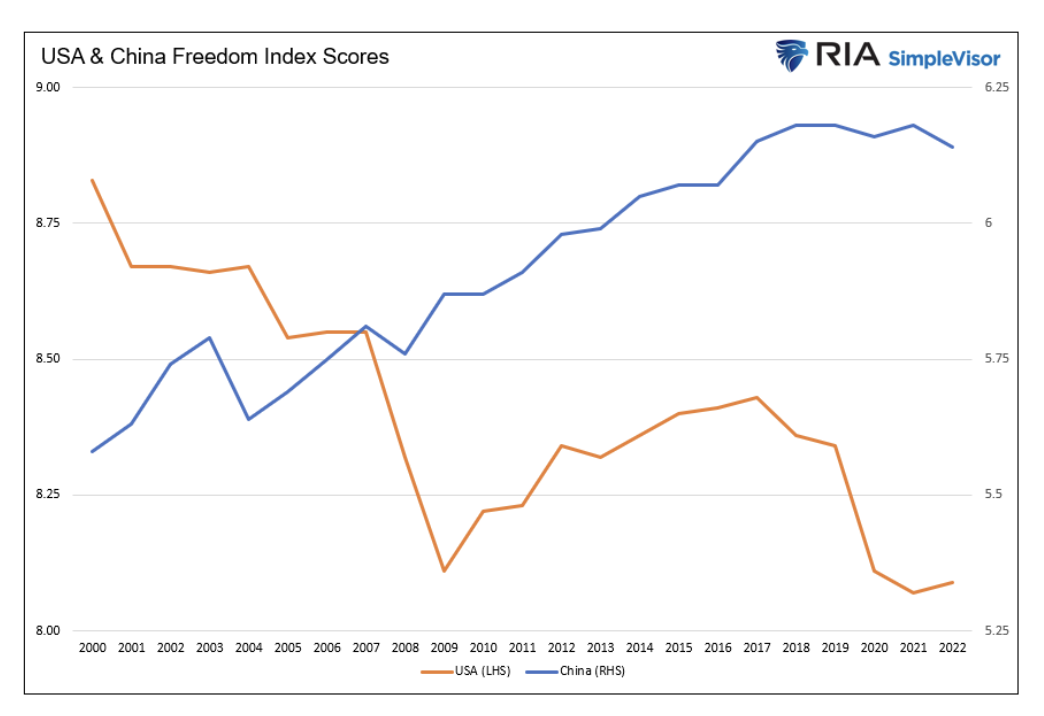
In 2000, the U.S. ranked 4th on the Freedom Index. Only Hong Kong (1st), Switzerland (2nd), and New Zealand (3rd) ranked higher. The U.S. remains highly ranked, at 5th, but as we detail below, its overall score has declined over the past 20 years. Singapore moved ahead of the U.S. and into the top five.
Meanwhile, China, which is slowly shifting from communism toward capitalism, has seen its Freedom Index score steadily improve. Note that the graph uses two y-axes — on its left and right sides — which can be a little misleading. The U.S. still has a much higher Freedom Index score than China.
Surprisingly, Hong Kong still has the highest Freedom Index score, despite China’s growing interference in its government's affairs.
Does Economic Freedom Also Promote Happiness?
Before we summarize this article, we would be negligent if we didn’t determine whether there is a relationship between happiness and economic freedom. The index we use to quantify happiness is from the World Happiness Report. The score is based on a single question as follows:
Please imagine a ladder, with steps numbered from 0 at the bottom to 10 at the top. The top of the ladder represents the best possible life for you, and the bottom of the ladder represents the worst possible life for you. On which step of the ladder would you say you personally feel you stand at this time?
The report then assigns a score to six variables to better understand which ones have the most significant impact on happiness. The variables are:
- Economic production
- Social support
- Life expectancy
- Freedom
- Absence of corruption
- Generosity
As the graph below illustrates, a strong correlation exists between economic freedom and happiness. Not only does economic freedom make a country more productive and wealthier, it can also boost the happiness of its citizens. Statistically speaking, capitalism seems to be a win/win situation.
Summary
No country operates entirely under a pure capitalist, socialist, or communist system. For instance, nominally communist nations like China and Russia are gradually allowing capitalism to enter their economies. Therefore, while we have ideas about where countries might fall on the economic and political spectrums, this data helps us better quantify the accuracy of said ideas. From an investing perspective, the trends in a nation’s index help us appreciate its future growth potential.
Connecting the dots, we found that a nation's court system and level of justice have the most significant impact on its Freedom Index, and therefore, by extension, on the wealth and happiness of its citizens.
Aristotle connected these ideas over 2000 years ago when he opined, “A just life is inherently a happy one.”
Michael Lebowitz is a portfolio manager with RIA Advisors and author for Real Investment Advice. For more information, contact him at [email protected] or 301.466.1204.
Join RIA Advisors and elevate your career within a deeply experienced team focused on innovation. Our collaborative environment is built on a foundation of advanced technology and effective investment models, designed to enhance your ability to serve clients and grow your practice. Benefit from a supportive culture that encourages professional development and fosters a forward-thinking approach. By joining our team, you’ll be part of a group dedicated to excellence and continuous improvement, empowering you to focus on building meaningful client relationships and pursuing your business ambitions. Discover the advantages of working with our accomplished advisory team by starting your conversation today.
A message from Advisor Perspectives and VettaFi: Thinking about starting your own RIA, making a move to a different firm, or specializing in a new area? Read our latest articles on financial advisor transitions.
Read more articles by Michael Lebowitz
 Advisor Perspectives welcomes guest contributions. The views presented here do not necessarily represent those of Advisor Perspectives.