Advisor Perspectives welcomes guest contributions. The views presented here do not necessarily represent those of Advisor Perspectives.
The S&P 500 is near all-time highs, leading some to question whether markets are in a bubble. A careful analysis of past bull markets suggests this is not the case.
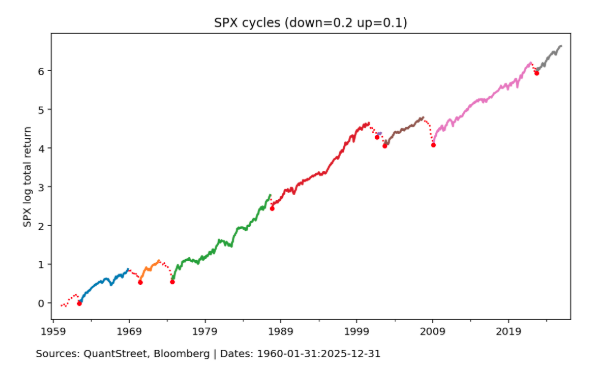
I define a market selloff as a peak-to-trough loss of at least 20% followed by at least a 10% recovery. The trough of each S&P 500 selloff since 1960 is marked with a red dot in the graph below, which shows the log return of the S&P 500 index since January of 1960. Each selloff is designated as a dashed red line. I refer to the time periods between selloffs — starting from the trough of the prior selloff and running until the market peak preceding the next selloff — as bull cycles. The eight post-1960 bull cycles are shown as colored, solid lines in the figure.
The most recent cycle began with the market trough of September 2022. Despite the significant consternation engendered by it, this recent bull market is neither anomalously long (when measured in months) nor anomalously large (when measured in percent return).
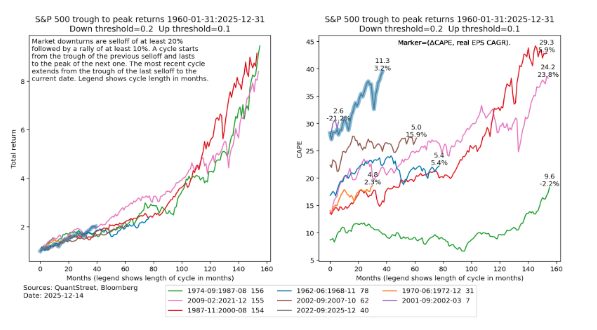
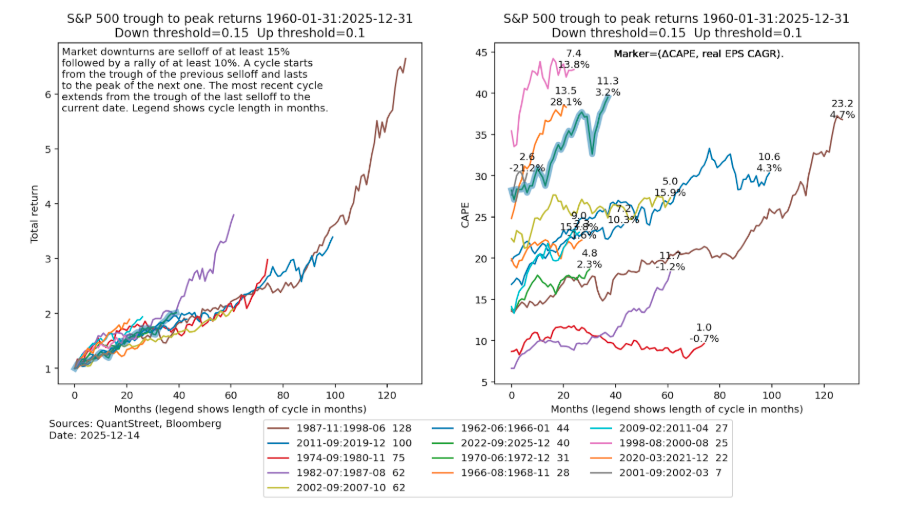
To get a better sense of the duration and magnitude of each bull cycle, the left panel of the graph below stacks all eight cycles on top of one another, each starting at a value of $1 invested in the S&P 500 index. The legend shows the dates of each bull cycle, starting with the longest one (measured in months) down to the shortest one; the colors are the same as in the graph above.
The current bull cycle (highlighted by the shaded blue line) has run for 40 months. Since 1960, only two bull cycles have been shorter (one lasted for only 7 months), while five have been longer. Of these longer cycles, the shortest one lasted 60 months, while the longest three lasted roughly 13 years. The duration of the current bull cycle is not anomalous.
Through the first 40 months, the current bull cycle has been the best performing one, though the difference in returns is not large. A $1 investment in the S&P 500 back in September of 2022 would have grown to roughly $2 now, pretty much exactly in line with the 2009-02:2021-12 bull market. A $1 investment in each of the previous 13-year bull markets ultimately grew to a value above $8. If history repeats — more on this below — there is more return left in the current bull cycle.
The Message From CAPE
As the right panel of the above chart shows, the cyclically adjusted price-to-earnings (CAPE) ratio has risen during this cycle (highlighted in blue) from a starting value in the high 20s to its current value of approximately 40 (an increase of 11.3 points). A rise in the CAPE ratio at the start of a bull cycle is not unusual, though the increase in the current cycle has been faster than typical. CAPE ratios rise because stock prices anticipate future, presumably higher earnings, whereas the “E” in CAPE is a reflection of the last 10 years of earnings (adjusted for inflation). What gives investors more pause, however, is the high level of CAPE in this bull cycle.
While the CAPE ratio has historically had an inverse relationship with future returns (higher CAPE, lower future returns), the measure has several well-known problems:
- CAPE has a long-term upward trend, partially due to the inability of historical accounting measures to properly reflect modern business practices (like marketing spend to acquire clients). I wrote about this about a year ago.
- The CAPE-to-future-return relationship is much flatter over the last several decades than it has been historically. Consequently, a higher CAPE ratio predicts less dire returns than it once did.
- The companies that make up past earnings of the S&P 500, i.e., what is reflected in the E of CAPE, are not the same as the current index constituents. Making this adjustment renders the current CAPE ratio less extreme.
- Related to the above, past earnings may not be a good proxy for future earnings. Based on the price-to-forward-earnings ratio, market valuations also look less extreme.
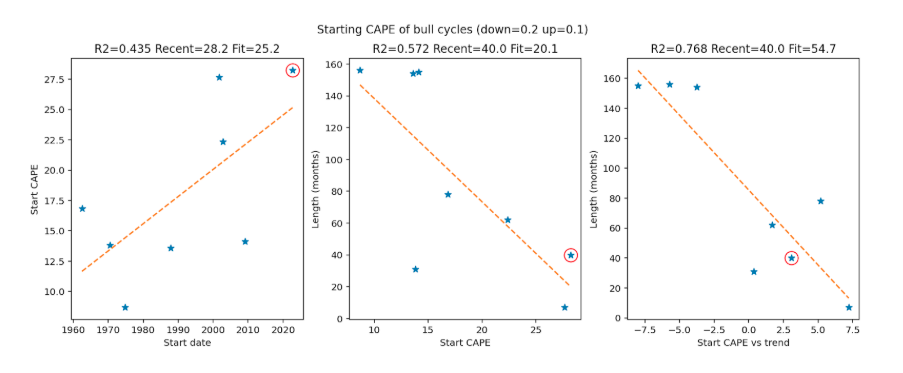
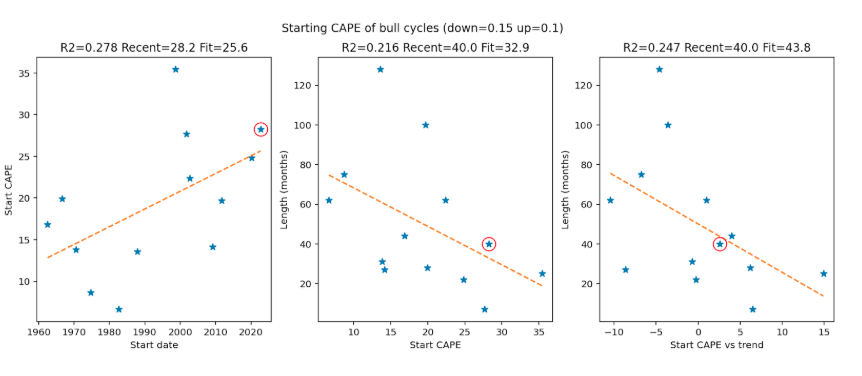
To get a better handle on the trend component of CAPE, the blue stars in the left panel of the graph above show the starting CAPE level of each of the eight bull cycles since 1960. The orange dashed line shows the time trend in these starting CAPE levels. It is clear that over the last 65 years, on average, successive bull cycles have started from progressively higher CAPE levels. This is consistent with the longer-term trend in CAPE I mentioned earlier. The CAPE ratio at the start of the most recent bull cycle is shown circled in red.
The middle panel of the above graph shows the relationship between the starting CAPE level of each cycle (x-axis) and the length in months of the subsequent bull run (y-axis). Again, the most recent starting level is circled in red. There is a clear inverse relationship between the starting CAPE level of each cycle and the cycle’s length. The right panel shows the same analysis, but rather than showing the cycle’s starting CAPE ratio on the x-axis, this plot shows the starting level of the CAPE ratio relative to its trend. Interestingly, the right panel provides a much closer fit to the data (a 76.8% R-squared versus the trend-unadjusted R-squared of 57.2%).
While the starting CAPE level in the current cycle is high, the current cycle’s starting CAPE value is only three points above its trend — a relatively small deviation. Based on the historical relationship between cycle length and the trend-adjusted starting CAPE ratio, the current cycle is projected to last 54.7 months. Despite all of its flaws as a forecasting variable, a simple trend adjustment to CAPE suggests the current bull cycle has a while yet to run.
Conclusion
It would certainly be preferable, from a historical perspective, if current market valuation ratios were lower. The high level of prices relative to past earnings clearly reflects investor expectations for high future earnings growth. The CAPE chart above showed both the change in the CAPE ratio in each bull cycle as well as the compounded annual growth rate (CAGR) of earnings (the “E” used in CAPE) over each cycle. Some cycles are characterized by mid-single-digit earnings growth, while others had earnings CAGRs in the double digits. Having double-digit earnings growth turns out to be crucial.
Assume the current CAPE ratio is 40, and we expect stocks to return 9% per year for the next 10 years. Since the dividend yield of the S&P 500 is 1.1% per year, this implies price appreciation of 7.9% per year. Say that the “E” in CAPE grows at 10% per year for the next 10 years (this would happen if every earnings number that falls out of CAPE is replaced with a new one which reflects a 10% CAGR over the ensuing 10 years). Under these assumptions, in 10 years the CAPE ratio will fall to 40 x 1.07910 / 1.110 = 33.
This is still a relatively high historical level, but better than 40. To put the 10% earnings growth assumption into context, according to FactSet, “[f]or CY 2026 analysts are projecting (year-over-year) earnings growth of 14.5%.”
My main point is that a continuation of the current bull cycle for the next several years would not be unprecedented (in fact, it would be quite typical), and with sufficient earnings growth, market valuations could well fall during that time.
As one caveat, I've argued in the past against the type of line-them-up analysis I am doing in this note (see the Nvidia and Enron piece from early 2024). But I feel this analysis may be more salient for individual macro series, like market-wide returns, than for single stocks (where there is less room to data mine).
Furthermore, as with any market forecast, please regard this one with a great deal of caution. Markets may do considerably worse than I estimate, and the historical relationships I rely on for this study may not hold in the future. Please consult a financial professional before making investment decisions and make sure your portfolio properly reflects your risk tolerance and liquidity needs.
Appendix
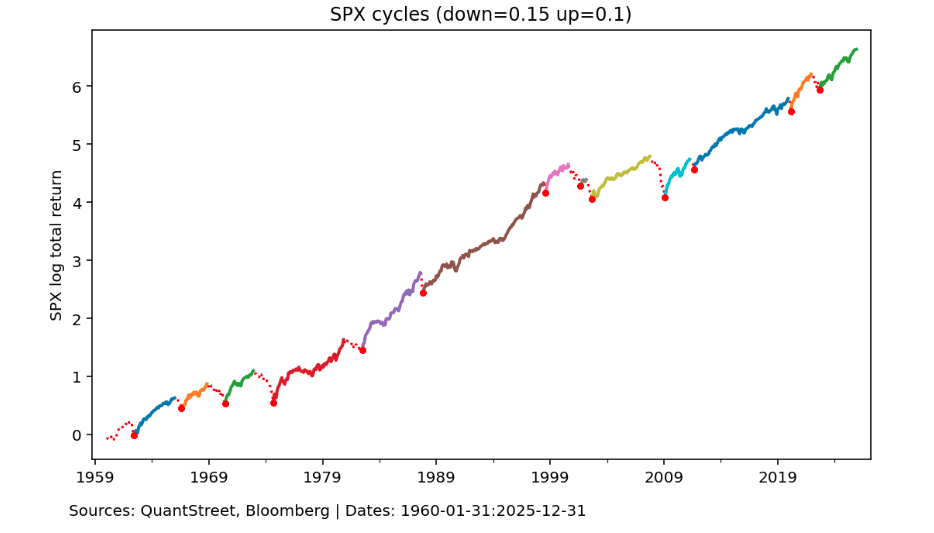
The next charts repeat this note’s analysis using a 15% threshold to define a market selloff. The qualitative features of the results remain.
Harry Mamaysky is a professor at Columbia Business School and a partner at QuantStreet Capital.
QuantStreet is a registered investment advisor. It offers wealth planning, separately managed accounts, model portfolios and portfolio analytics, as well as consulting services. The firm’s approach is systematic and data-driven, but also shaped by years of investing experience. To work with or learn more about QuantStreet, contact the firm at [email protected].
Read more articles by Harry Mamaysky
 Advisor Perspectives welcomes guest contributions. The views presented here do not necessarily represent those of Advisor Perspectives.