100 Year History Provides Perspective & Aids Preparedness
Membership required
Membership is now required to use this feature. To learn more:
View Membership Benefits Advisor Perspectives welcomes guest contributions. The views presented here do not necessarily represent those of Advisor Perspectives.
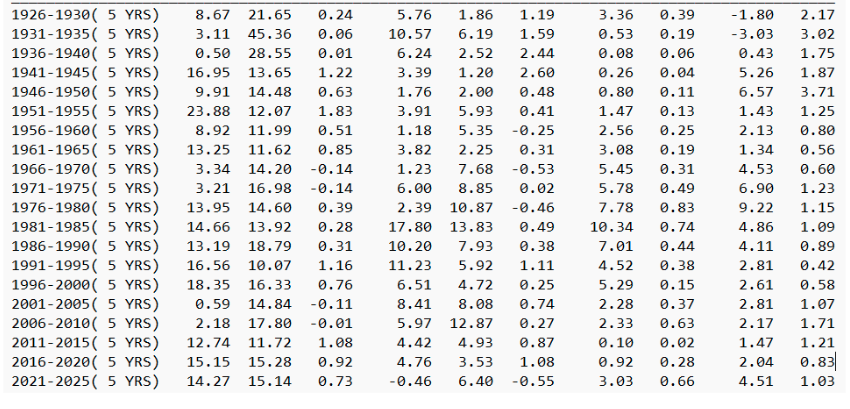
We’ve reached the 100-year milestone for our dataset that we began collecting in the 1970s. Below, we review key data from the prior century to gain perspective on that period and consider what it could mean for the future via the 20 charts that follow.
100 Years of Stocks, Bonds, Bills and Inflation
In the following graphs, stocks are represented by the S&P 500 Index and bonds by the Vanguard Total Bond Market ETF (BND).
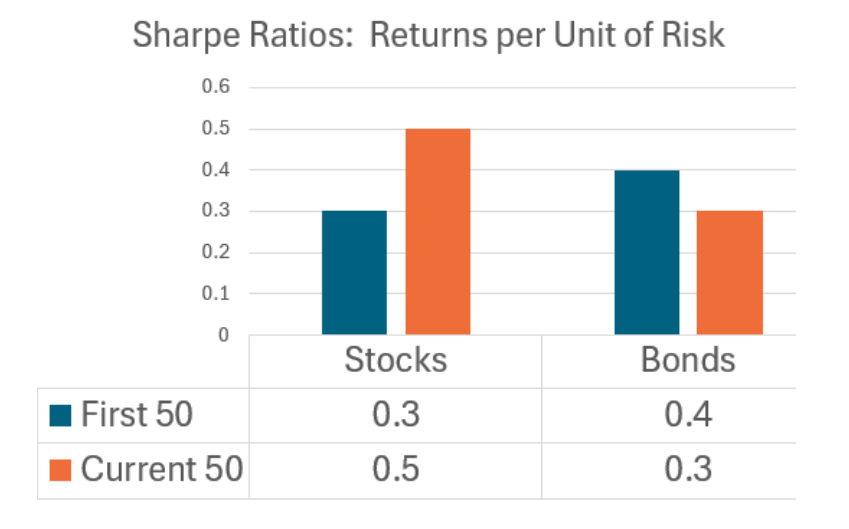
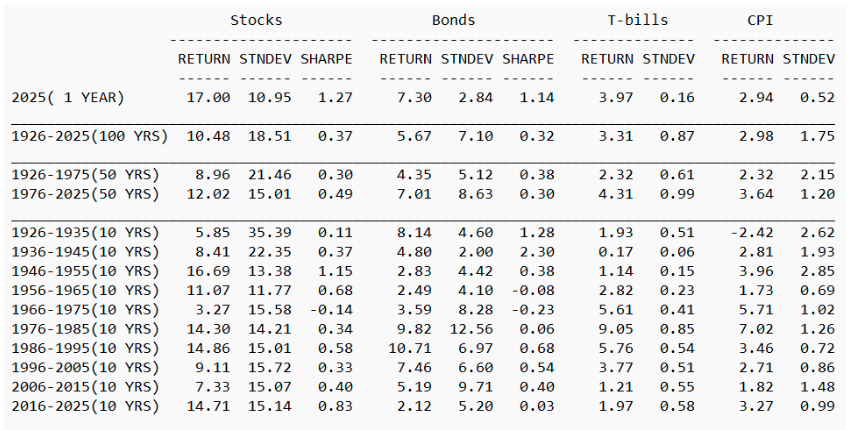
- The first 50 years (1926-1975) were less “efficient” than the most recent (1976-2025) for stocks, but the reverse is true for bonds. We measure efficiency as the Sharpe Ratio which is the return earned per unit of risk, a return-for-risk measure, in other words. Ask yourself why the recent stock market has been more generous, but the bond market has not (I don’t have an answer).
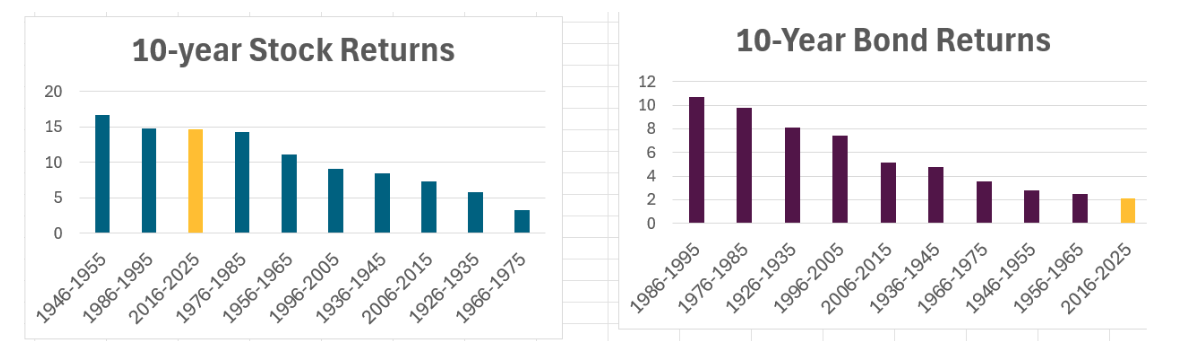
- This past decade had the third highest returns — of the 10 decades considered — for stocks but the lowest return for bonds.
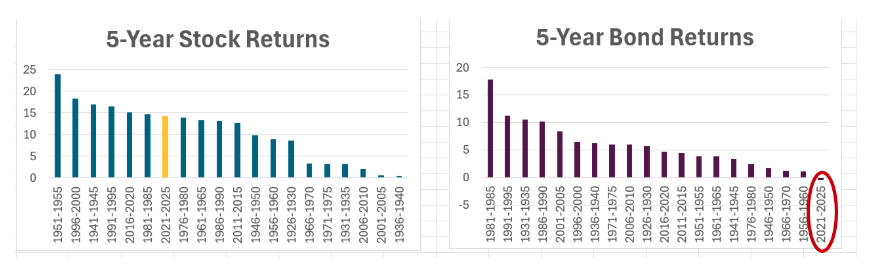
- For five-year periods, the past five years had the seventh highest return (out of all 20 consecutive five-year periods) for stocks and the lowest return for bonds which lost 0.46% per year. Bonds were not safe during this most recent period.
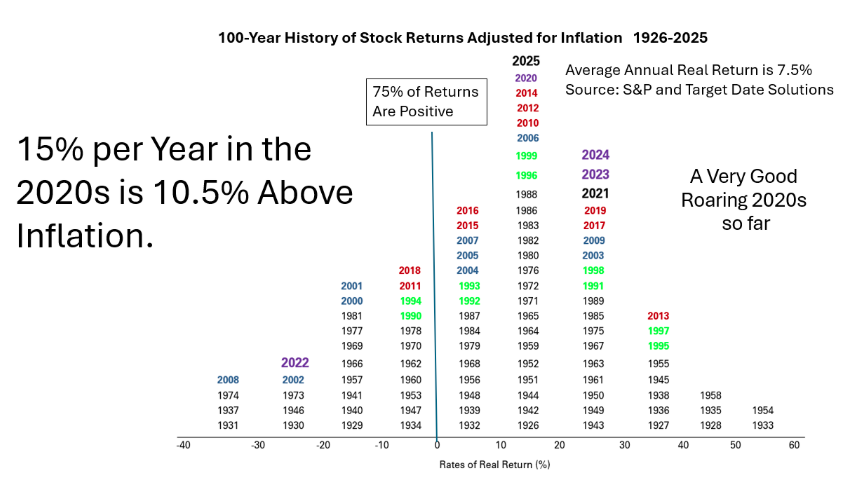
Distributions of Annual Stock and Bond Returns
The 2020s decade-to-date has been exceptionally good for stock investors, rewarding them with 15% per year returns, which is 10.5% above inflation. The average return above inflation over the century is 7.5%, so this decade has provided a 3%-per-year premium so far. It’s been incredibly good, prompting many to proclaim this decade to be the “New Roaring ‘20s.” However, we all know how the original Roaring ‘20s ended.
The past 17 years have represented the longest bull market ever, prompting concerns that the U.S. stock market is extremely expensive.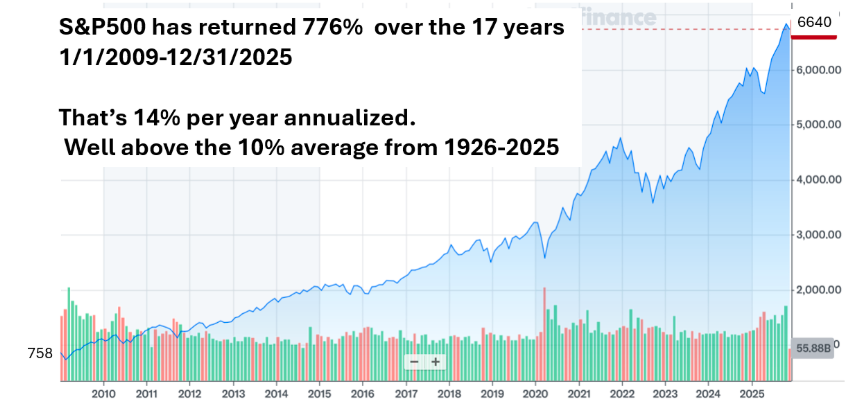
The Magnificent Seven are this year’s version of the Nifty 50. The graph below depicts their performance last year.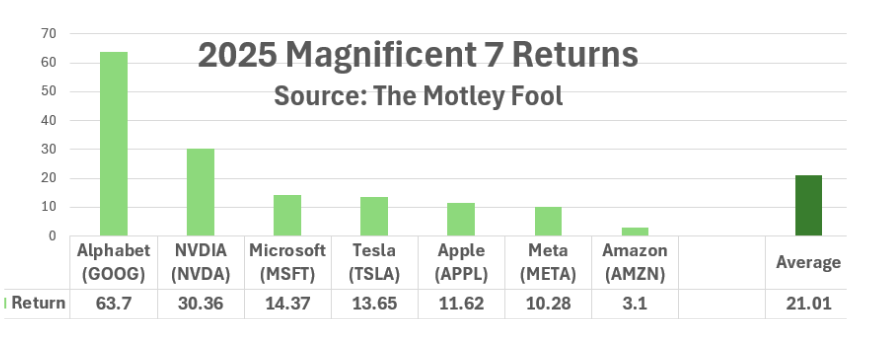
Although they have dominated U.S. market performance in recent years, their returns are not even close to those of the best-performing companies. Artificial intelligence has been the market’s driving force recently, especially data storage companies. According to the Motley Fool, the following are the five best-performing stocks in 2025:
- SanDisk (SNDK), up 590%. The clear standout, this flash memory specialist (spun off from Western Digital in February 2025) rode the AI-driven NAND flash boom to become the top performer. NAND is a contraction of “NOT AND” which refers to both fundamental digital logic gates and a type of non-volatile flash memory, both crucial in electronics.
- Western Digital (WDC), up ~290%. Focused on hard drives and storage, it benefited from the same AI tailwinds and its successful SanDisk spin-off.
- Micron Technology (MU), up ~230%. A leader in DRAM (digital random-access memory) and NAND storage for data centers, Micron capitalized on high-performance memory demand for AI applications.
- Seagate Technology (STX), up ~225%. Another data storage player specializing in hard drives and enterprise solutions, boosted by the industrywide surge.
- Robinhood Markets (HOOD), up ~225%. The outlier in the group — a retail trading platform that gained from renewed stock market enthusiasm, crypto trading volume, and broader retail investor participation.
In contrast to the soaring stock market, bond returns have been disappointing so far in this decade. A loss of more than 20% in 2022 was the worst annual bond loss ever. And another two years — 2021 and 2024 — saw real (inflation-adjusted) losses. Only three years (out of six) were “normal” and positive.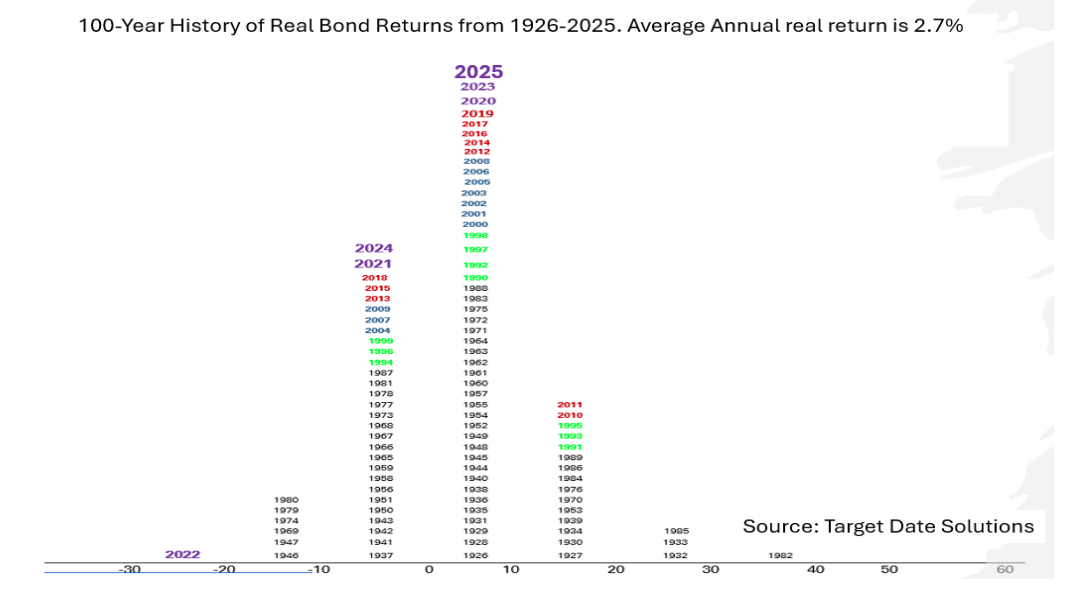
Asset Class Performance in the Current Decade
U.S. stocks dominated asset class performance during the decade of the 2020s prior to 2025, but that changed this year, with gold and foreign stocks taking the lead.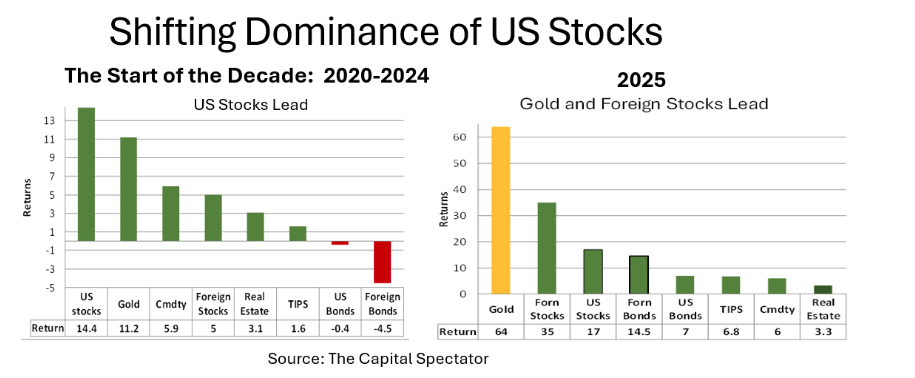
Gold’s outsized 64% return during the year is eye-catching, to be sure.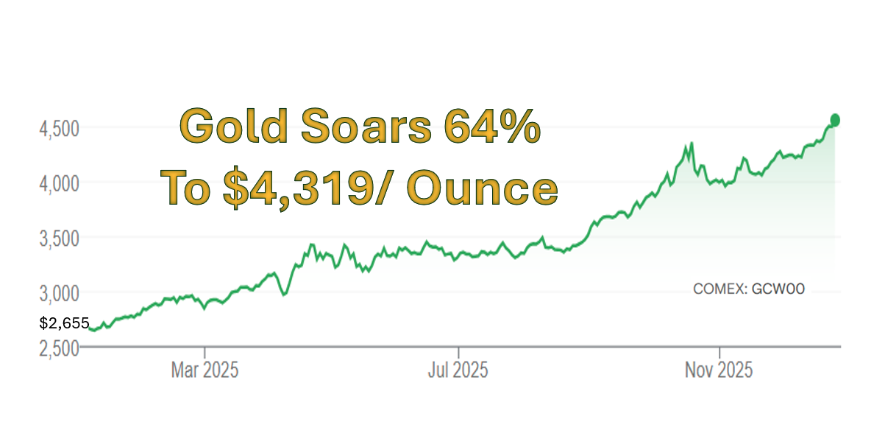
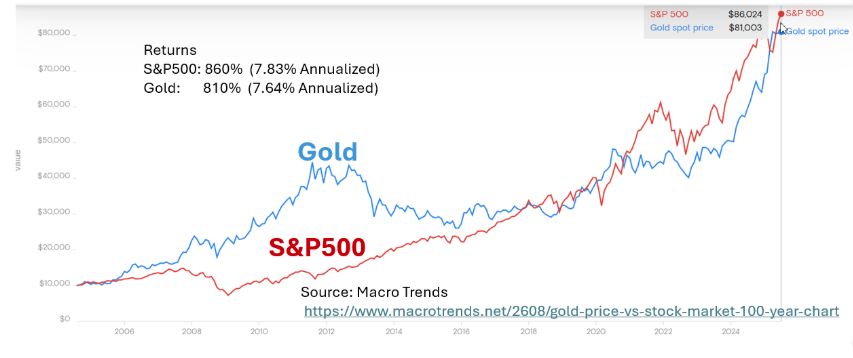
Although Warren Buffett advises against holding gold because it produces nothing, the metal has recently held its own against stocks, as shown below:
“Money” is a store of value and a means of exchange. However, many consider gold to be better than money because it doesn’t lie, and it doesn’t get revised by government bureaucrats. It doesn’t depend on congressional budget committees or Federal Reserve projections.
Gold meets the store of value definition of money, and efforts are underway to make gold an efficient means of exchange. For example, consumers can access a gold-backed credit card (Glint) and debit card (VeraCash Mastercard). Both hold their gold in Swiss vaults. As such, they offer a way to own and spend gold.
As for Buffett’s guidance, gold is more than just a glittery unproductive metal. It is used for jewelry, technology, central bank reserves and investing. Investing is the primary usage of gold, but the World Gold Council reports that investing is only 43% of the demand for gold, as shown in the graphic below. The Council also reports that the recent surge in gold price was generated primarily through the increase in purchases of gold-backed ETFs, up 134% year-over-year for the third quarter.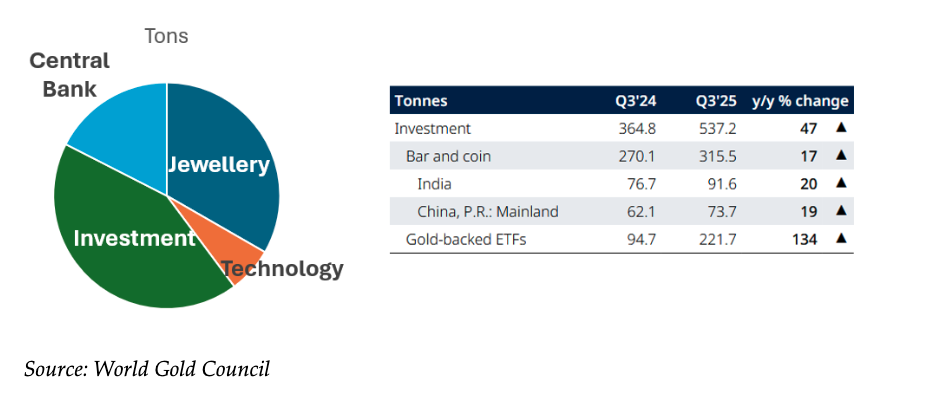
As for the relative reversal of U.S. stock performance versus the rest of the world, history tells us that expensive stock markets do not stay expensive. In the past, when P/Es have reached 30, the subsequent 10-year return has averaged an annualized loss of 5%, as shown below.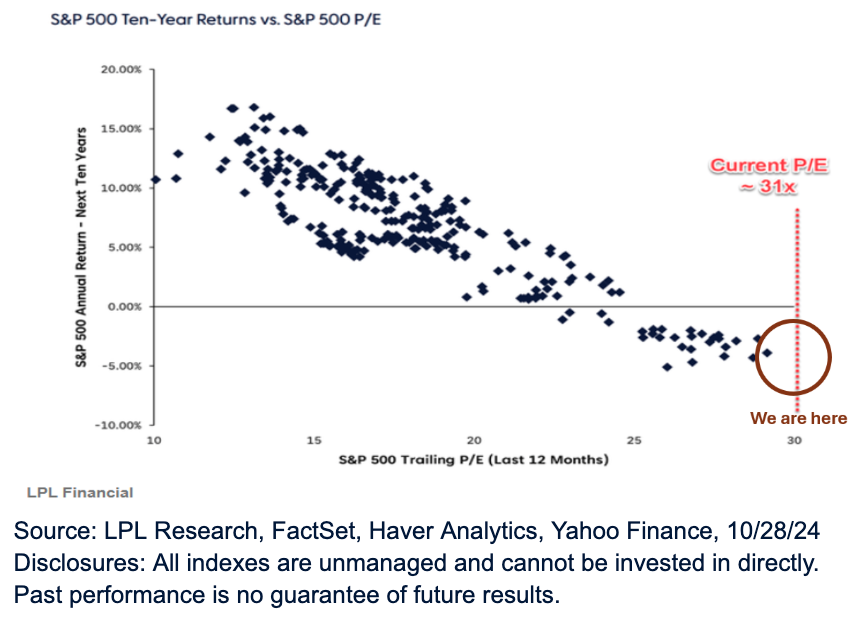
The rise of AI stocks has suppressed this decline so far, while exacerbating expensiveness. This is reminiscent of the Nifty 50 in the 1960s, when “the trend was your friend.” But investor concerns about the expensive nature of the U.S. stock market are driving them toward relatively less expensive foreign stock markets, that generated a 35% return this year.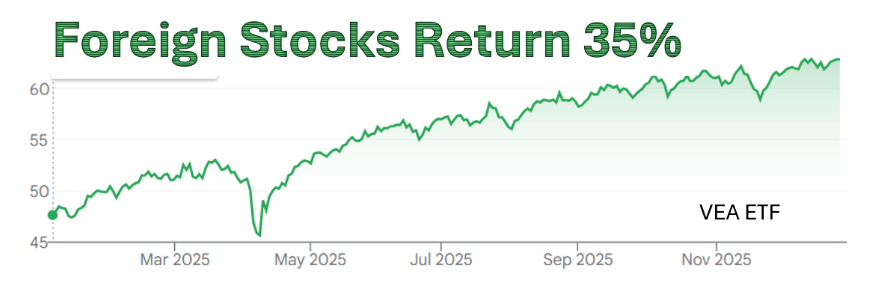
Below are the countries that delivered better performance than the U.S. this year based on their ETFs. 2025 was an exceptionally good year for most stocks around the world.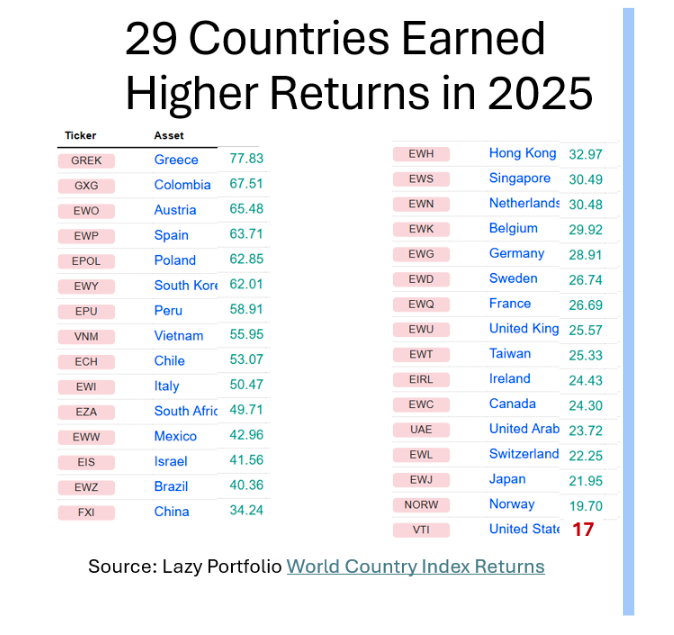
The Venezuelan Lesson
Investors could be forgiven for seeing parallels to the Venezuelan markets in 2016. Venezuela’s stock market exhibited the best performance in the world, up 114% versus 13% for the Dow Jones Industrial Average. This event has direct application to the recent performance of stock markets around the world and the price of gold. A Merion West article by Henri Matilla, written after the Venezuelan market followed 2016 with two more years of returns that could only be described as preposterously high, notes the following:
The curious case of the Venezuelan public equities market is a prime example of why it can be misleading to use stock markets as indicators of economic performance. Most economists agree that Venezuela’s economy is in turmoil, and that there is no end in sight. The real reason behind the market’s astronomical rise has little to do with ebullient investor sentiment but instead is one of the symptoms of the government’s inflationary monetary policy. In short, owners of the country’s currency protected themselves from the currency’s severe devaluation by exchanging their bolivars for seemingly safer assets, including stocks. With huge volumes of money pouring in, the stock market was artificially inflated.
Off to See the Wizard
Warren Buffett is not following the herds into gold and foreign stocks. He is moving to the safety of cash instead. Is the Wizard of Omaha outsmarting the world, again? His advice is to be greedy when others are fearful and fearful when others are greedy. Fear of missing out (FOMO) is not fear – it’s greed. Here’s a Modern Portfolio Theory (MPT) contrast of Buffett versus the world. Which strategy do you prefer — more risk or less?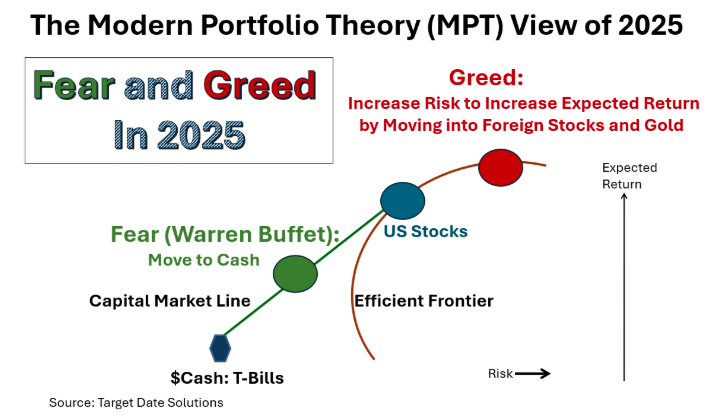
Cash (Treasury Bills) is an inflation hedge as well as a hedge against falling stock prices, and it’s less complicated and risky than gold and foreign stocks. Einstein advised that all should be made as simple as possible, but no simpler. The move to higher risk was rewarded in 2025. Now what?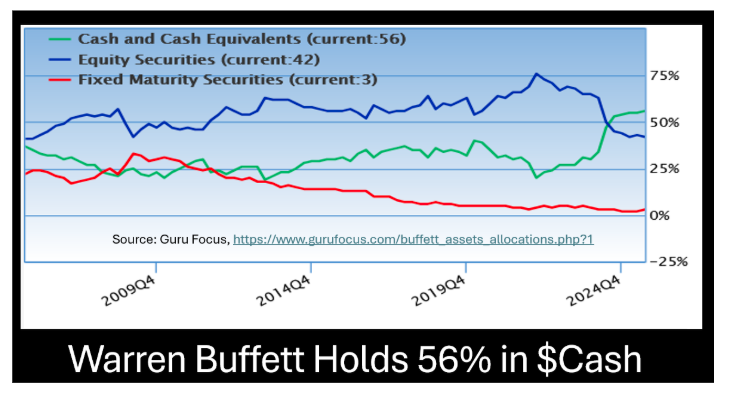
Diversification Is Working, Again
In recent memory, diversification outside the U.S. stock market did not “work” to improve returns, but this year is different, as seen in the performance of target date funds.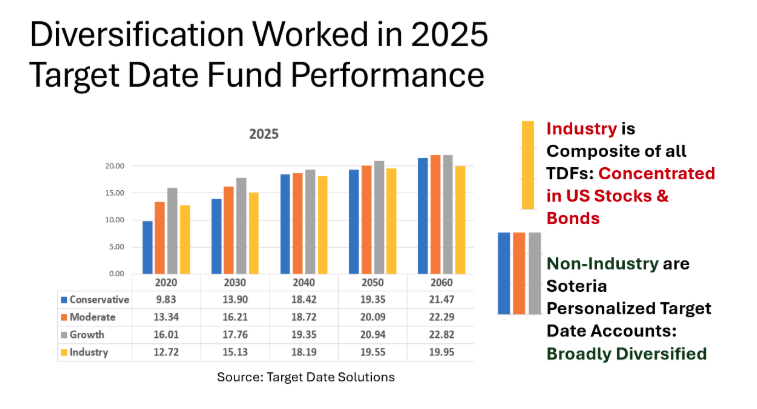
Conclusion
Buddha said, “Impermanence is eternal.” In other words, things change — constantly. That is certainly true of capital markets. Artificial intelligence is the current new wave that is driving the stock market to new highs, but Stein’s Law cannot be denied: If something cannot last forever, it will end. Some think the next stock market crash will be among the worst. Booms like AI are great fun, but investors should be cautious of euphoria.
We all certainly hope that the next crash is not that bad, but it’s important to know that 75 million baby boomers are currently in the Retirement Risk Zone, where losses can ruin the rest of one’s life from a financial perspective. Baby boomers should protect themselves, because a retirement with dignity is at stake.
Despite beliefs to the contrary, the most popular qualified default investment alternatives (QDIAs) in 401(k) plans, namely target date funds, are poised to seriously disappoint those near retirement when the stock market crashes. Learn why, and what you can do, in this five-minute video. Baby boomers beware. You youngsters can worry too, especially if you’re a baby boomer heir.
Ron Surz is president of Target Date Solutions, developer of the patented Safe Landing Glide Path and Soteria personalized target date accounts. He is also co-host of the Baby Boomer Investing Show. Surz’s passion is helping his fellow baby boomers at this critical time in their lives when they are relying on their lifetime savings to support a retirement with dignity, so he wrote a book, “Baby Boomer Investing in the Perilous 2020s,” and he provides a financial educational curriculum.
For anyone who relies on TDFs — or advises those who do — Surz’s new book is a must-read guide to understanding the risks, solutions, and future of a secure retirement.
A message from Advisor Perspectives and VettaFi: Discover something new! Click here to register for our upcoming webcasts.
Membership required
Membership is now required to use this feature. To learn more:
View Membership BenefitsSponsored Content
Upcoming Virtual Events View All


