The Dollar
Membership required
Membership is now required to use this feature. To learn more:
View Membership Benefits Advisor Perspectives welcomes guest contributions. The views presented here do not necessarily represent those of Advisor Perspectives.
Dollar positives include relatively high U.S. interest rates and robust growth. But dollar negatives are building. The political will for a stronger dollar isn't there and valuations aren't helping.
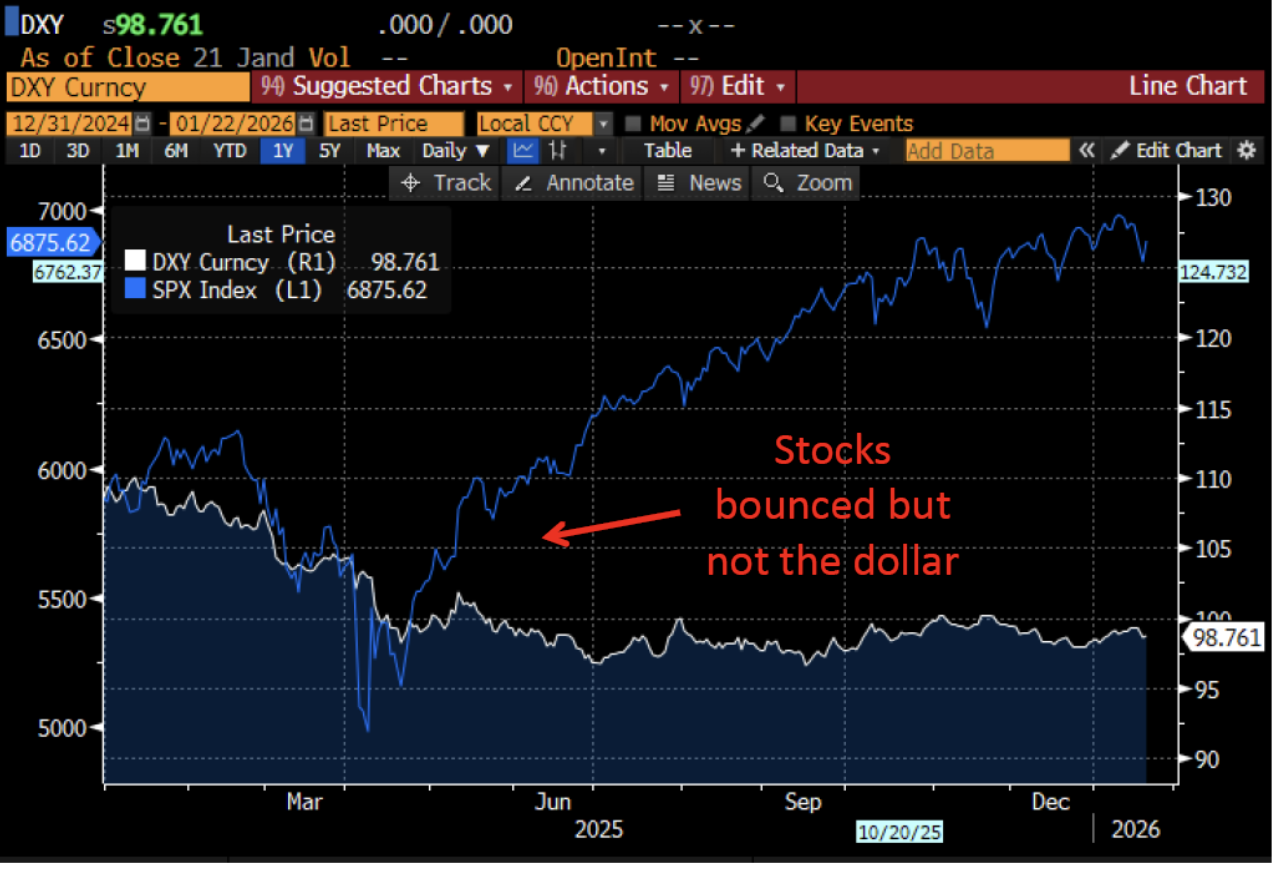
Since QuantStreet launched in December 2021, we’ve maintained a bullish view on both U.S. assets and the dollar. The former remains true; we are believers in the AI revolution and don’t buy the AI bubble argument. But the latter is starting to change. Based on the behavior of the U.S. stock market and the dollar after last year’s tariff sell-off, this shift toward a weaker dollar seems to be the new consensus.
Let’s first take a look at the dollar positives.
Positives
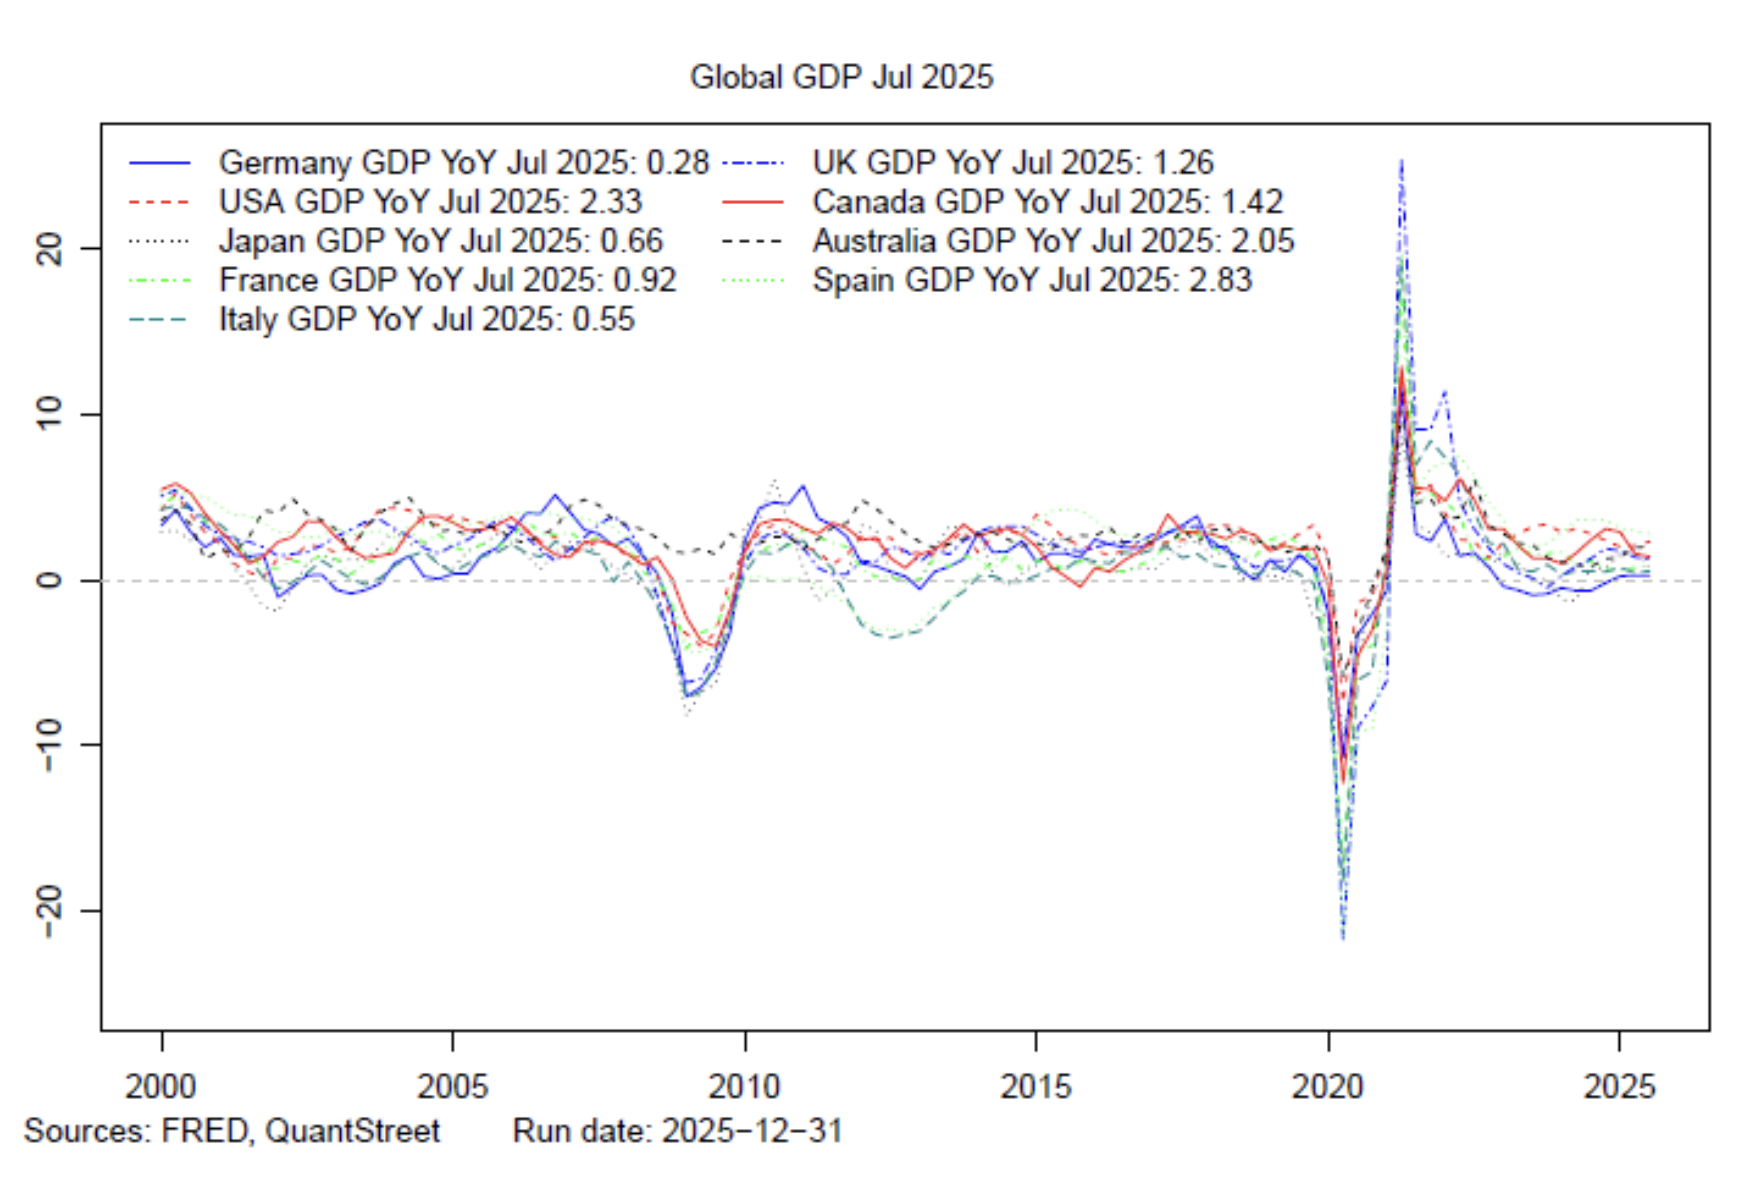
First, U.S. growth exceeds that of the rest of the world. This raises U.S. interest rates and attracts global capital, both of which are dollar positive.
Second, U.S. rates are high relative to other countries.
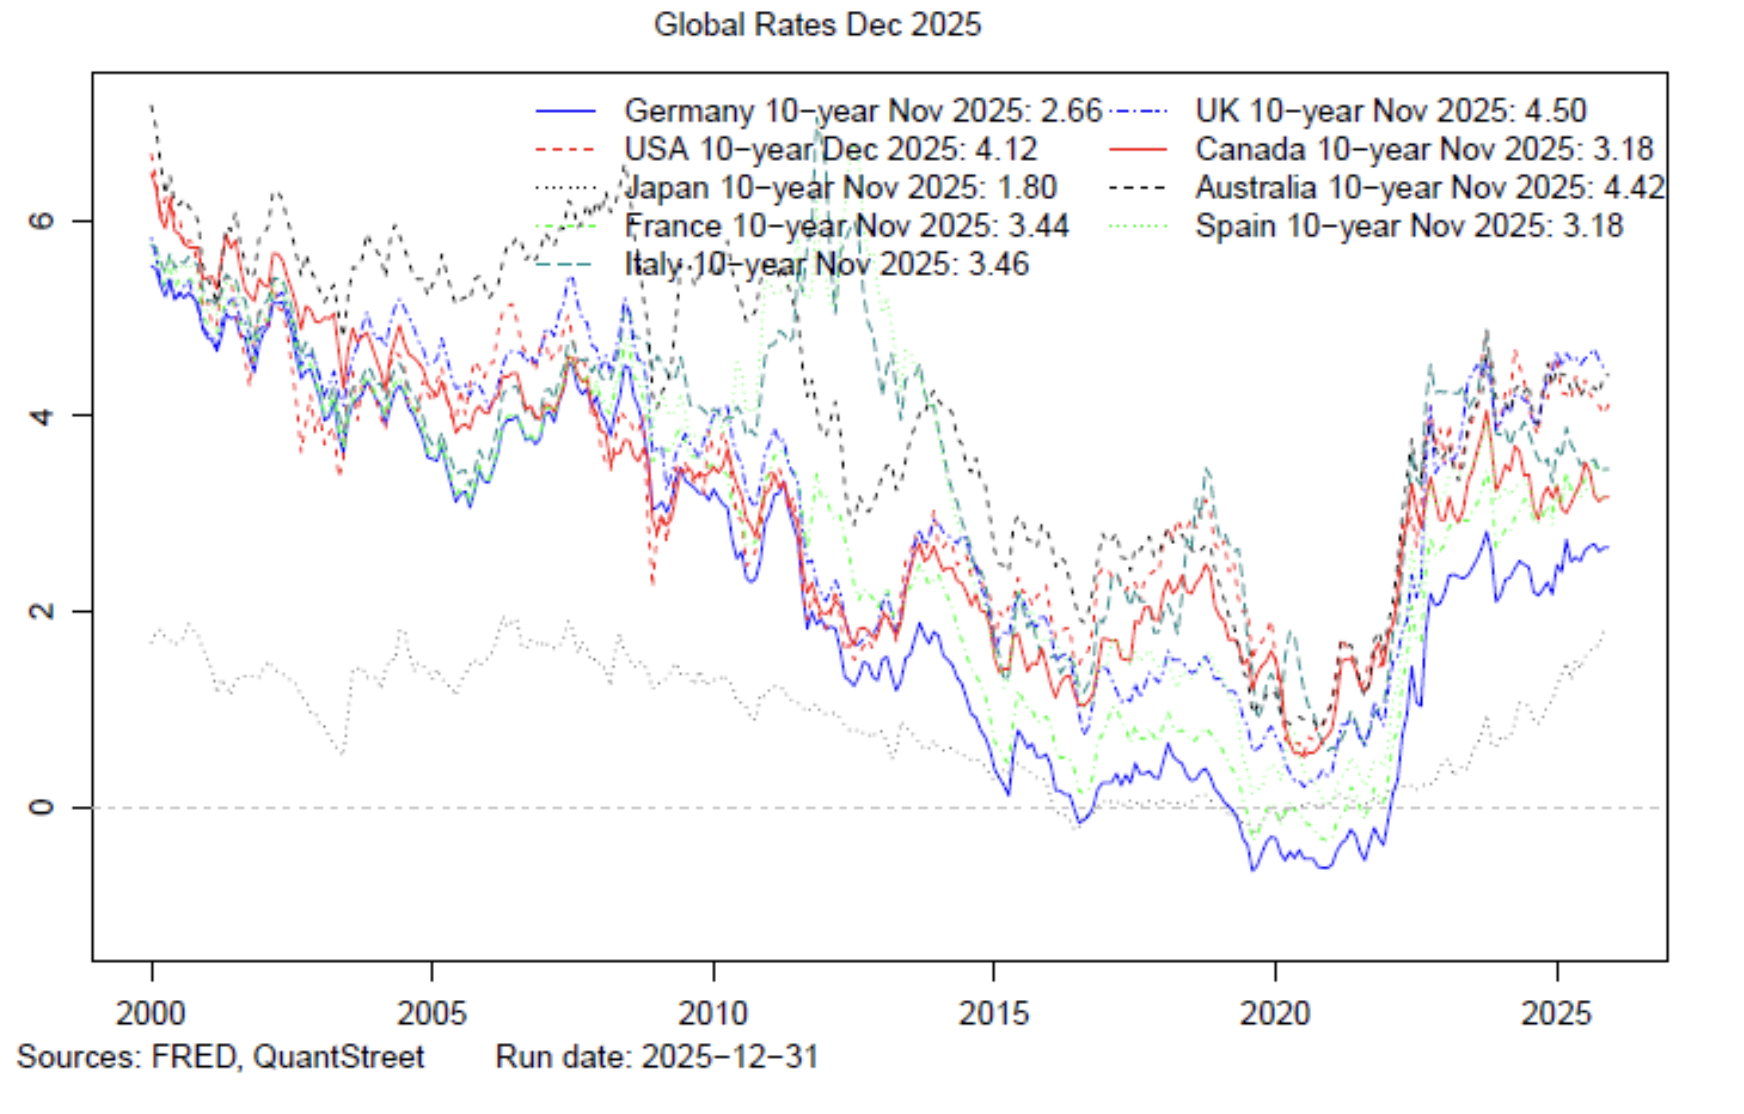
By swapping out of 10-year U.S. Treasuries into 10-year Italian or French government bonds, investors give up over 0.60% in yield and, arguably, switch into lower quality credits. The terms of that swap also make the dollar attractive.
However, the negatives are starting to pile up.
Politics
The aha moment for me came after reading a Wall Street Journal article from December 27, 2025, “Trump wants a weaker dollar. Some Chinese say he has a point.” To quote the article:
“You make a helluva lot more money with a weaker dollar,” the president said in July. When the dollar is strong, “you don’t do any tourism, you can’t sell tractors, you can’t sell trucks, you can’t sell anything.”
Nothing new here. President Trump is a mercantilist at heart and wants the U.S. to have balanced trade with the rest of the world. Though it will come with many knock-on effects, one way to unwind our trade deficit is dollar depreciation: foreign goods become more expensive and U.S. exports become cheaper.
The article continues:
Liu Shijin, a longtime top economic adviser to the (Chinese) government, said in a speech this month that the U.K. and U.S. also started out as primarily manufacturing powers with puny currencies but eventually matured beyond that stage.
Liu cast an envious eye toward Trump’s ability to make the world shudder over U.S. tariffs, which he said was the result of dollar-wielding American consumers’ buying power. Liu said that the whip hand rightfully belongs to China, since its population gives it a potential consumer market “far exceeding the U.S.”
“We should aim for a basic balance between imports and exports” and push for a strong, globally used currency, Liu said.
If influential thinkers in China are pushing for a stronger yuan and weaker dollar, a large part of the trade mechanism supporting dollar weakness disappears. I don’t think a strong yuan represents the CCP’s official policy, but markets will move long before the official policy does.
Add to this President Trump’s desire for lower rates and his search for a new Fed chair willing to deliver them — a move that would diminish both the dollar’s carry advantage and the Fed’s inflation-fighting credibility — and the political ingredients for dollar weakness are in place.
Real Effective Exchange Rate
Another pillar supporting the weaker dollar thesis is the dollar’s high real effective exchange rate. Consider a consumption basket of U.S. goods with a price of $P. Say the price of one dollar in terms of euros is €S (currently around €0.85) and the price of a similar consumption bundle in Europe is €PE. The real dollar-euro exchange rate is then:
dollar/euro real exchange rate = S x P / PE.
This is the ratio of the euro price of buying the consumption bundle in the U.S. to its price in Europe. The higher this ratio, the more “expensive” the dollar becomes. A trade-weighted average of this ratio across all global currencies yields the dollar’s real effective exchange rate (REER).
Expensive currencies tend to depreciate in nominal terms, though this is not always the case — for example, the yen has been “cheap” on a REER basis for a long time and continues to get “cheaper.” This happens because countries with expensive currencies run trade deficits (since foreign goods are cheaper than domestic ones), causing their currencies to flow abroad to purchase international goods. As the global supply of the currency grows — assuming demand remains fixed — prices adjust downward.
The next chart shows the dollar’s REER (in black) and nominal effective exchange rate (NEER; dashed red line). The dollar’s REER is close to an all-time high, despite a nearly 10% sell-off in 2025. The bottom panel of the chart plots the one-year-ahead change in the dollar’s nominal exchange rate against its current REER.
For every point above its steady-state level (around 96, where the regression fit line crosses the x-axis), the dollar tends to depreciate by 0.329 points over the following year. This relationship is well-documented in the academic literature (e.g., Cashin and McDermott, 2004), and the result stands up to statistical scrutiny.
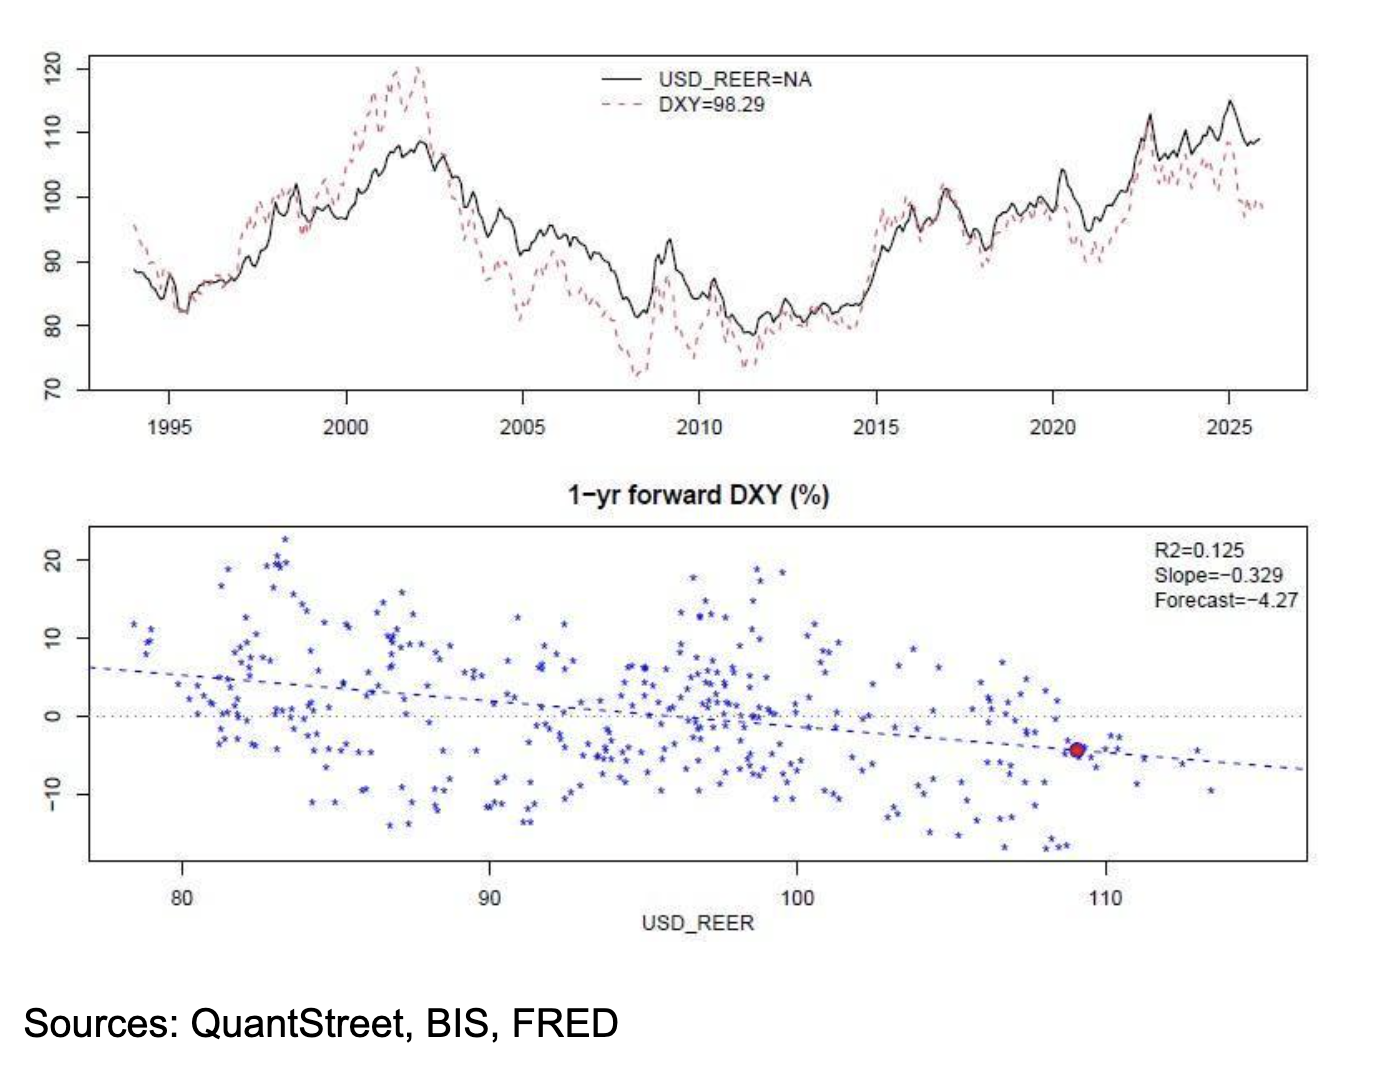
Given its current valuation, the dollar is forecast to depreciate by 4.27% over the next year, and by twice that amount over the next two years.
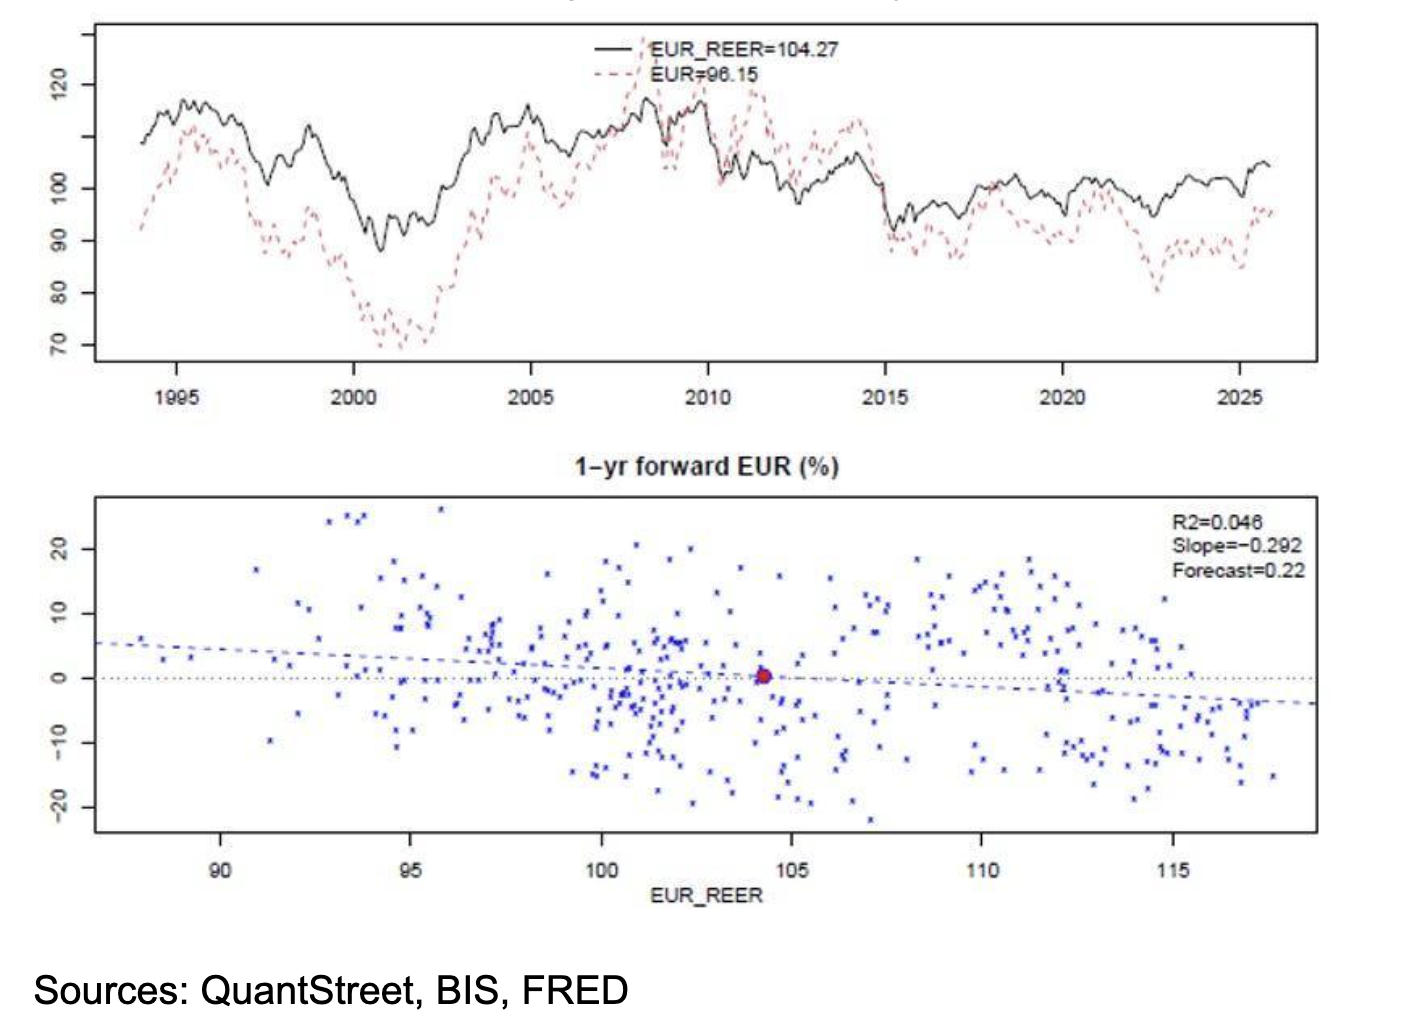
The next figure applies the same analysis to the euro. Its valuation appears neutral relative to its historical REER, and the change forecast for the year ahead is close to zero.
Flows
An unintended consequence of sanctioning foreign countries by freezing their dollar assets has been to push them into other stores of value. The January 23, 2026, WSJ article, “Five reasons gold is surging toward $5,000 an ounce,” features the following chart using data from the World Gold Council, which shows extreme buying of gold by global central banks.
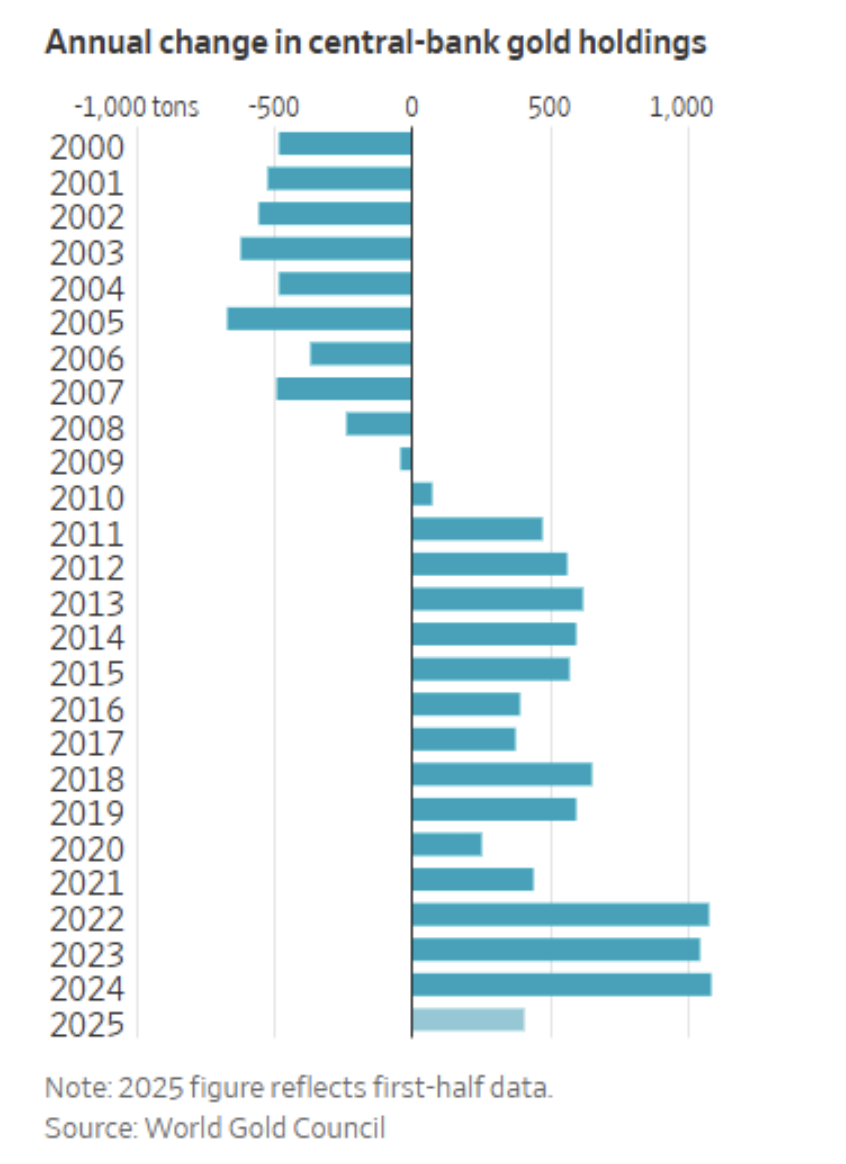
These central bank flows into gold have been augmented with investor flows into exchange-traded funds like GLD and IAU. Together with gold’s inelastic supply, this has pushed the price of gold up to nearly $5,000 per troy ounce, a dramatic appreciation in both nominal and inflation-adjusted terms.
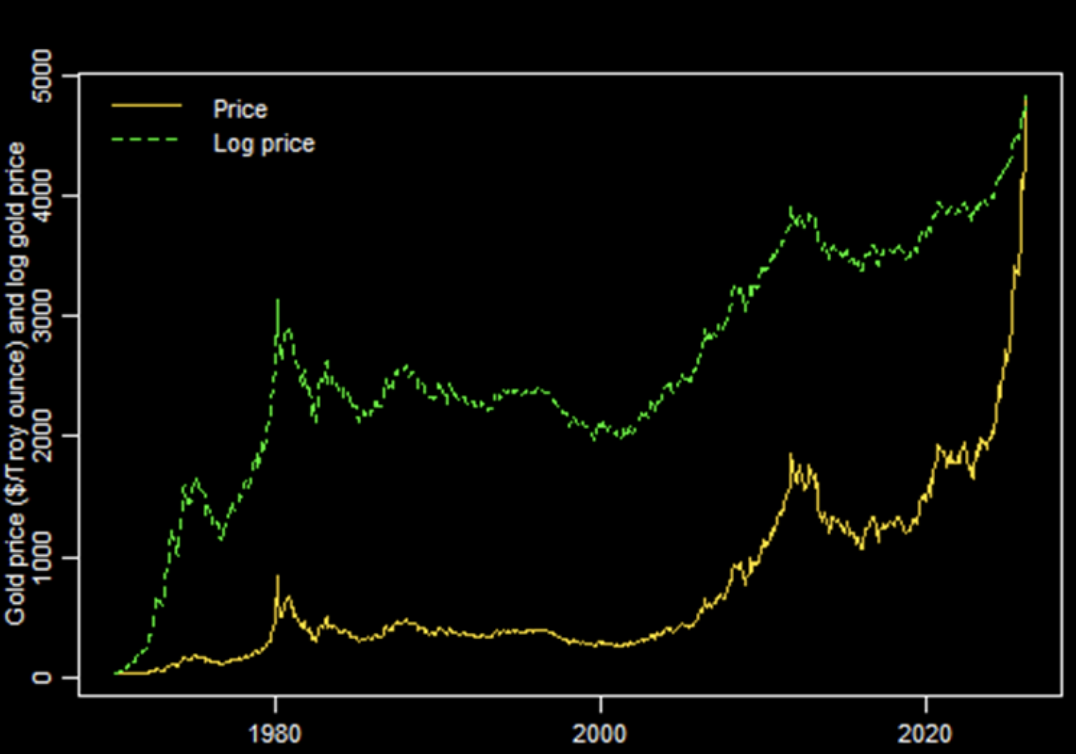
The interpretations of the above chart vary. One is that gold is in a bubble. After such an extreme price run-up — in both speed and magnitude — it’s hard to definitively rule out a bit of froth in the price of gold. The other interpretation is that, while the dollar and Treasuries still represent the majority of global reserve holdings, the dollar’s position as the sole global reserve currency is slowly deteriorating. This shift to other stores of value is most readily seen in assets whose supply cannot be adjusted in the short run, like gold. The latter argument suggests that the recent sell-off in gold may be short-lived, a view that is shared by some on Wall Street.
Not helping matters is the general frustration among America’s allies with the Trump administration’s foreign policy. For example, while I think the Greenland situation will be resolved to the satisfaction of both the Trump administration and America’s European allies, the way it has been handled recently has diminished European investors’ desire to hold U.S. assets, with some going so far as to call for a concerted effort to reduce exposures. I don’t think this is a plausible path forward (neither does the FT’s Robin Wigglesworth), but even a marginal move in this direction will continue to chip away at the dollar’s reserve currency status.
Portfolio Implications
To summarize the dollar thesis, there are the two positives:
- U.S. interest rates are high relative to other developed market economies.
- U.S. economic growth is relatively strong.
The negatives are:
- The Trump administration wants a weaker dollar.
- High dollar valuations forecast future nominal depreciation.
- Political interference with the Fed is dollar negative.
- The signal from the gold market is bad.
- There is widespread frustration with the Trump administration's foreign policy.
Whatever one thinks of the prospects of U.S. versus international stocks, a 4.27% annual headwind will be difficult for U.S. assets to overcome.
Based on QuantStreet’s analysis of long-term valuation trends, our forecasts for U.S. and international stock returns are remarkably similar. Accounting for the dollar headwind for U.S. assets — and the corresponding tailwind for international ones — suggests that investors with light international allocations should rethink their portfolio positions.
Harry Mamaysky is a professor at Columbia Business School and a partner at QuantStreet Capital.
QuantStreet is a registered investment advisor. It offers wealth planning, separately managed accounts, model portfolios and portfolio analytics, as well as consulting services. The firm’s approach is systematic and data-driven, but also shaped by years of investing experience. To work with or learn more about QuantStreet, contact the firm at [email protected].
A message from Advisor Perspectives and VettaFi: Discover something new! Click here to register for our upcoming webcasts.
Membership required
Membership is now required to use this feature. To learn more:
View Membership BenefitsSponsored Content
Live Virtual Event: Join Now

Upcoming Virtual Events View All


