Advisor Perspectives welcomes guest contributions. The views presented here do not necessarily represent those of Advisor Perspectives.
In 1952, Harry Markowitz introduced mean variance portfolio optimization, a breakthrough that ultimately earned him the 1990 Nobel Prize in Economics. His core insight was that a portfolio’s expected return and its corresponding risk depend on the returns and standard deviations of the component investments, as well as the correlations among them. Markowitz’s work became a central catalyst for the rise of Modern Portfolio Theory (MPT) in the 1970s, and MPT remains widely used today in the construction of institutional investment portfolios.
To make alternative investments appear attractive, promoters often claim that their products are only weakly correlated — or even uncorrelated — with traditional investments, while still offering competitive returns. For example, a website dated June 30, 2025, states: “Alternative yield investments can provide uncorrelated, stable income and offer diversification without sacrificing returns.”
By invoking correlation and returns together, such claims invite evaluation through an MPT lens. In other words, does the addition of alternatives move the efficient frontier northwest?
The Importance of Low Correlations
For illustrative purposes, consider the MPT equation for portfolio risk, or standard deviation (σp), of a portfolio simply comprised of stocks and bonds:
where ws is the fraction of the portfolio invested in stocks, wb invested in bonds, σs the standard deviation of stocks, σb the standard deviation of bonds, and ρ the correlation between stocks and bonds. The third term (ρ*σs*σB) is the covariance between stocks and bonds. If two more investments are added to the portfolio, two variance and five covariance terms enter the σp equation; if three investments are added, three variance and nine covariance terms enter; and so forth.
Thus, covariance terms play an important role in the risk-return attractiveness of the resulting portfolio. As more investments are included in the portfolio, correlations and covariance grow to dominate σp.
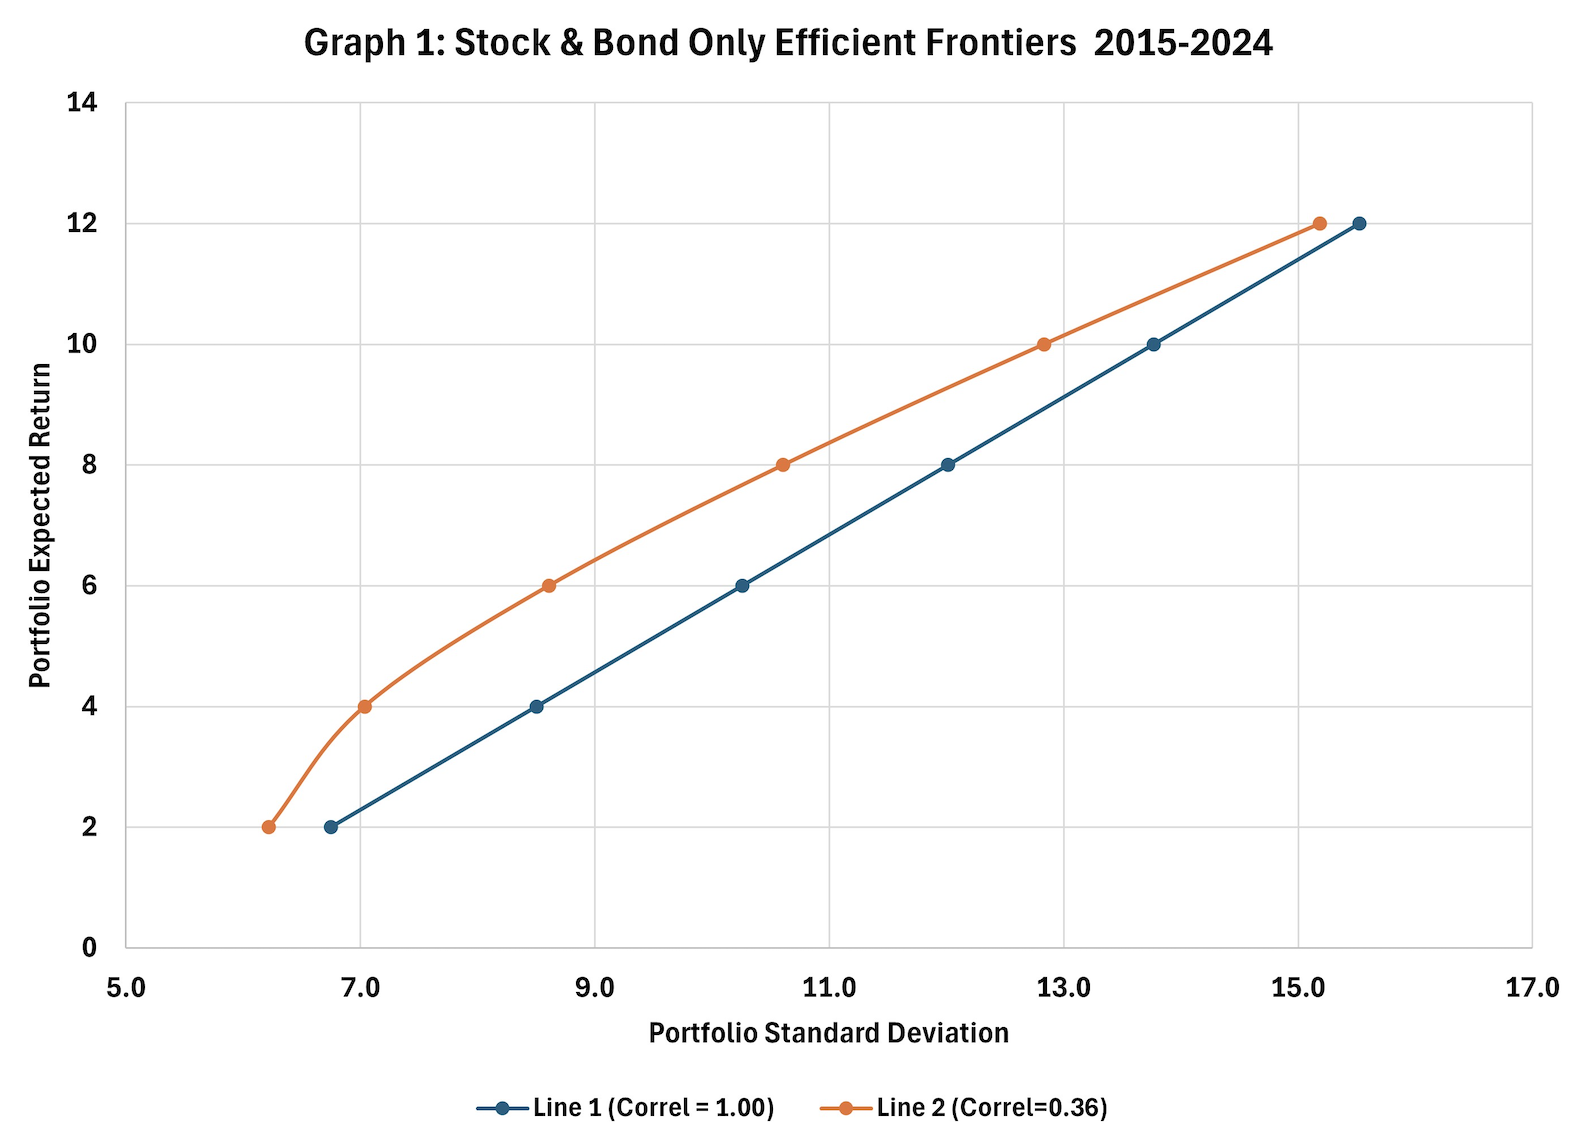
To better understand this impact, Graph 1 shows the resulting portfolio return and standard deviation for varying stock and bond allocations, based on 2015 through 2024 returns. If stocks and bonds were perfectly positively correlated (+1), portfolio risk and return for any combination of the two would lie on a straight line (Line 1).
However, the stock-bond correlation coefficient is 0.36, so the risk-return possibilities bow out to the northwest (Line 2). Line 2 offers more efficient risk-return possibilities than Line 1 — more return for the risk, roughly 2% more for a portfolio standard deviation of 9%.
Source: AthenaInvest, data provided by Yahoo Finance and Morningstar
Viewing Alternatives Through an MPT Lens
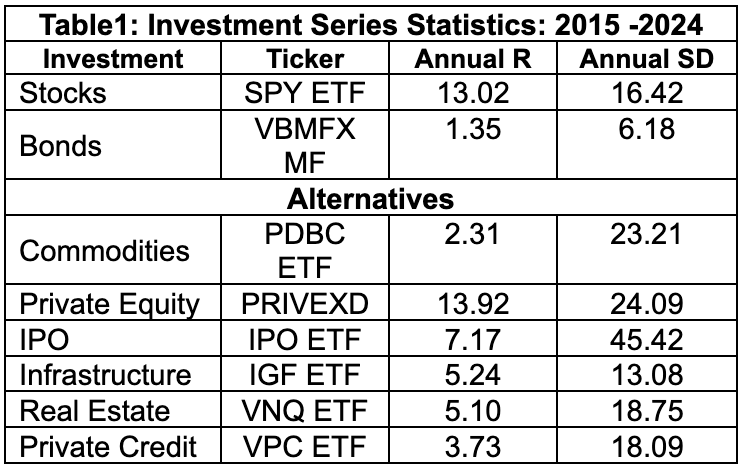
To assess the appeal of alternative investments from an MPT perspective, monthly returns from 2015 to 2024 were gathered for six alternatives, along with returns for the S&P 500 and the Bloomberg Aggregate Bond Index. Because there is no universally accepted list of alternative asset categories, the six selected represent those frequently cited in academic and professional studies of alternatives.
To reflect real-world, after-fee performance, traded ETFs and mutual funds were used as proxies for each alternative category. Tables 1 and 2 list the investment vehicles used, along with their associated statistics.
Source: AthenaInvest, data provided by Yahoo Finance and Morningstar
Do Alternatives Pass the MPT Test?
Source: AthenaInvest, data provided by Yahoo Finance and Morningstar
A quick review of these tables reveals that alternative investments generally do not exhibit compelling characteristics from an MPT standpoint. Except for Private Equity, alternatives tend to deliver lower returns than stocks while exhibiting higher — and in some cases, significantly higher — standard deviations.
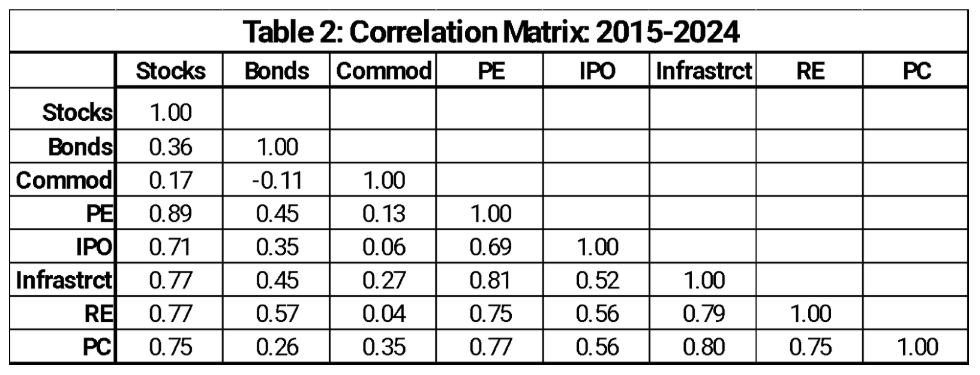
Moreover, their diversification potential appears limited: The cross correlations reported in Table 2 are high for most alternatives, with commodities being the sole exception. These large correlations mean that adding alternatives will not significantly lower a portfolio’s risk.
MPT Efficient Frontiers
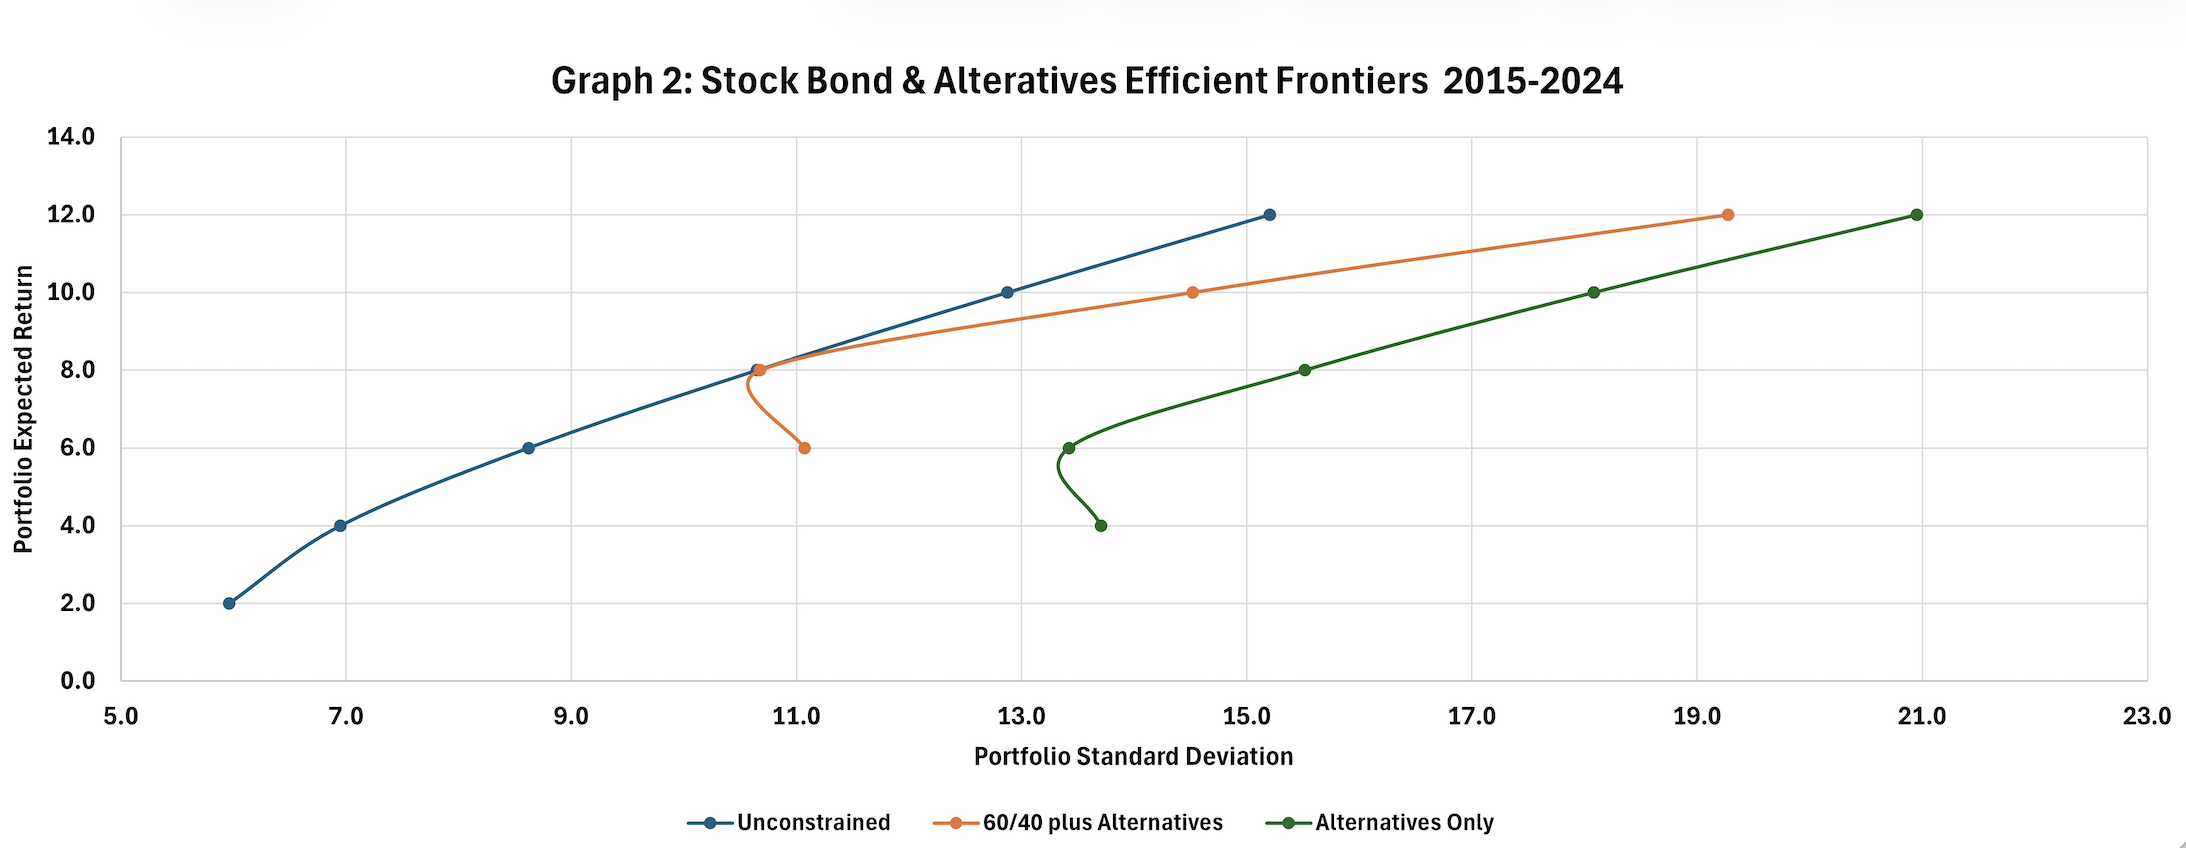
To illustrate the impact of alternatives on portfolio construction, Graph 2 displays the efficient frontiers for three cases: Unconstrained; 60/40 (Stock/Bond) plus Alternatives; and Alternatives Only. The portfolios are “risk-return” optimized by mathematically identifying the investment weights yielding the lowest standard deviation, as given by a variation of the equation presented earlier, for a chosen expected return. The unconstrained frontier — driven largely by stocks and bonds, with only limited alternative exposures — dominates the other two frontiers across all levels of portfolio standard deviation.
Source: AthenaInvest, data provided by Yahoo Finance and Morningstar
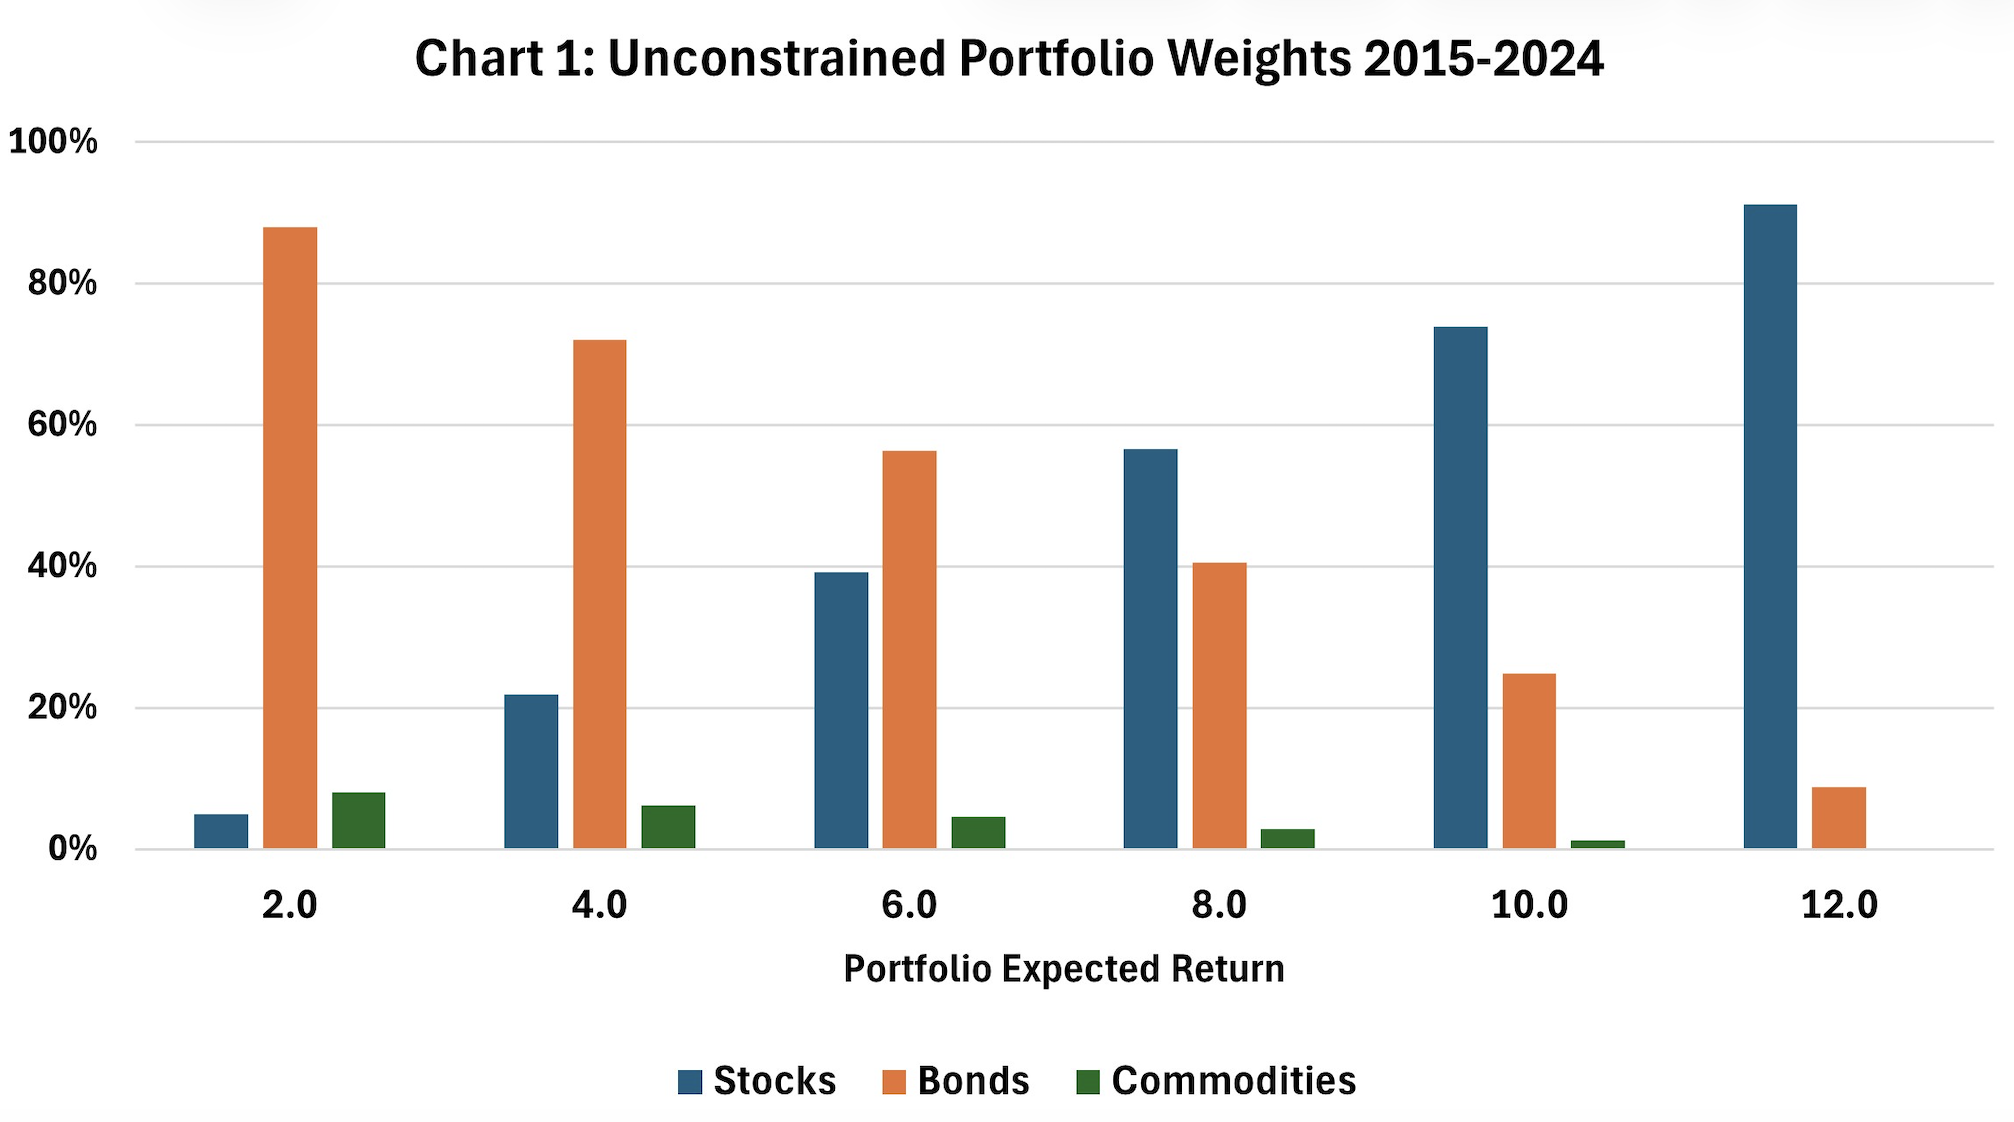
Charts 1, 2, and 3 provide further detail, in the form of portfolio weights, for the optimized portfolios displayed in Graph 2.
Chart 1 presents the outcomes of unconstrained optimization where the eight investments listed in Tables 1 and 2 are considered for possible inclusion in the optimized portfolio with no prior restrictions. In these portfolios, stocks and bonds dominate, with only minimal allocations to commodities, the only alternative that appears in any of the optimized mixes.
Source: AthenaInvest, data provided by Yahoo Finance and Morningstar
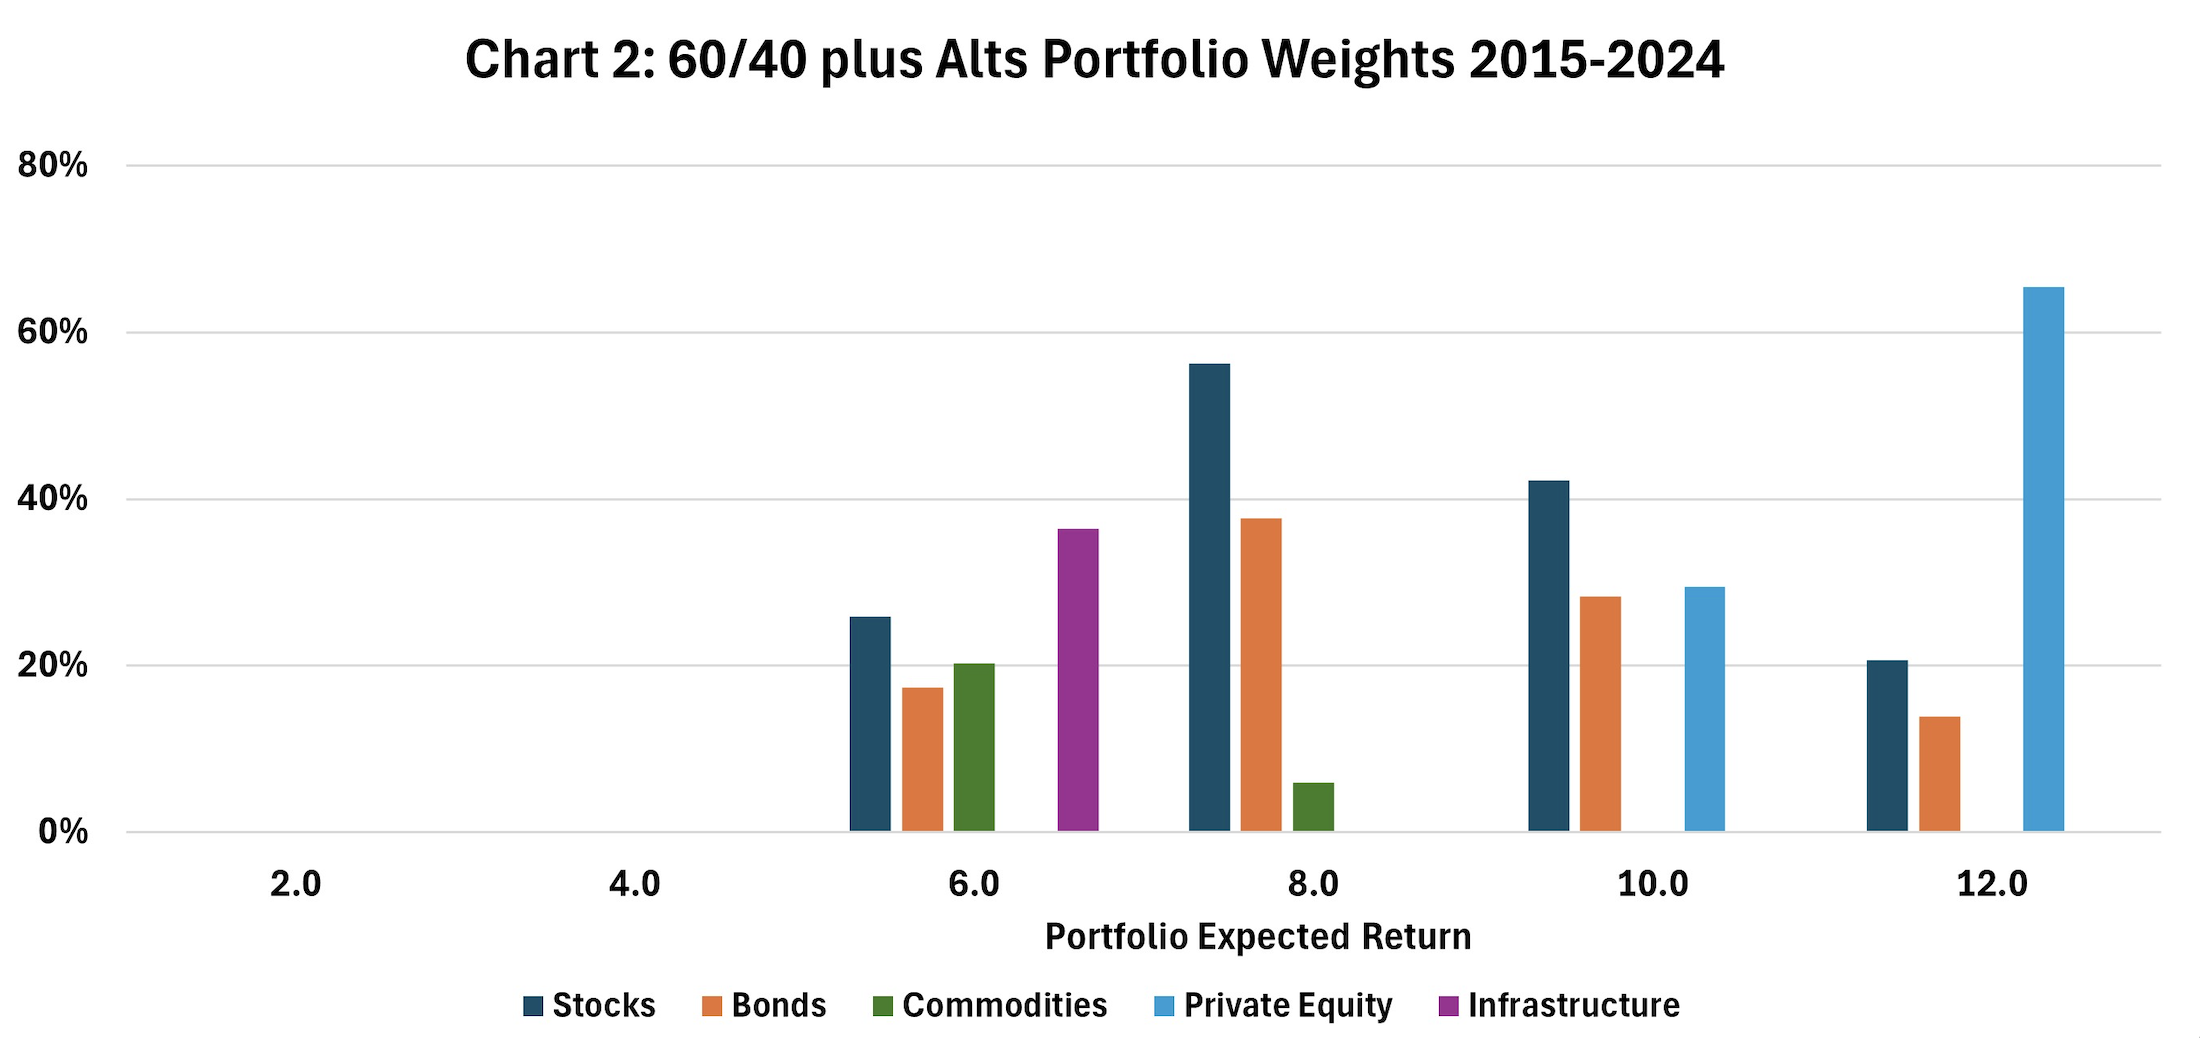
Chart 2 shows the optimized portfolio weights that result from combining alternatives with a traditional allocation of 60% stocks and 40% bonds. Across all levels of portfolio expected return, the 60/40 allocation remains the dominant holding, except in the case of the 12% expected return portfolio. Among the alternatives, only commodities, private equity, and infrastructure receive any allocation, leaving IPOs, real estate, and private credit entirely absent from the optimized portfolios.
Source: AthenaInvest, data provided by Yahoo Finance and Morningstar
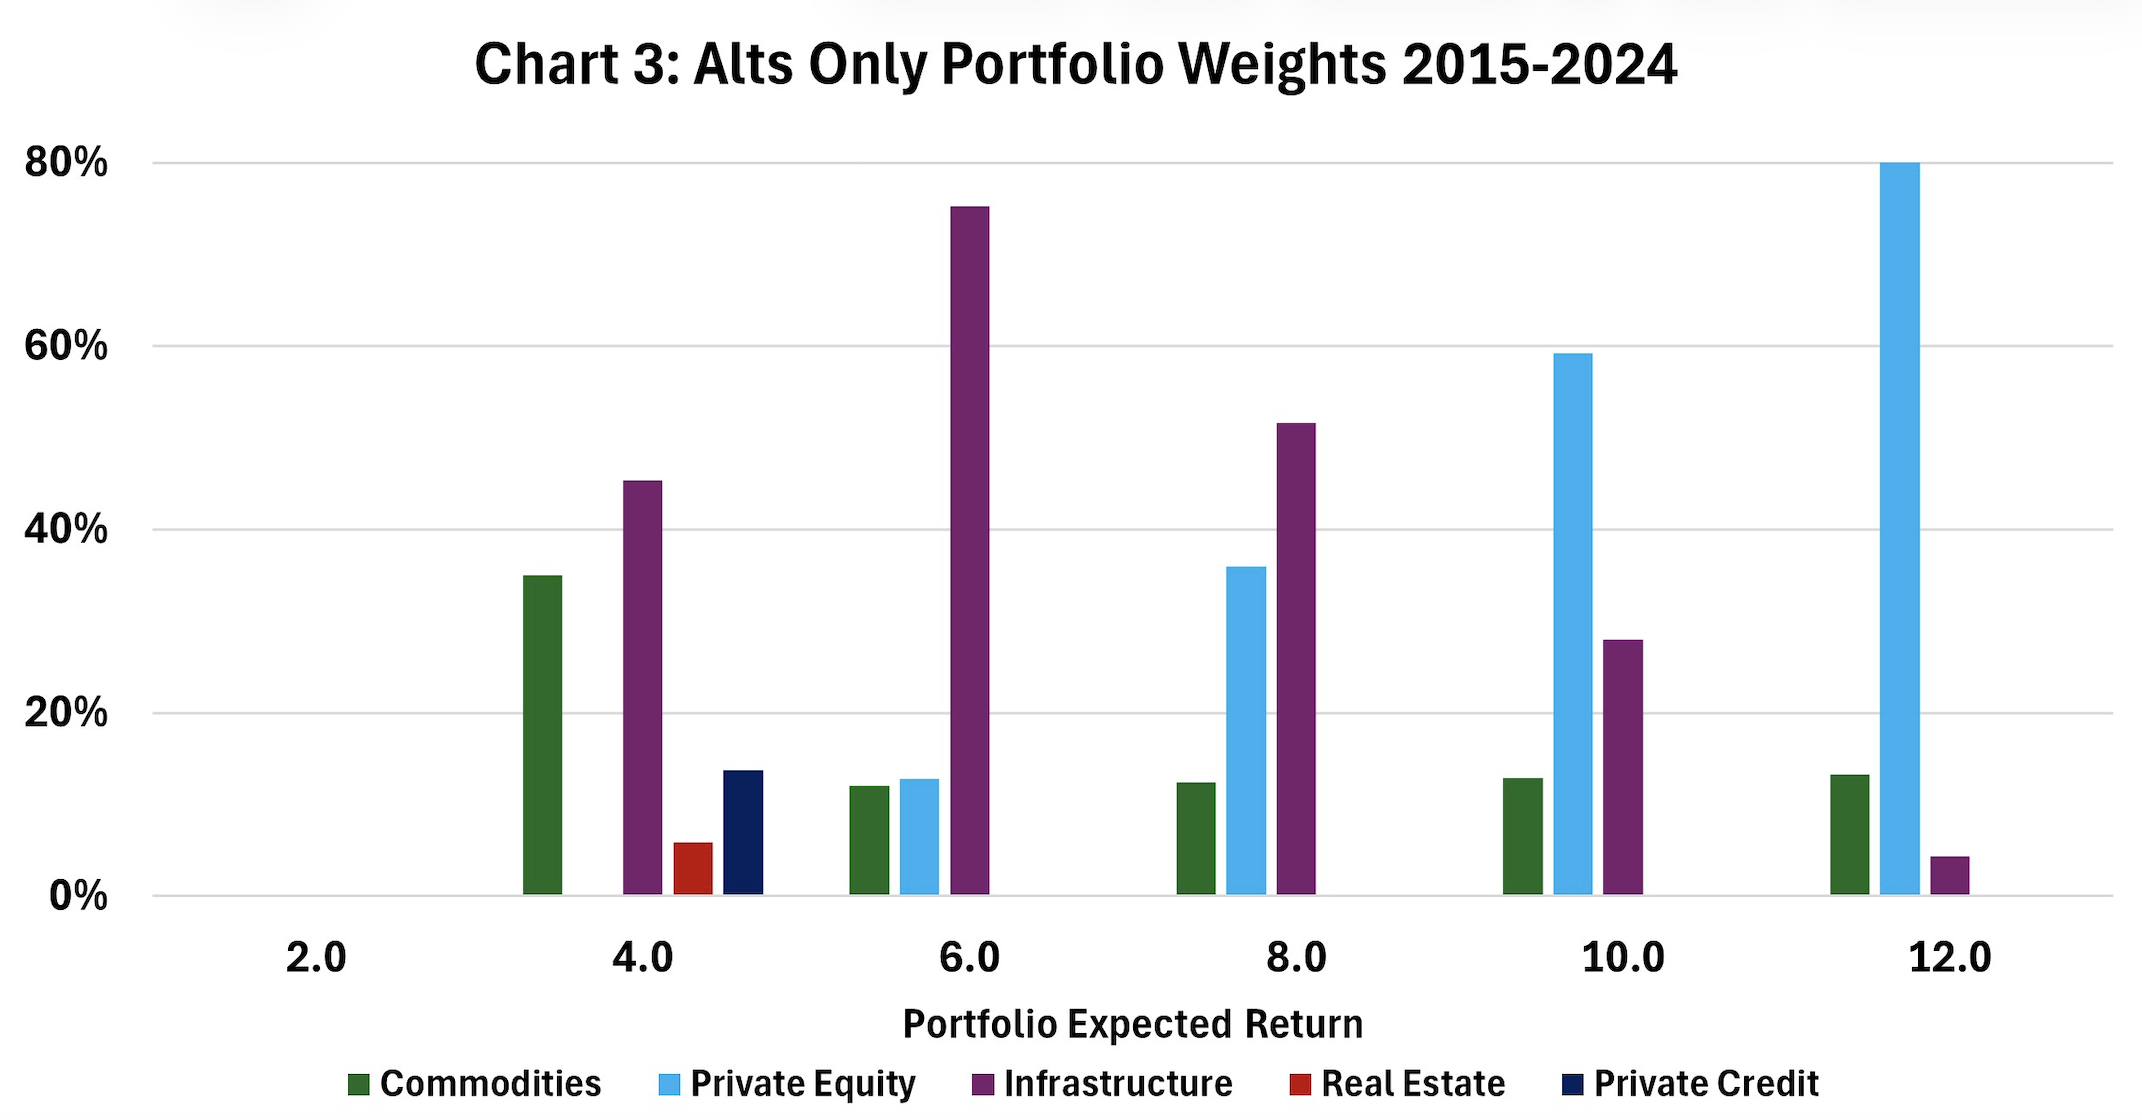
Chart 3 presents the optimized weights for portfolios composed solely of alternatives. In this framework, private equity and infrastructure play prominent roles, while commodities, real estate, and private credit also receive allocations. However, none of these portfolios include IPOs.
Source: AthenaInvest, data provided by Yahoo Finance and Morningstar
These charts show that alternatives become attractive from an MPT perspective only when constraints are imposed on stock and bond weights. The only scenario in which five of the six alternatives receive meaningful allocations is the one that excludes stocks and bonds entirely. Consequently, alternatives should play only a minor — if any — role in an optimal portfolio.
What Others Are Saying
There have been many well-researched critiques of incorporating alternatives into institutional portfolios. The most prominent critic is the highly respected Richard Ennis, who over the past several years has published a series of articles challenging institutional investors’ decisions to allocate to alternatives, including Endowment Performance in 2020, Alternative Investing: The Fairy Tale and The Future in 2021, What the Stock Market Can Teach Us About Private Equity in 2025 with Daniel Rasmussen, and The Demise of Alternative Investing also in 2025.
Ennis’s criticism is best summarized by his November 2025 LinkedIn post Alts for Dummies:
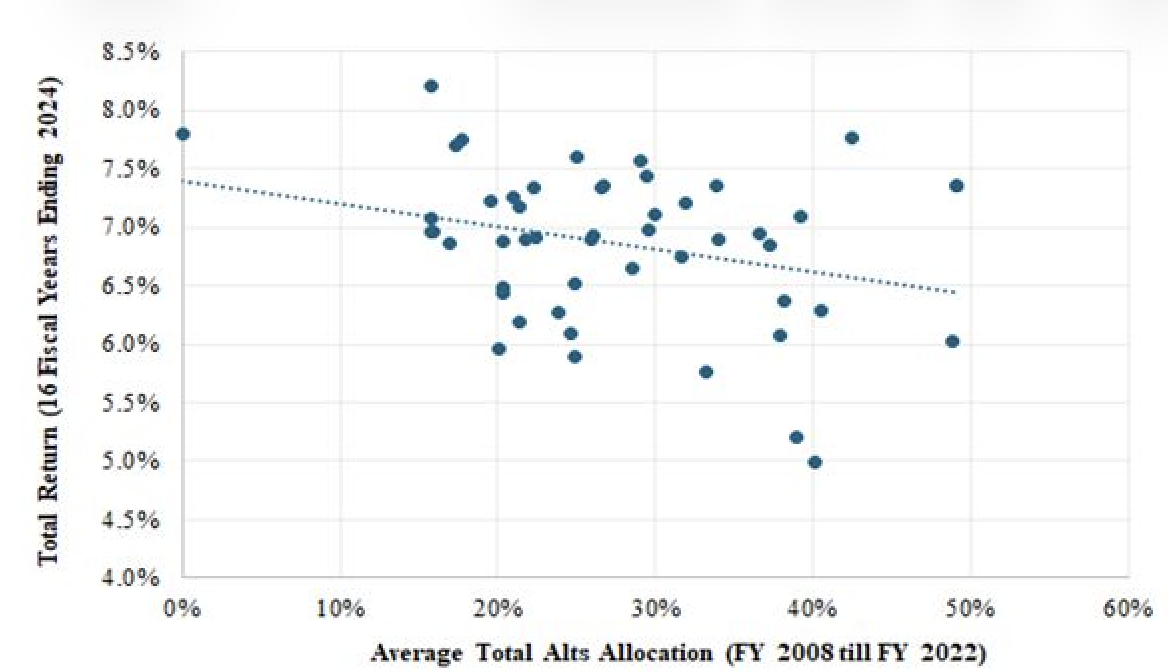
The diagram below captures the impact of alts-investing (including private equity, real estate and hedge funds) on the returns of 50 large public pension funds. It covers the 16 fiscal years, 2009–2024. The average (overtime) alts allocations range from zero to nearly 50% of asset value. A simple line of best fit illustrates the relationship between return and alts allocation. It indicates a normal annualized return of 7.4% for funds with no alts. The normal return for funds with 40% alts is 6.6%, a give-up of 80 bps per year relative to the alts-free figure.1
1 Fund returns are net of fees. Alts allocation data courtesy of Public Plans Data, Center for Retirement Research, Boston College. The slope of the best-fit line is statistically significant.
Ennis’ conclusion is clear: increasing the alternatives allocation lowers return.
A January 27, 2026, Bloomberg article by Janet Lorin provides specific evidence supporting Ennis’ conclusion.
Jagdeep Singh Bachher, who oversees the University of California system’s investments, did something quietly revolutionary seven years ago. He shifted a small piece of the schools’ endowment money away from the typical choices: costly and complicated private equity, venture capital and hedge funds. Instead, he invested in old-fashioned stocks and bonds. The result: UC’s new fund, over the three years ending in June, reported a 15% average annual return, thrashing the performance of some of the richest private schools, most notably Yale University, which pioneered the much-copied model of buying illiquid private investments rather than publicly traded stocks and bonds . . . .
PE funds dragged on university returns. Consider Yale. In the three years ending on June 30, its endowment generated an average annualized return of 6.2%, less than half UC’s stock- and-bond fund. It also lagged the performance that would have been achieved investing 70% in a stock index fund and 30% in bonds or in a 60%–40% mix. (The last time Yale disclosed its asset allocation in its annual endowment report, in 2020, it had less than 14% in publicly traded U.S. and international stocks, with 60% in LBOs, venture capital and hedge funds.) Yale is also underperforming other Ivy League schools, its three-year annualized return besting only the 4.3% of Princeton University, another early adherent of the endowment (alternatives) model. The top performer, Columbia University, had a much higher percentage of its portfolio in publicly traded stocks — more than a third during the year ended in June.
Alternatives “Bubble” in Institutional Portfolios
Despite the well-documented underperformance of alternatives, U.S. pension funds — a major category of institutional investors — have nearly tripled the share of their risky-asset portfolios allocated to alternatives over the past two decades, rising from 14% in 2001 to 39% in 2021.
Juliane Begenau, Pauline Liang, and Emil Siriwardane, in The Rise of Alternatives in 2024, carefully explore a range of reasons why allocations to alternatives have risen so dramatically despite their poor performance. On the surface, these institutional funds appear to be ignoring the MPT optimization results they publicly claim to rely on for portfolio construction. In fact, the authors find that 85 of the 100 largest U.S. pension funds explicitly reference mean variance optimization in their public reports.
The authors conclude that the purported risk-reducing benefits of alternatives do little to explain the growth in allocations. Instead, the primary driver is the steady increase in expected returns assigned to alternatives over time — a trend in which investment consultants play a central role. Because consultants advise many institutions, their views spread rapidly throughout the industry. Herding behavior then reinforces acceptance of consultants’ optimistic return assumptions, as each institution often looks to its peers when making asset-allocation decisions.
In effect, investment consultants have fueled an “allocation bubble” within institutional portfolios, ultimately to the detriment of fund beneficiaries. And because herding is a powerful emotional force, unwinding this collective industry error is likely to be a slow process.
Concluding Comments
There is little evidence that adding alternatives to an investment portfolio reduces risk or improves returns. In fact, a straightforward stock-and-bond portfolio provides superior risk and return characteristics across all levels of investor risk preferences.
The surge in alternatives investing, since the turn of the century, largely driven by investment consultant recommendations, has produced an “allocation bubble” within institutional portfolios that is hurting performance and will eventually deflate, though the timing is impossible to predict.
The bottom line is clear: Alternatives do not pass the MPT test and therefore should be rationally excluded when constructing a long-term, wealth-maximizing portfolio.
Craig Callahan, DBA, is co-founder and CEO of ICON Advisers.
C. Thomas Howard, PhD, is the co-founder, CEO and chief investment officer of AthenaInvest.
A message from Advisor Perspectives and VettaFi: Discover something new! Click here to register for our upcoming webcasts.
Read more articles by Craig Callahan, C. Thomas Howard
 Advisor Perspectives welcomes guest contributions. The views presented here do not necessarily represent those of Advisor Perspectives.