When stocks go down, bonds go up, right? That’s the received wisdom, at least. Well, it’s not what happened when war broke out between the US and Iran last month and both stocks and Treasuries slumped. It wasn’t true last year when both stocks and Treasuries surged. And it wasn’t true when they simultaneously plunged in 2022, with Treasuries actually taking heavier losses.
Those are a lot of disappointments in a relatively short time. That also left some investors wondering if Treasuries are still the bear-market hedge they are touted to be — which prompted me to ask if they ever were. After digging into the data, I discovered a surprising answer: no.
This doesn’t mean that Treasuries don’t do what they have always done well, which is help stabilize portfolios over time. But longstanding assumptions that Treasuries are a lifeline in a bear market have primed investors for disappointment, particularly in markets hammered by war in Iran and haunted by the specters of rising inflation and snowballing federal debts and deficits.
Monthly total returns for the S&P 500 Index and long-term Treasuries had no apparent relationship in the data I reviewed, going back to 1926. Their returns were not correlated over any period, whether over one month (0.08, where a reading of 1 would indicate they moved in lockstep), one year (0.08), three years (0.1), five years (0.08) or 10 years (0.13). Even if you knew with certainty how one would perform in the future, you still couldn’t reliably guess how the other would fare. That hardly amounts to a reliable lifeline.
One reason it’s hard to anticipate how stocks and Treasuries will interact is that their relationship can change drastically. In 2020, for example, they were strongly negatively correlated; then, strongly positively correlated in 2022 and 2023 and more recently, not at all. Across rolling 12-month periods, they have moved almost perfectly together (high single-year correlation of 0.89) and almost totally in opposite directions (low one-year correlation of -0.94), and their correlation can swing wildly from year to year. The same is true when looking at longer periods, except the high and low correlations are less extreme with more time.
So the fact that stocks and Treasuries have moved together in recent years is not unusual. It is also bound to end. In fact, the trailing 12-month correlation peaked in late 2024 and has declined ever since. Their monthly returns were not at all correlated in the past year (-0.01).
Most investors, of course, only care about correlations during bear markets, when they count on Treasuries to offset declining stock prices. That expectation was reinforced by the big three stock market collapses since 2000, namely the dot-com bust, the 2008 financial crisis and the Covid pandemic. The Federal Reserve lowered short-term interest rates to near zero each time and longer rates followed them down, boosting Treasury prices. That conditioned investors to expect a bailout from Treasuries when stocks buckled.
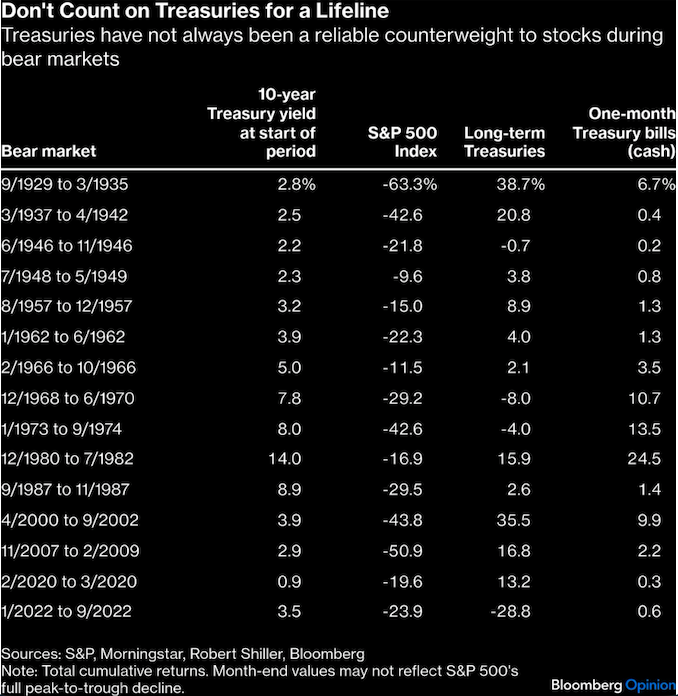
Look back further, though, and Treasuries don’t seem as reliable. I counted 15 bear markets since the 1929 stock market crash. Treasuries declined on four occasions, including a 29% drop during the most recent bear market in 2022 due to Fed rate hikes meant to fight inflation. Four other times, Treasuries were essentially flat, providing little counterweight to lower stock prices. In total, more than half the time stocks slumped, Treasuries did not offer investors ballast in the opposite direction.
Investors would be shrewd, then, to assume that Treasuries may not rescue them during the next crisis. If the Iran War expands and chokes supply lines, inflation may tick higher and lift interest rates with it, sending Treasuries lower. Treasuries may face selling pressure further out from investors worried about Uncle Sam’s fiscal health.
About 25% of Treasuries are owned by overseas investors and central banks. That includes China, which is advising its banks to cut back on US debt and, like other countries, also swapping Treasuries for gold. The Fed itself might also join the selling if chair-nominee Kevin Warsh sticks to his plan to shrink the central bank’s balance sheet and its more than $4 trillion in Treasuries.
None of that is problematic if investors are clear-eyed about what Treasuries can achieve. While they may not be a reliable counterweight to stocks, Treasuries do provide stability to portfolios over time. They are almost always less volatile than stocks, so any amount of allocation to Treasuries makes long-term investing a smoother ride. It also dampens drawdowns most of the time, making bear markets generally less scary.
Less volatility and smaller drawdowns, though, generally mean lower returns over time. Also, less risk isn’t risk free, although there are thoughtful ways to manage bond risk.
So the next time you read a scary headline about stocks and Treasuries moving together, bear in mind that it’s not new and it won’t last. While Treasuries will disappoint you from time to time, your portfolio will almost always be bumpier without them. Don’t expect them to save you in a bear market. Only time and patience can do that trick.
A message from Advisor Perspectives and VettaFi: Discover something new! Click here to register for our upcoming webcasts.
Bloomberg News provided this article. For more articles like this please visit
bloomberg.com.