Advisor Perspectives welcomes guest contributions. The views presented here do not necessarily represent those of Advisor Perspectives.
- Breakeven real rates can inform us how much of a total return portfolio’s realized risk premium would be required merely to catch up to the benefits of delayed claiming, arguably an inefficient use of the equity risk premium.
- For typical longevity planning horizons (age 90-100), the breakeven real rate — above which delayed claiming is no longer beneficial — is higher than has ever been observed historically, about 2.5-4.5% above current long-term TIPS rates.
- The relative attractiveness of Social Security delayed claiming is inversely correlated with TIPS rates, since benefit calculations ignore the prevailing interest rate backdrop.
- Delayed claiming is more beneficial for females than for males, and more generous still for the higher earner of a married couple, at least to full retirement age, as Social Security benefit calculations ignore these actuarially relevant considerations.
- The first year after hitting full retirement age may be one of the most beneficial years to delay, due to the idiosyncratic pattern in the annual step-up from delayed claiming.
Introduction
A common metric for Social Security claiming decisions is the so-called “breakeven age” (e.g., Strike 20251): the age at which the total, cash-on-cash real income is the same whether or not the retiree delays claiming. Researchers have also considered “breakeven rates of return” to various longevity planning horizons (e.g., Blanchett 20242): the geometric returns required from a portfolio to produce the same terminal wealth whether or not claiming is delayed.
This article considers a further extension:3 At what real interest rates (i.e., what TIPS rates) would retirees of various ages and varying longevity assumptions be indifferent between immediate and delayed Social Security claiming, because they could build an identical income stream with TIPS plus Social Security either way?
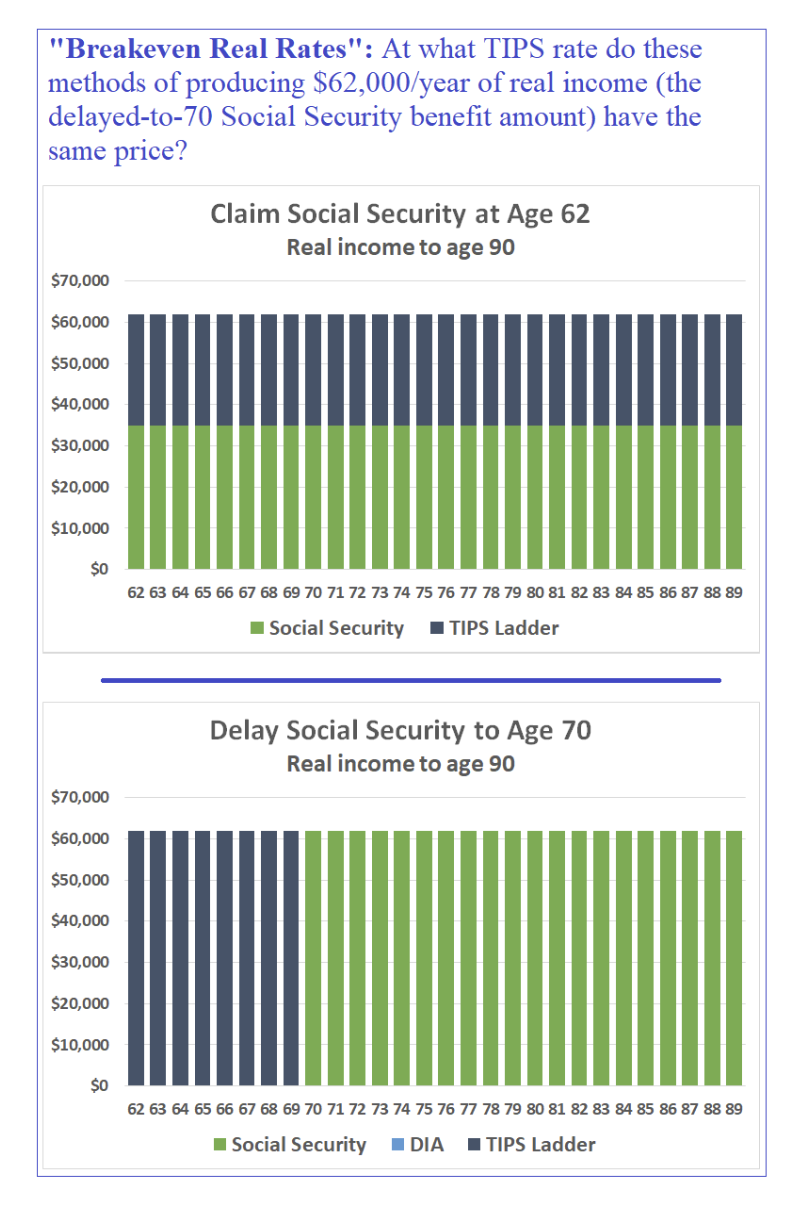
The idea is to find the real (inflation-protected) interest rate at which the following two models produce the same real income out to a chosen longevity planning age:
- Claim Social Security now and build a supplemental TIPS ladder to raise total real income — Social Security plus TIPS — to the level Social Security would have reached if delaying.
- Delay Social Security by some number of years and build a “bridge” TIPS ladder providing the same real income as the delayed Social Security benefit in the years prior to claiming.
The “breakeven real rate” is the TIPS yield at which the required dollars to build each portfolio are the same. At lower real rates, delayed Social Security claiming requires fewer assets; at higher real rates, immediate claiming wins.
I used a $50,000 full retirement age (FRA) benefit, implying a $35,000 benefit if claiming at 62 and a $62,000 benefit if delaying to 70. However, the chosen amount is irrelevant (you could even model just $1 at FRA), provided we assume sufficient assets are available to build the TIPS portfolios.4 The models assume a flat TIPS curve (i.e., real rates the same at all maturities) for simplicity, resulting in a single breakeven real rate per model observation.
The Results
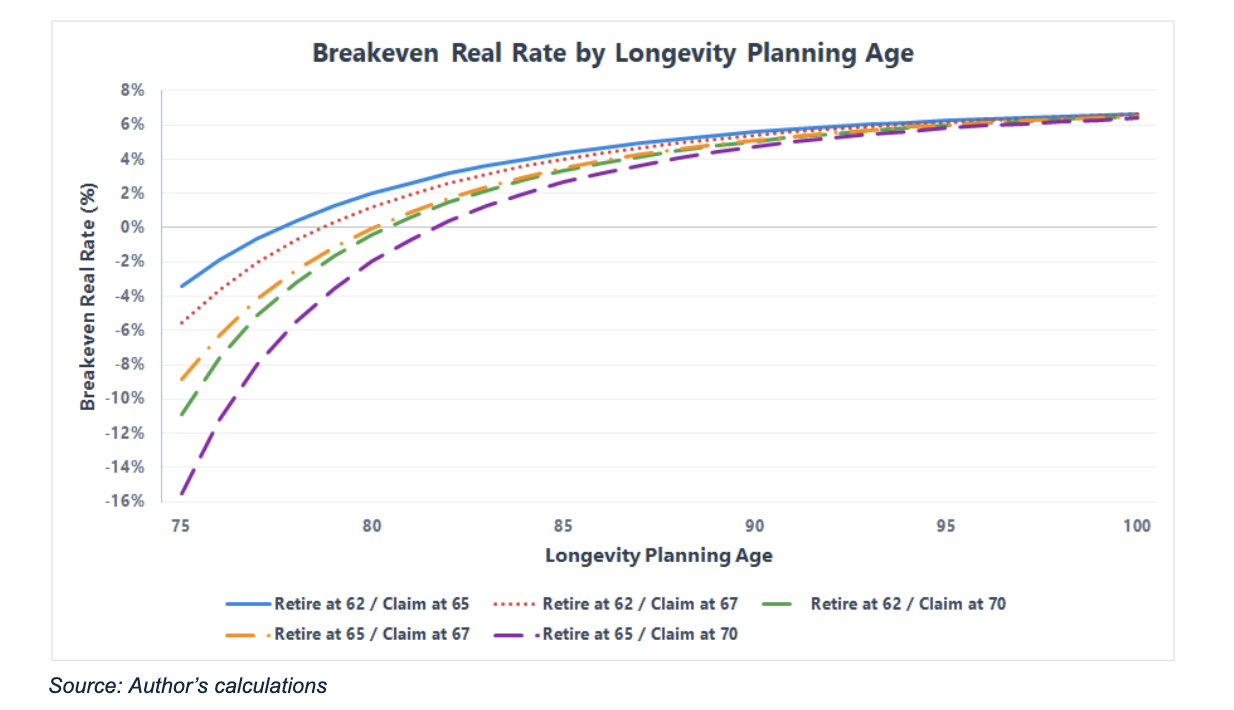
Below is a chart illustrating the breakeven real rate for following delayed claiming scenarios:
- Retire at 62 / Claim at 65
- Retire at 62 / Claim at 67
- Retire at 62 / Claim at 70
- Retire at 65 / Claim at 67
- Retire at 65 / Claim at 70
The later the retirement age and the longer the claiming delay, the lower the breakeven real rate. But as the longevity planning horizon increases, the results converge toward much higher real rates. The breakeven real rate is above the current ~2.5% 30-year TIPS rate by age 84 for all but the “Retire at 65 / Claim at 70” example, which takes merely one year longer.
Per the Social Security Administration (calculator here), male life expectancy at either age 62 or 65 is about 84 years, while for females it is closer to 87 years. But barring known health issues, nationwide pooled life expectancy is an extremely aggressive longevity horizon for financial planning purposes (more about this below).
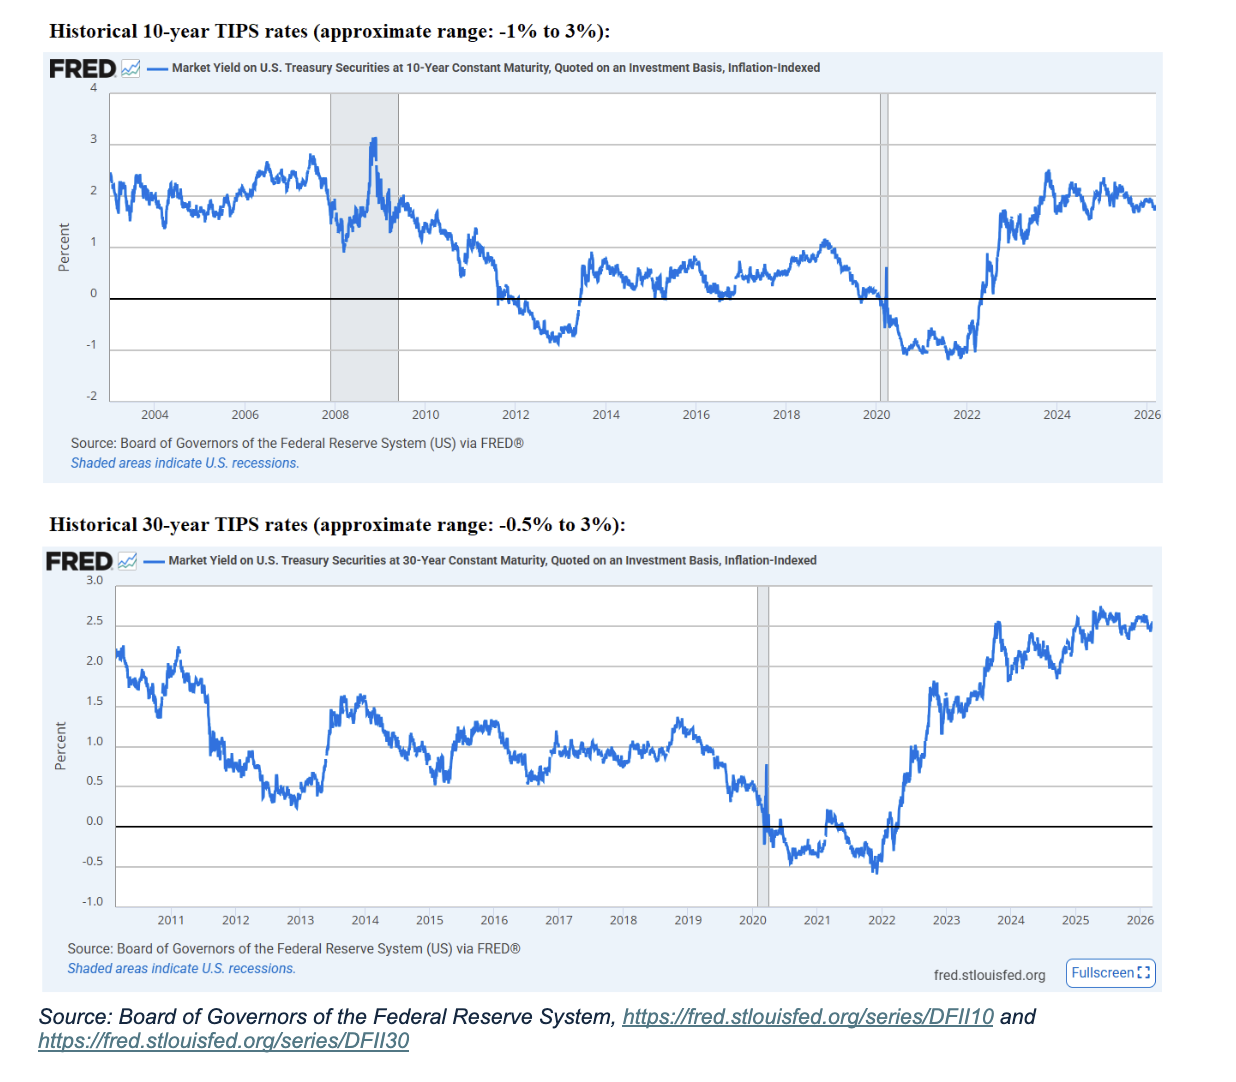
Consider that you have about a 50% chance of living past even an accurately calculated life expectancy.5 For more common longevity planning ages, say 90-100, the breakeven real rate is in the 5-7% range, about 2.5%-4.5% higher than the real yield available in the TIPS market, and higher than any level long-term TIPS rates have ever reached.6
Interpretation
Quantitatively, a “breakeven real rates” calculation is closely related to the “breakeven returns” concept mentioned in the introduction. But a few additional insights can be gleaned from the real rates perspective. For example:
The results are invariant under inflation outcomes: Social Security provides an explicit inflation hedge. Consequently, unexpectedly high inflation would raise the nominal return hurdle required for a risk asset portfolio to match the benefits of delayed claiming, while unexpectedly low inflation would lower the bar. However, TIPS returns provide the same explicit inflation protection as Social Security7, so a breakeven real rates analysis eliminates this potential complication.
The relative generosity of Social Security delayed claiming is inversely correlated with TIPS rates: The higher the TIPS rate, the less generous the incremental benefit from delaying Social Security vs. available market rates, and vice versa. This is weird! For any other form of guaranteed income (e.g., annuities), prevailing interest rates are an input in determining the cost per unit income. However, the step-up for waiting a given span of time from a given age to claim Social Security benefits is the same magnitude regardless of the interest rate environment.
The implication is that for any longevity planning age, the higher/lower prevailing real yields, the smaller/greater the actuarial benefit gained by delayed claiming.8 At a certain threshold (i.e., the breakeven rate), delayed claiming would become actuarially inefficient.
Real yields and stock/bond expected returns are related through a risk premium: The TIPS yield is as close as you’ll get to a risk-free rate of return. Equities and credit bonds have a higher return in expectation, in exchange for a non-negligible risk of underperforming the TIPS return! It is a risk premium, not a free lunch. I’ve found myself repeatedly having to beat this horse, despite the fact that by the most basic logic, the idea should have been dead on arrival.
Here’s why this matters: If, say, a 9% portfolio return may be needed to break even with delayed Social Security claiming (if inflation meets expectations), it can be a bit hard to tell whether that’s “good” or “bad”; i.e., is this an efficient risk to take? Seeing that the same planning horizon maps to about a 6% breakeven real rate — about 3.5% above the current long-run TIPS yield — we can recognize that the first ~3.5% of the realized risk premium from a total return portfolio would be absorbed merely catching up to the benefits of delayed claiming.
From this perspective, it is much easier to see the extent to which early claiming may be an inefficient use of the equity risk premium, let alone the bond portion of a total return portfolio, which has a sub-6% expected real return to begin with. This inefficiency may be exacerbated by sequence of returns risk, which can lead to plan failure even if the end-to-end geometric portfolio return reaches the ex ante breakeven calculation.
Longevity Hedging
Everywhere above, I’ve used a “longevity planning age” as though it makes sense to just pick a date of death and run all your planning to that date. But an individual’s lifespan is unknown in advance, and you can put me in the camp of those who prefer to plan by retirement researcher Wade Pfau’s dictum to “play the long game.”
One way to do this is by picking an extremely long planning horizon, such that the risk of outliving the plan is truly negligible. I will sometimes run models for clients out to ages in the 105-year range for illustrative purposes. However, fully planning to such a horizon implies extremely conservative decision-making, such as accepting certainty of less generous spending in the young and healthy years of retirement in exchange for greater safety at ages unlikely to be reached.
An alternative method is explicit longevity hedging, which is a huge advantage of Social Security — an advantage that is not captured by the breakeven analysis above. Indeed, for most people, delayed claiming is likely the only reliable9 way to simultaneously hedge the twin terrors of retirement cash flow planning, inflation and longevity.
Addendum: Modeled Comparison to Inflation-Linked Life Income
To investigate the value of Social Security’s longevity hedge, we would ideally compare the up-front cost of delayed claiming to the cost of purchasing an inflation-protected annuity. Unfortunately, there is at present no available inflation-protected analog to a nominal life annuity. Contrary to what some believe, an annuity with a fixed COLA is not such an analog, as David Blanchett has convincingly demonstrated.
And yet, we can use another kind of breakeven, the breakeven inflation rate between TIPS and nominal Treasurys, to estimate what a fairly-priced inflation-protected annuity might cost. Long-run breakeven inflation rates have been in the 2.5% range for some time. Adding a conservative 0.5% prospective swap spread,10 this implies that an inflation-linked annuity might be possible for approximately the same cost as a 3% fixed COLA.
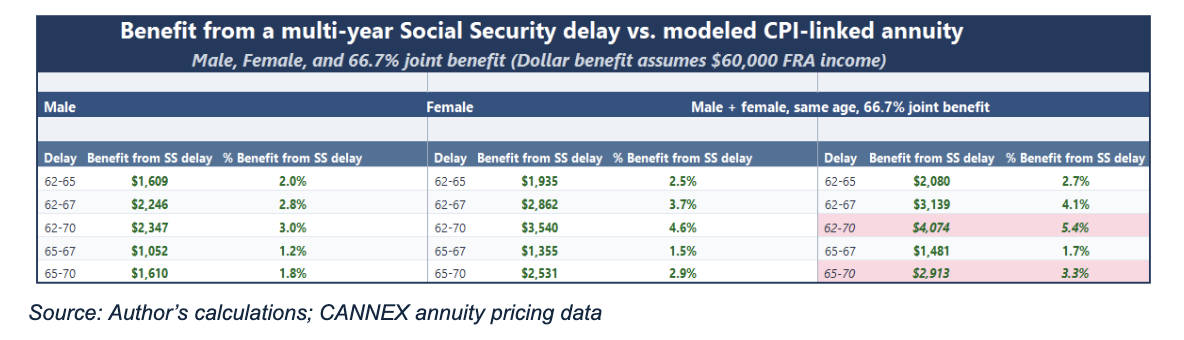
Given the many complexities and assumptions built into this analysis, I won’t belabor the details.11 That said, a few interesting observations can be gleaned from pricing annuities with 3% COLAs for an “apples-to-apples”(-ish)12 comparison of Social Security delayed claiming vs. a modeled CPI-linked, longevity hedged annuity income stream.
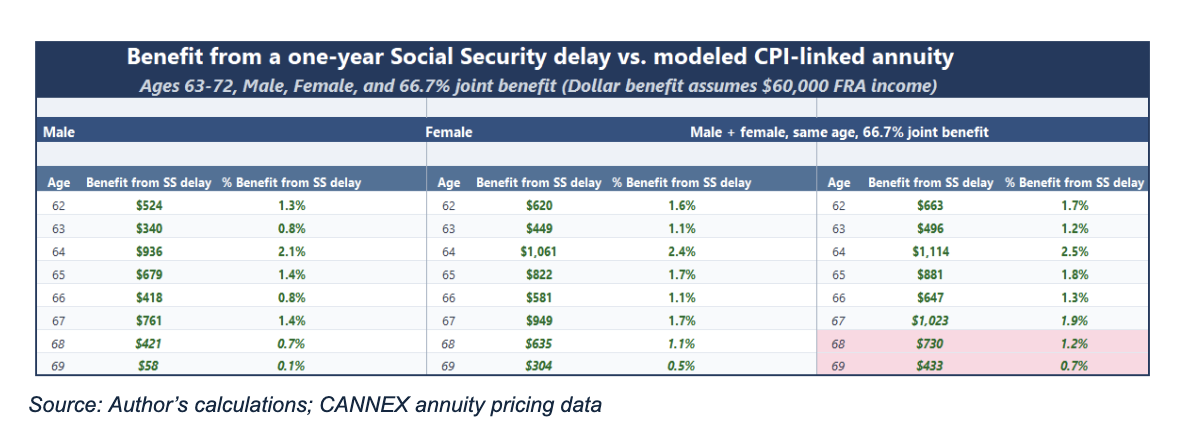
Examples are included below for males, females, and a 66.7% joint life scenario. The last matches the case where a spouse has claimed half of the retiree’s benefit for their own, since only the full benefit paid to the retiree remains after either spouse’s death. However, note the pink-shaded regions in the tables below, which overestimate the delayed claiming advantage by ignoring two nuances: 1. Spousal benefits are capped at 50% of the full retirement age (FRA) benefit. 2. A spousal benefit cannot be claimed until the primary benefit is activated. If spouses are the same age and have a wide earnings disparity, forgoing the spousal benefit after FRA is a considerable headwind to delaying claiming beyond 67.
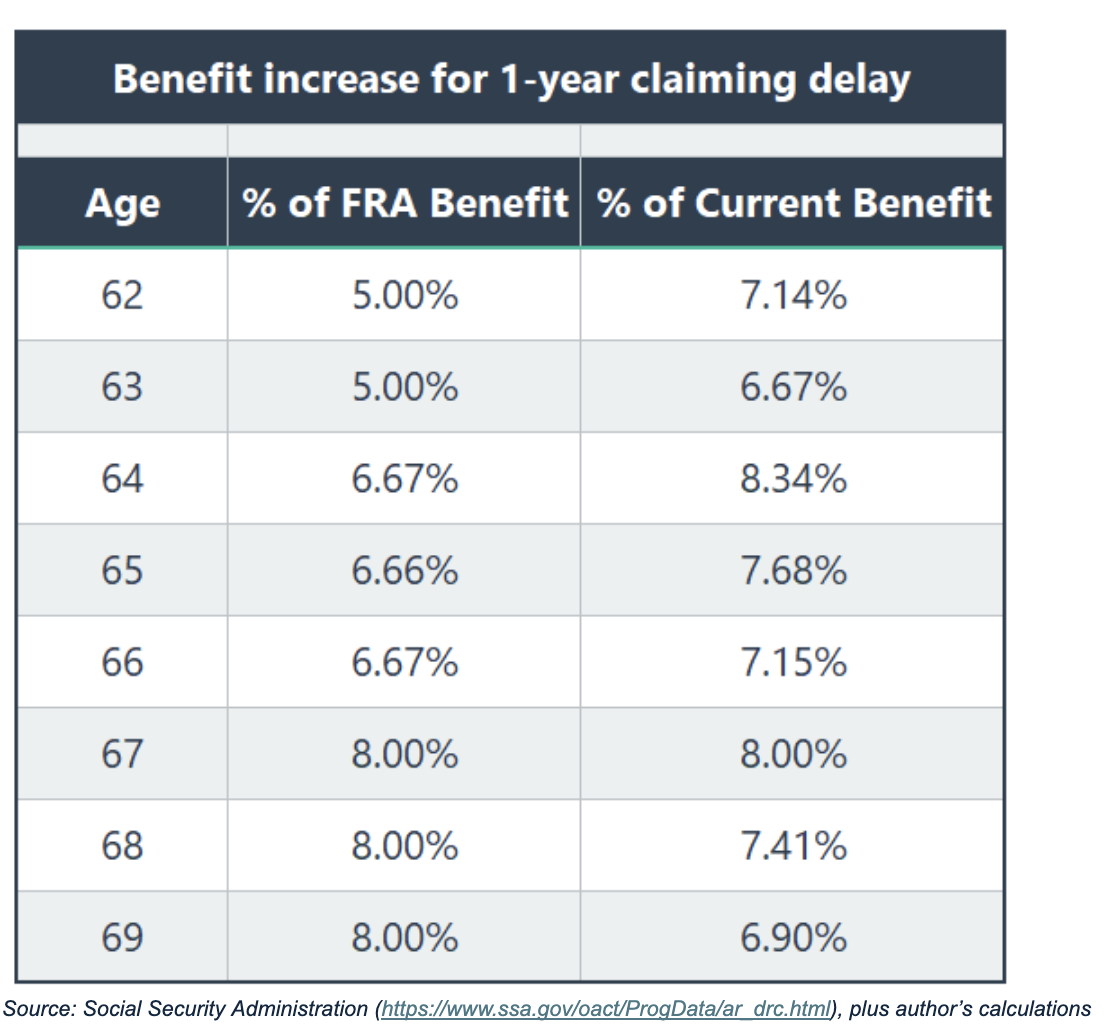
Below is the modeled “benefit” from a one-year claiming delay, at each eligible age. The dollar benefit is the extra real income per year from delayed claiming for someone with a $50,000 full retirement age benefit (near the max). The tables also convert this to an annual income percentage benefit, which would hold regardless of FRA income level.
And here is the modeled advantage for the same multi-year delay examples as before:
The first and most obvious finding is that all calculations are positive. This comports with the oft-noted observation that Social Security delayed benefits are actuarially overgenerous. However, at present, it is also possible with certain income-oriented fixed index annuities (FIAs) to purchase a seemingly actuarially overgenerous income benefit. Anyone familiar with my writing will know how earnestly I wish to see CPI-linked guaranteed lifetime withdrawal benefits on FIAs.
A second observation is that delayed claiming is effectively more beneficial for females than for males, and more generous still for the higher earner of a married couple. As with prevailing real interest rates, such inputs are not included in an individual’s Social Security benefit calculation, whereas they are relevant to commercially available annuity products.
A final, wonky observation relates to the peculiar pattern in the magnitude of the actuarial benefit from delaying for a single year. Note, for example, that delaying at age 68 is less beneficial than delaying at 67, and that delaying at 69 is less beneficial still, to the point where the male example is almost breaking even.13 For every added year of age, the percentage increase in income from deferring annuity benefits will get larger, because the accrued mortality credits increase with age. The “8%/year” step up in Social Security benefits beyond full retirement age works the opposite way. It is really 8% of the FRA income level that gets added. So, for each $1.00 of real income at 67:
- $1.08 (an 8% increase) can be claimed at 68
- $1.16 (a 1.16/1.08 - 1 = 7.4% year-over-year increase) can be claimed at 69
- $1.24 (a 6.9% increase) can be claimed at 70
As the tables above illustrate, the first year after hitting FRA is thus one of the most beneficial years to delay (barring the spousal benefit issue noted above), arguably more so than the last year before FRA, though of course the former is impossible without first incurring the latter.
The pattern of the annual step-up in benefits is as follows:
Understanding this nonlinear, actuarially odd pattern can be a small but easy way to improve Social Security claiming scenario analysis.
The author would like to thank David Blanchett for his helpful comments on this article.
In his roles as chief investment officer for Round Table Investment Strategies and portfolio manager for Torren Management, Nathan Dutzmann is responsible for applying financial science and investment research to the process of constructing portfolios tailored to the individual needs and goals of clients nationwide. Nathan was previously an investment strategist with Dimensional Fund Advisors and a partner and chief investment officer with Aspen Partners. He is also a member of the investment industry advisory council for The American College of Financial Services. He holds an MBA from Harvard Business School and a master’s degree in international political economy and a bachelor’s degree in mathematical and computer sciences from the Colorado School of Mines.
1. Bryan Strike, “Social Security Break-Even Point: What It Is and Why It Matters”, September 2025, Mercer Advisors, https://www.merceradvisors.com/insights/retirement/social-security-break-even-point-what-it-is-and-why-it-matters
2. David Blanchett, “Breakeven Returns for Delayed Social Security Claiming”, October 2024, PGIM DC Solutions, https://www.pgim.com/content/dam/pgim/us/en/pgim-dc-solutions/active/documents/white-papers/PGIM-Breakeven-Returns-for-Delayed-Social-Security-Claiming.pdf
3. Notably, Wade Pfau conducted the same analysis for the “Retire at 62 / Claim at 70” example in his Retirement Planning Guidebook. (page 178 in my first edition copy.)
4. It’s arguably irrelevant even then, if we recognize that the calculation is equivalent to simply calculating the real IRR of delayed claiming vs. immediate claiming.
5. Median and mean are not identical, of course, but analysis of life expectancy tables, such as this one from the Social Security Administration, demonstrates that “about 50%” is roughly correct for males and females in their 60s.
6. TIPS were first issued in 1997, and while the Treasury only calculates constant maturity real yields back to about 2010, the real yield on the earliest 10- and 30-year bonds suggest that long-term TIPS yields have never reached as high as 4.5%: e.g., https://fred.stlouisfed.org/series/DTP10J08 and https://fred.stlouisfed.org/series/DTP30A28
7. Technically, TIPS follow CPI-U while Social Security follows CPI-W, but the difference is minimal and likely smaller than the difference between either metric and the inflation on a given individual’s personal consumption basket.
8. Given that lower real yields also imply a higher up-front cost to build an income bridge to delayed Social Security benefits, the affordability of delayed claiming is not so clearly inversely correlated to TIPS rates. Moreover, a comparison to total return strategies depends on such confounding factors as the degree to which the expected equity risk premium (i.e., above real yields) varies as real yields evolve, and the resulting implications for, e.g., sustainable withdrawal rates. This is very complicated, and I won’t dive into it here. But I figured I should mention it before anybody else does. Suffice it to say that someone with insufficient assets may not be able to delay claiming under the very circumstances where it is most beneficial in theory to do so. But this is not an argument for the attractiveness of early claiming; it is an unfortunate outcome driven by an unfortunate input.
9. Allow me to use this footnote to scream into the wind about the U.S. government’s failure to address the increasingly urgent questions about the degree to which these benefits are reliable. Also, for those who’ve read my article on LifeX funds, be advised that a lack of early uptake in the market led to modifications that weakened the proposed longevity + inflation hedge for current owners and raised serious questions about whether the mortality-pooled successor funds will materialize at all.
10. Say what?! Annuity carriers do not exclusively hold Treasury bonds to immunize their cash flow liabilities. They generate extra yield (in exchange for some additional risk of default) by holding other assets. To build a competitive CPI-linked income annuity, a carrier couldn’t just hold TIPS. Instead, they could use inflation swaps to convert nominal cash flows in their general account into CPI-linked cash flows. A 0.5% swap spread is higher than typically observed for such products, but inflation swap liquidity is not high, especially on “deep longevity hedge” long horizons.
11. If anyone is interested in the modeling details, feel free to reach out to me on LinkedIn.
12. Part of the “ish” is taxes, which I have conveniently ignored throughout this analysis. This is effectively equivalent to assuming portfolio assets are held in an IRA and thus 100% subject to taxation and that Social Security is also 100% taxed. The latter assumption is overly conservative, as a maximum of 85% of Social Security benefits are included in taxable income. Contra any notion that the former is overly conservative as well, comparing after-tax portfolio assets to pre-tax Social Security benefits is not apples-to-apples (not even ish).
13. Recalling that the 0.5% modeled swap spread is conservative, the 69-to-70 delay for a single male may not be actuarially advantageous at all, given the current rate backdrop.
A message from Advisor Perspectives and VettaFi: Discover something new! Click here to register for our upcoming webcasts.
Read more articles by Nathan Dutzmann
 Advisor Perspectives welcomes guest contributions. The views presented here do not necessarily represent those of Advisor Perspectives.