Most of us know this story too well: lagging returns on the screen, the benchmark comparison looking difficult, and the committee asking increasingly pointed questions about a manager whose thesis made sense 18 months ago. Next, a member moves to make a change based on blended data that obscures more than it reveals, and a manager is gone.
What if that number was a blend of two fundamentally different measurement environments, and the blending was systematic enough to mislead in predictable ways?
The Days That Do Not Count
Markets do not behave the same way every day. On days when the S&P 500 moves 2% in either direction, inter-stock correlation spikes and individual security selection becomes largely irrelevant to portfolio outcomes. When beta runs the show, whatever a manager was trying to express through their stock selection gets swamped by the tide moving everything together.
On calm days, when the market barely moves, the opposite is true. Individual stocks are free to express their stories like an earnings surprise, a management change, or a competitor stumbling. That's when any manager's research shows up in the portfolio in a measurable way.
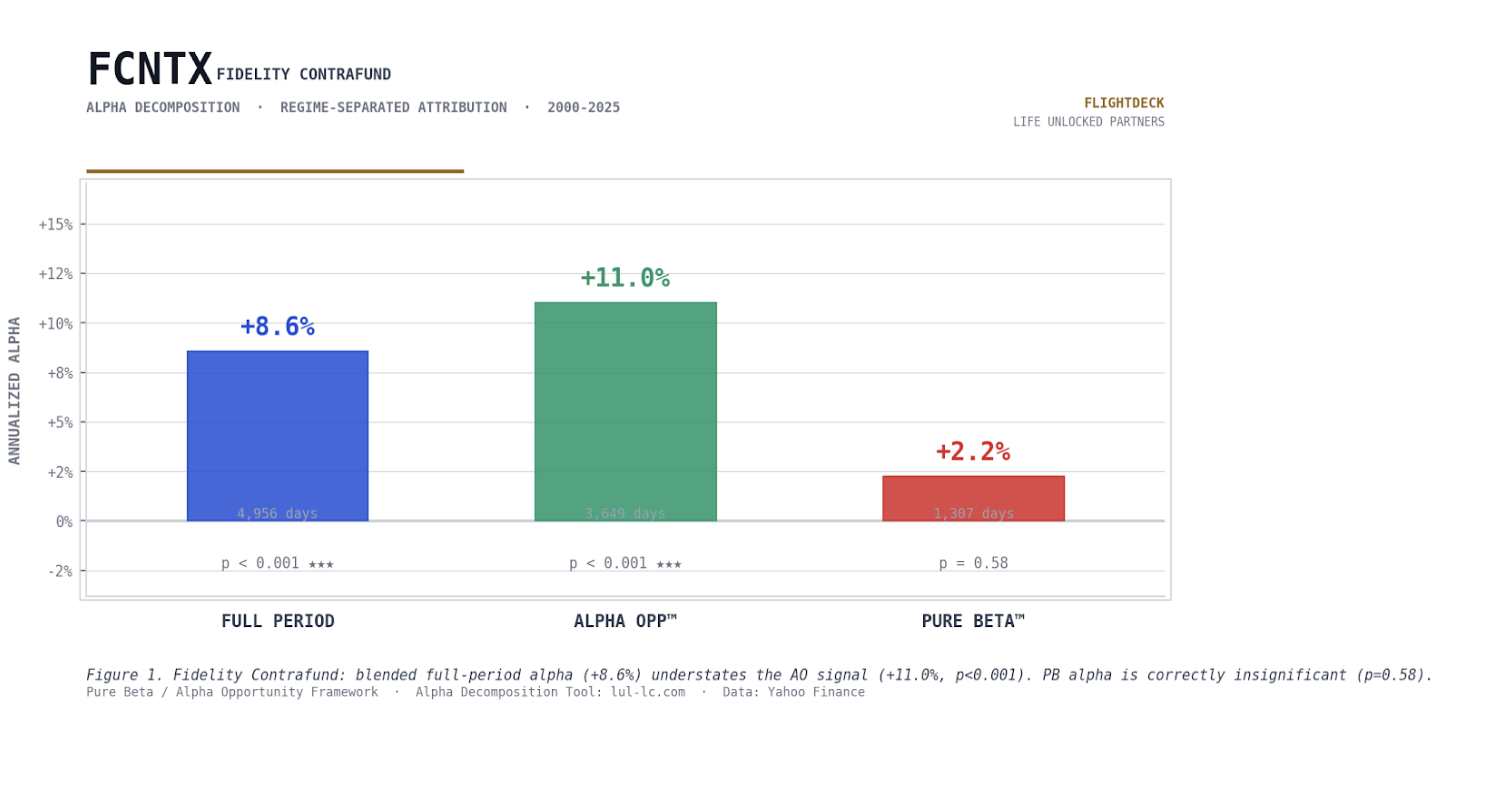
While what we are seeing are genuinely different measurement environments, the evaluation calendar does not make the same distinction today. Instead, both days are averaged together into a muddy number. The below graphic showing analysis of the performance of the Fidelity Contrafund makes the gap concrete:
Where the Threshold Comes From (Not From Us)
The natural question is where we draw the line between the two environments. We want to be precise about the answer, because it matters: We did not draw it. The VIX did.
The VIX represents the market's own expectation of near-term volatility, expressed as an annualized figure. Converting it to a daily expected move is straightforward: Divide the VIX by the square root of 252. At the long-run historical average VIX of 16, the math produces a daily expected move of approximately 1%. Days when SPY moves more than 1% in absolute terms are above-normal stress days by construction, not by our definition.
We call these pure beta days. The remaining 72.2% of trading days, when moves are within the normal expected range and correlation has room to stay low, are called alpha opportunity days. Over 6,537 trading days from 2000 through 2025, about 27% fall into the pure beta category. That 27% is sitting in every trailing return anyone’s ever used to evaluate an active manager, quietly diluting the signal. Over a standard three-year evaluation window, that is nearly 200 trading days contributing noise to a signal we're trying to read clearly.
What the Mixed Number Actually Tells You
Picture a genuinely skilled manager running through a twelve-month stretch that happens to be loaded with pure beta days: a meaningful correction, a few macro scares, some 2% and 3% sessions. Their alpha opportunity alpha, the part that reflects actual security selection, gets averaged together with near-zero contribution from the pure beta days where nobody could add measurable alpha because of all the beta noise. The blended trailing return mixes signal and mud in proportions we can’t see without separating them.
If that same stretch happened to punish the sector tilts a manager carries, the blended number looks bad. If a competing manager happened to benefit from those same macro moves for reasons unrelated to stock picking, their blended number looks good. The committee compares the two and makes a decision that feels rigorous because it is based on data. Except that when we use unclean data, we may not get a clear answer to the question being asked.
The framework cuts both ways. Genuinely unskilled managers show near-zero alpha on alpha opportunity days. That signal is consistent and hard to hide once you separate the regimes.
The Crisis Skill Mirage
There is one more piece of arithmetic worth understanding. Some active funds appear to generate alpha specifically on high-stress, negative pure beta days. What looks like crisis management skill is just beta expressing itself.
Lower-beta managers mechanically outperform their predicted return (based on a constant beta) on large down days because their actual behavior during stress is more defensive than their full-sample average implies. What looked like skill during the drawdown was really just a less aggressive portfolio doing less damage — a reasonable thing to prefer but a different thing to reward.
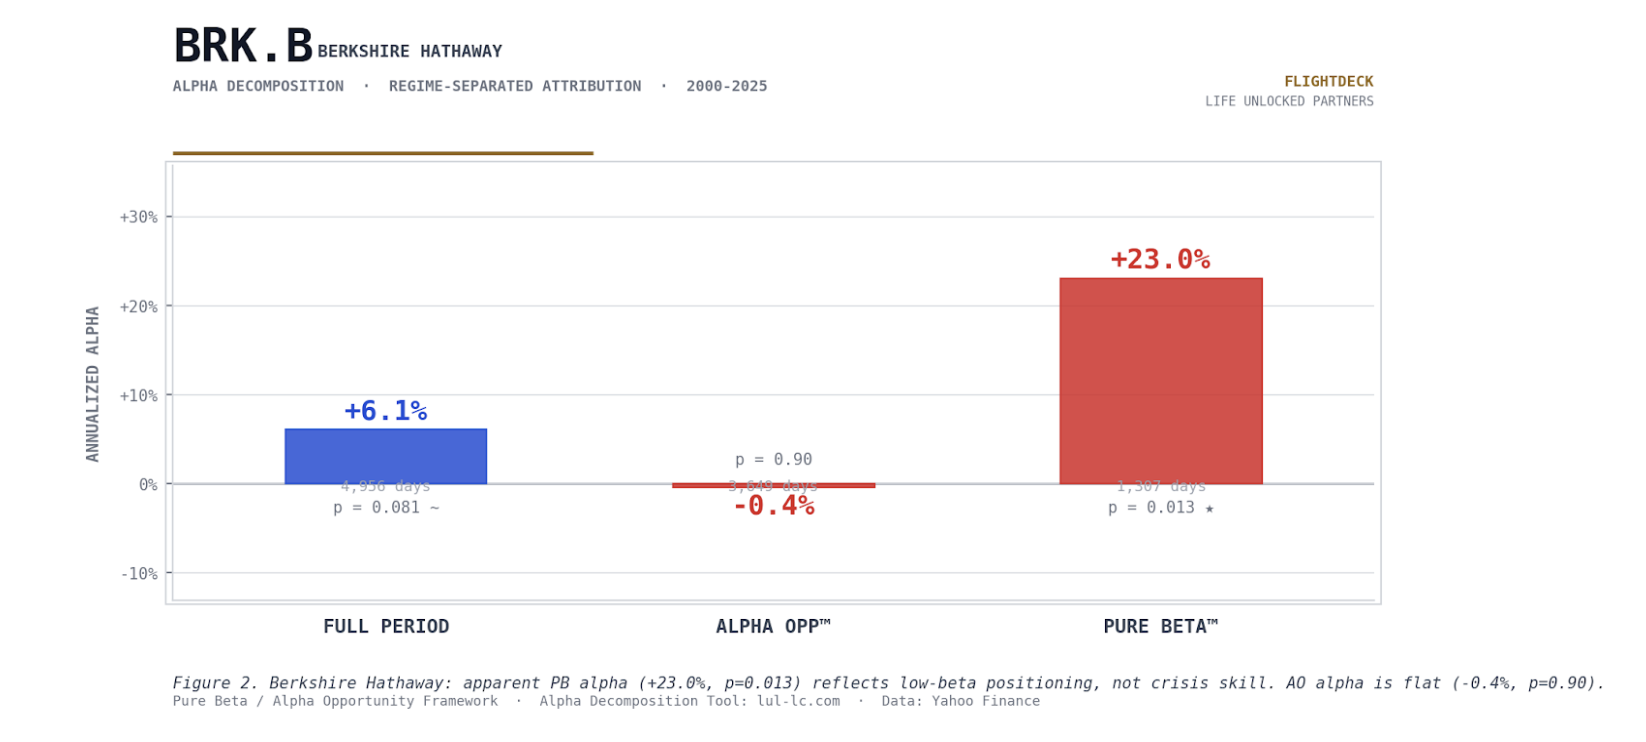
Alpha opportunity alpha, measured on the days when market conditions actually permit stock selection to register, is the cleaner signal for measuring what anyone hires a manager to do. BRK.B is a useful illustration precisely because it is widely held as an equity position by active managers. At the same time, it functions as a holding company with large insurance operations, a structure that naturally produces low beta. The framework reveals exactly what that structural low beta is doing to apparent crisis-period alpha:
A Different Committee Conversation
Once we separate the regimes, the evaluation conversation changes in a useful way. A manager who underperformed last year during a high-correlation stretch but shows consistent alpha opportunity alpha over three years is demonstrating something specific: They can do the job when conditions allow, and conditions did not allow it much last year. That is a retention argument. A manager who shows weak alpha opportunity alpha across three years and a high-stress period that happened to cut in their favor is demonstrating something different. That is an exit argument.
Separating beta-dominated days from true stock-selection environments doesn’t make investment decisions easier. It makes the signal clearer.
The regime classification framework is derived from VIX mathematics, not from any specific portfolio’s return history. While it cannot tell us which managers to hire, it specifies the days on which they should be measured.
The framework is currently under peer review at a practitioner journal and can be accessed at lul-lc.com.
Mark Tennenbaum is CEO of Life UnLocked Partners, a registered investment advisor. He holds an MBA from UCLA Anderson and a psychology degree from Pitzer College, where his studies included brain evolution and behavior. He has 40 years of experience in securities valuation, M&A, and structured products.
* * *
Disclosures
This publication is provided by Life UnLocked Partners LLC ("LUL"), a registered investment advisor. The content is for educational and informational purposes only and does not constitute investment advice, a recommendation, or a solicitation to buy or sell any security. Nothing in this publication should be interpreted as a recommendation to purchase, sell, or hold any particular investment or security, or to employ any particular investment strategy. The analytical framework, tools, and methodologies discussed herein are presented for educational purposes. They are not designed or intended to be used as stock-picking devices, trading signals, or the basis for any investment decision. Past performance, whether of the framework, any fund, or any strategy referenced, is not indicative of future results. All investments involve risk, including the possible loss of principal. The information presented is based on data and analysis believed to be reliable, but LUL makes no representation or warranty as to its accuracy, completeness, or timeliness. Market conditions, economic factors, and individual circumstances vary, and outcomes may differ materially from any examples or historical patterns discussed. LUL is registered as an investment advisor with the California Department of Financial Protection and Innovation (DFPI). Registration does not imply a particular level of skill or training, nor does it constitute an endorsement by any regulatory authority. For more information about Life UnLocked Partners LLC, including our advisory services, fees, and business practices, please refer to our Form ADV, available through the SEC's Investment Adviser Public Disclosure website at adviserinfo.sec.gov. This publication does not create an advisory relationship between LUL and any reader. Readers should consult their own financial advisor, tax professional, or legal counsel before making any investment decisions.
A message from Advisor Perspectives and VettaFi: Discover something new! Click here to register for our upcoming webcasts.
Read more articles by Mark Tennenbaum
 Most of us know this story too well: lagging returns on the screen, the benchmark comparison looking difficult, and the committee asking increasingly pointed questions about a manager whose thesis made sense 18 months ago. Next, a member moves to make a change based on blended data that obscures more than it reveals, and a manager is gone.