During and immediately after the financial crisis of 2008, there was much talk and academic research about the rapid growth of the US financial sector over the preceding decades and whether that was good or bad. Since then, finance’s growth relative to the rest of the economy has slowed to a crawl, although its share of gross domestic product remains quite high by historical and international standards, and if this week’s earnings reports are any indication, it is on track to inch a little higher. So is that good or bad?
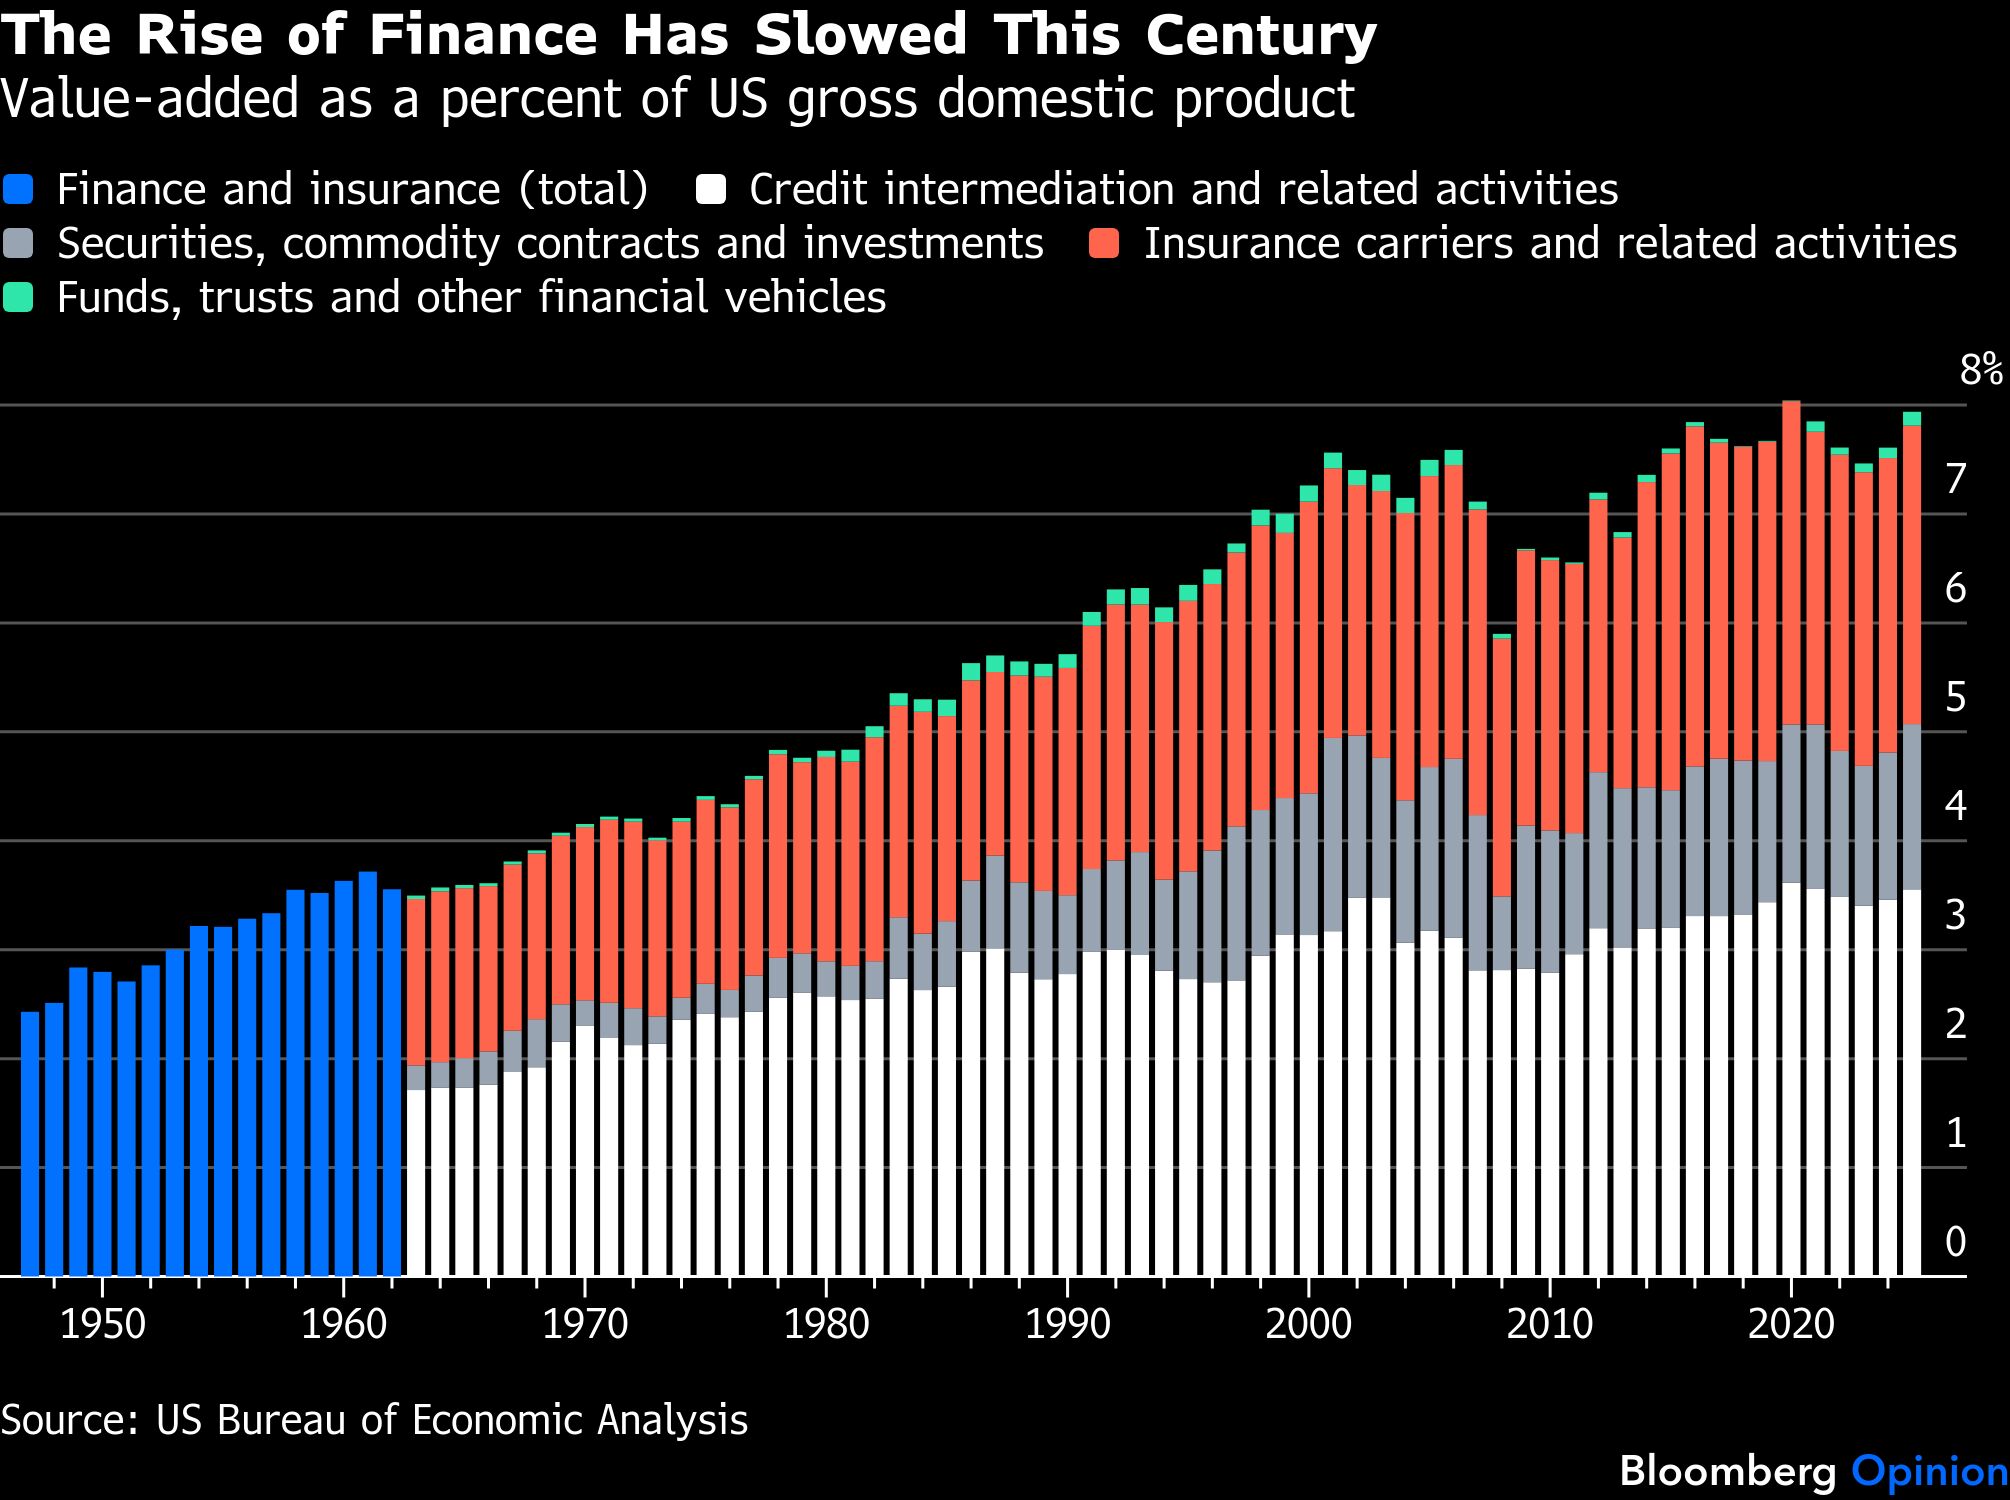
Value-added is how the US Bureau of Economic Analysis and statistics agencies in other countries measure an industry’s contribution to GDP. It’s the output of that industry minus the goods and services it buys or, expressed differently, profits plus employee compensation plus taxes. In 2025, the combined value-added of the finance and insurance industries was 7.9% of US GDP, just below the record of 8% set in the Covid-19 pandemic year of 2020 — albeit not all that much higher than the 7.6% share recorded in 2001 and 2006.
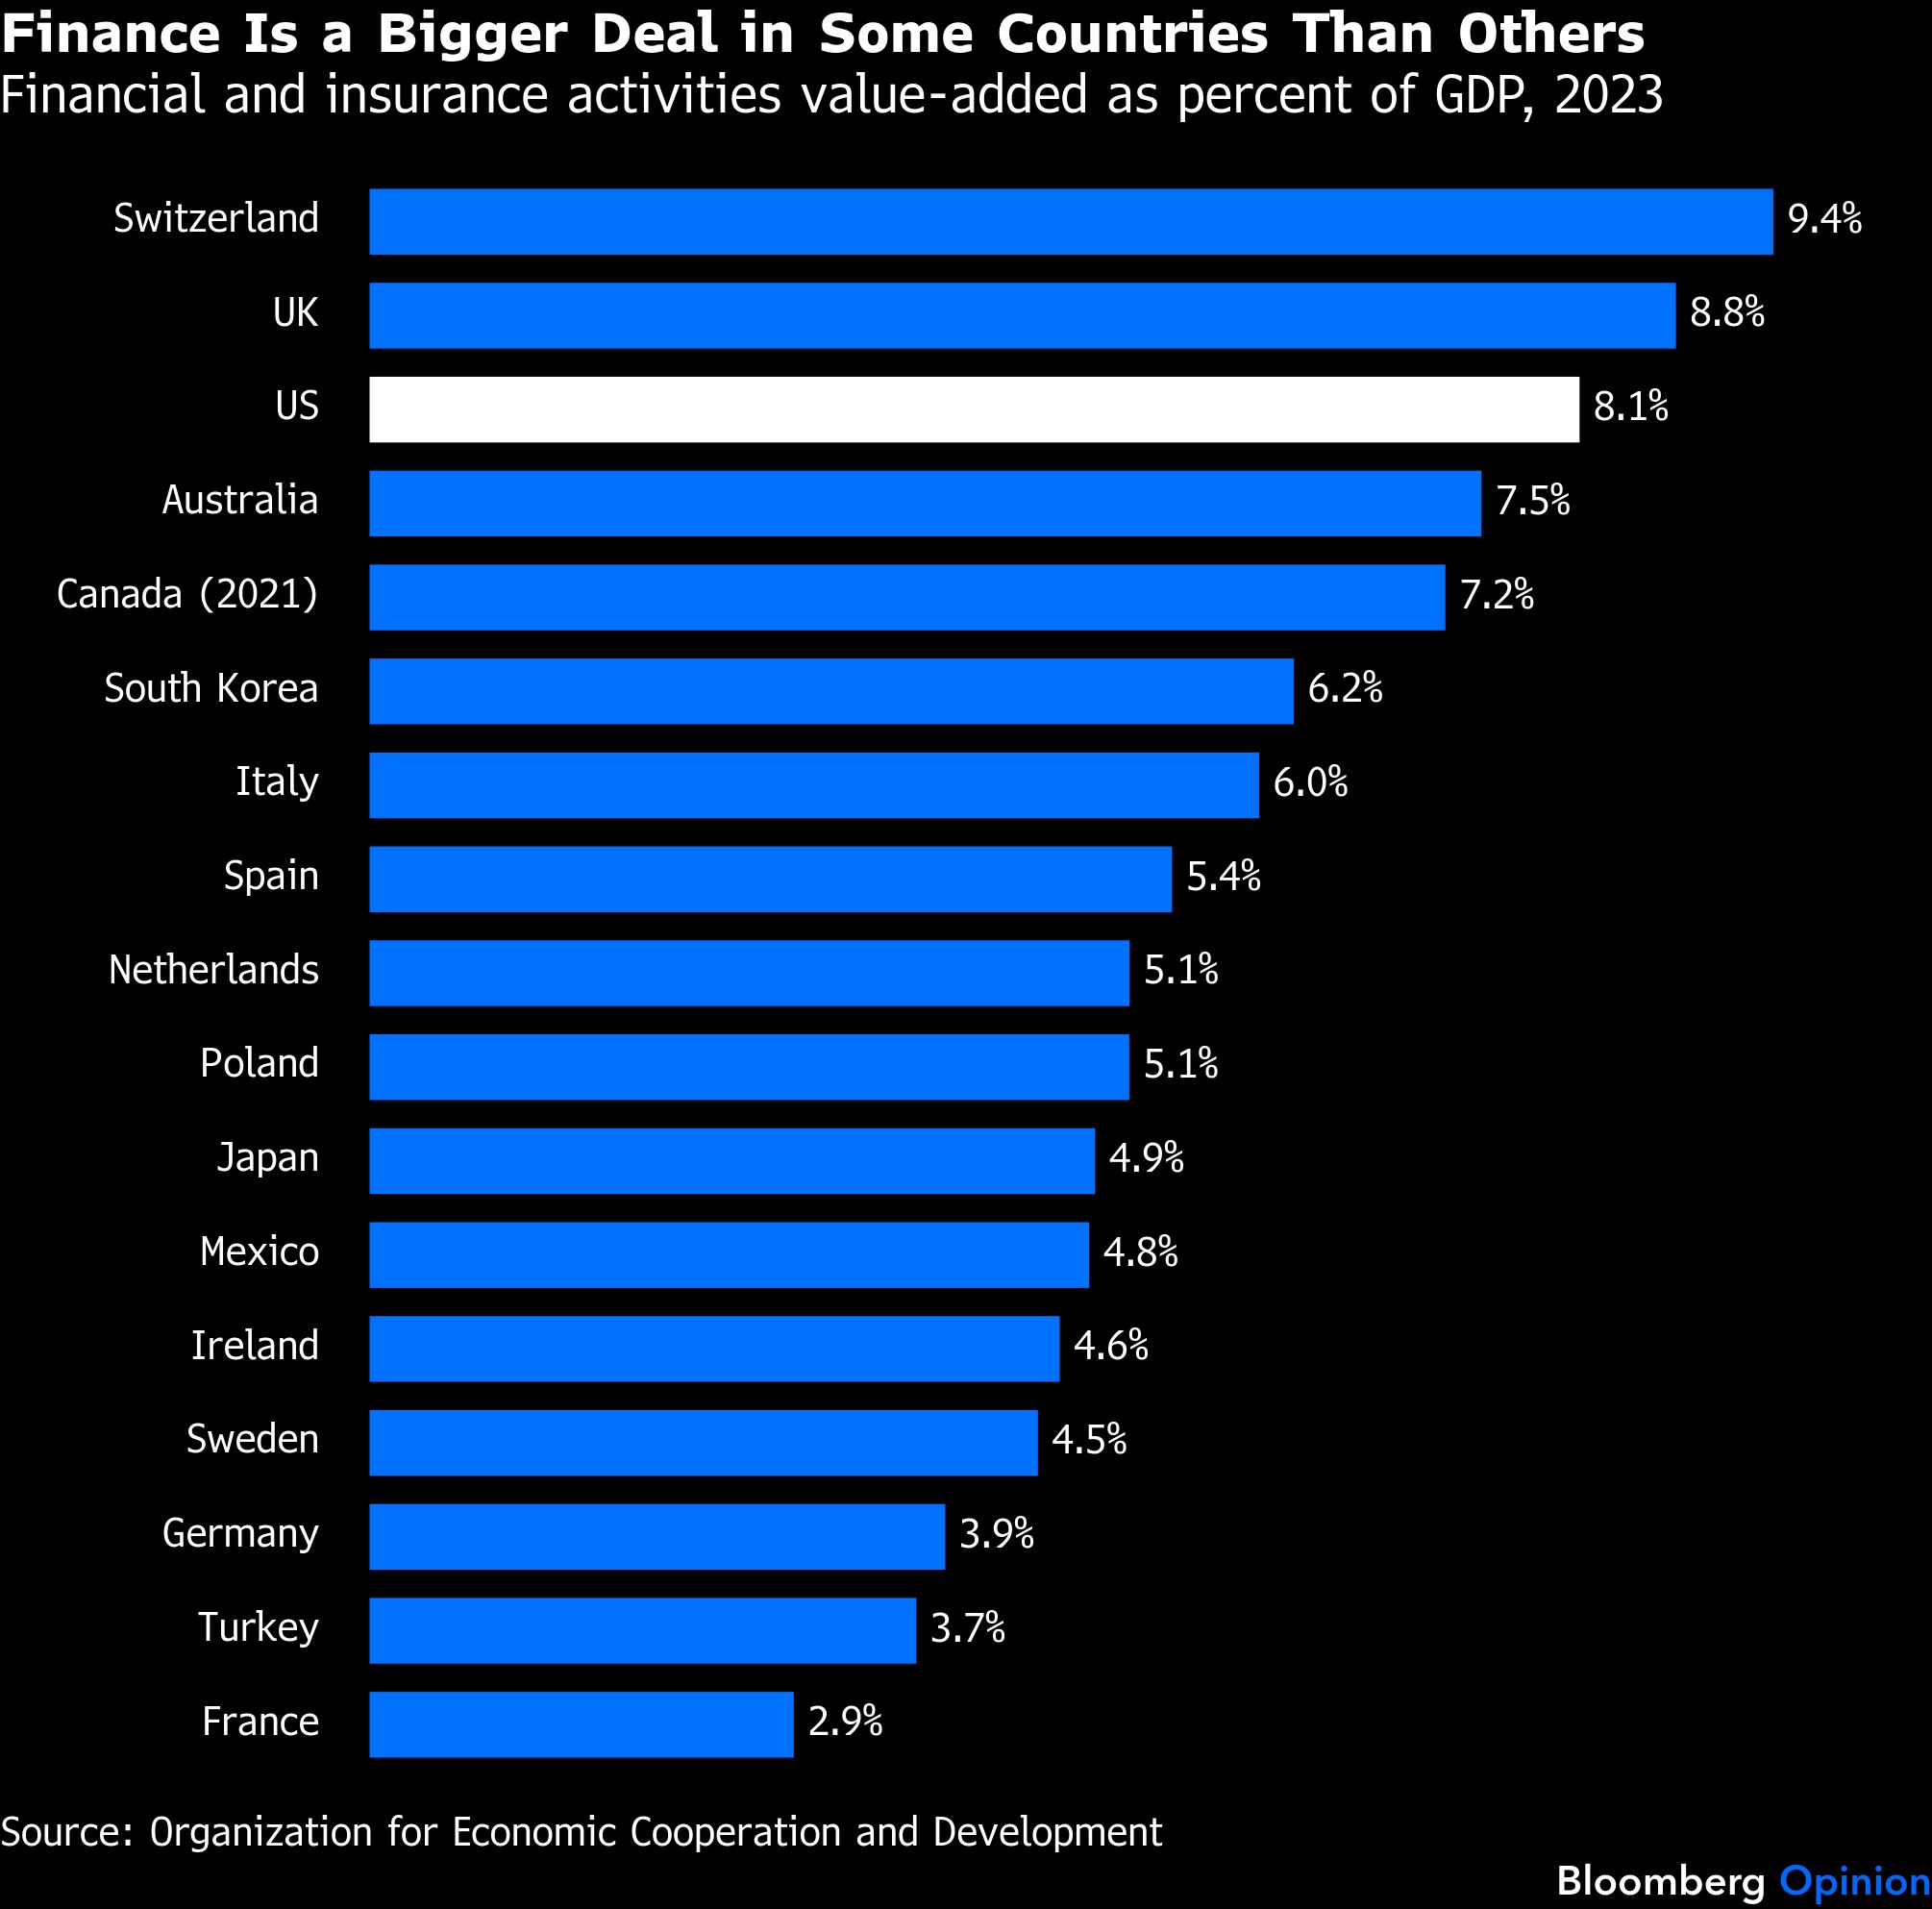
Estimates from the Organization for Economic Cooperation and Development for 2023 that are slightly different from the BEA’s show the US finance and insurance share to be high relative to other countries as well. The two nations shown here where it plays an even bigger economic role, the UK and Switzerland, attract a lot of their financial business from abroad. (A more extreme case is tiny Luxembourg, with a 24.5% finance and insurance share, which I chose to leave off the chart because it would have made it hard to read the rest.)
Obviously financial sectors are useful, and the general tilt of economic research has been that financial development enables economic development, and countries with better-developed financial sectors outperform those with less-developed ones. But a lot of the things financiers do strike many people as dodgy and mostly self-enriching — witness the recent New York Times essay headlined “The Finance Industry Is a Grift. Let’s Start Treating It That Way,” by heterodox conservative economic thinker Oren Cass — and in the wake of the financial crisis even lots of mainstream economists wondered whether financial development had passed the point of diminishing returns in the US.
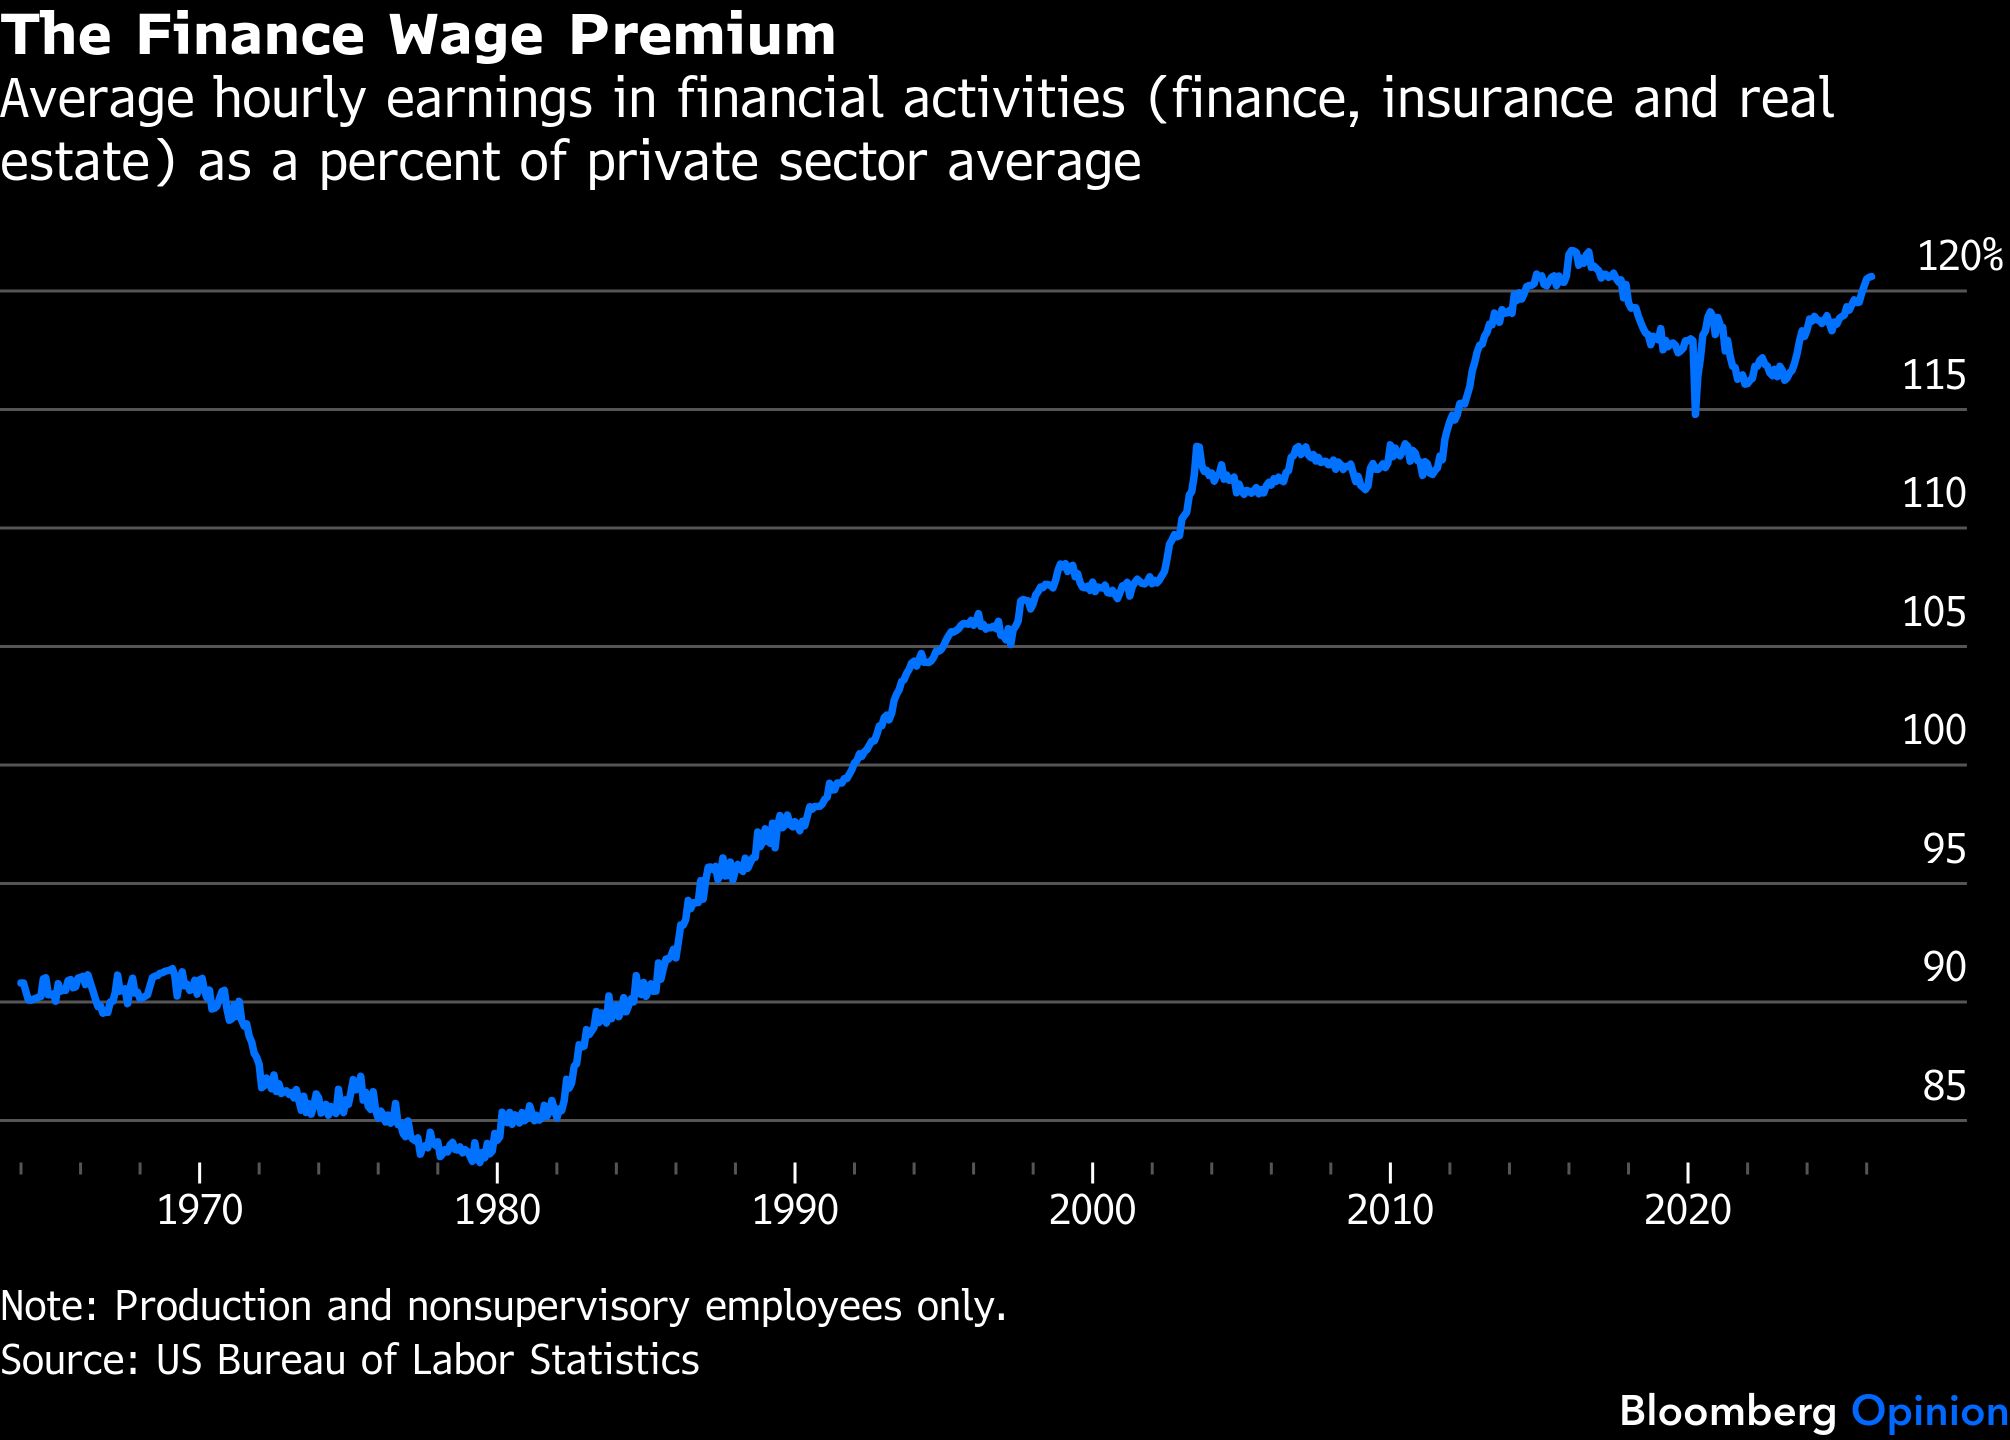
After reading — in some cases rereading — a lot of that research, I do not feel any closer to knowing how much finance is too much. But there were some interesting findings. The one that received the most attention at the time (although it wasn’t published in a journal until 2012, the paper began to circulate in early 2009) was the conclusion of Thomas Philippon of New York University and Ariell Reshef of the University of Virginia, who has since moved to the Paris School of Economics, that financial workers were paid 30% to 50% more than those with similar skills and employment risks in other sectors. Measuring whether that’s still the case is an exercise beyond the resources of this column, but a quick look at earnings for workers in finance and real estate relative to those in the private sector overall reveal a flattening over the past decade — which followed a big increase in relative earnings just after the financial crisis.
Another interesting Philippon finding (published in 2015) was that the cost of financial intermediation in the US had been close to 2% of assets for more than a century and had shown no signs of falling “despite advances in information technology and despite changes in the organization of the finance industry.” When he updated this research in 2020, however, Philippon did see evidence that fintech advances such as robo-advising might finally be putting some downward pressure on costs.
The plateau in finance’s share of GDP can thus perhaps be seen as the result of continuing competition between innovations that reduce costs (less than 20% of US mutual fund and exchange-traded fund assets were passively managed in 2006; now it’s 54%) and innovations that consist mainly of new ways to separate customers from their money (prediction markets would seem to fit that bill). With the caveat that I still have no real idea of what finance’s share of GDP should be, that sort of standoff seems better than continued increases in finance’s share.
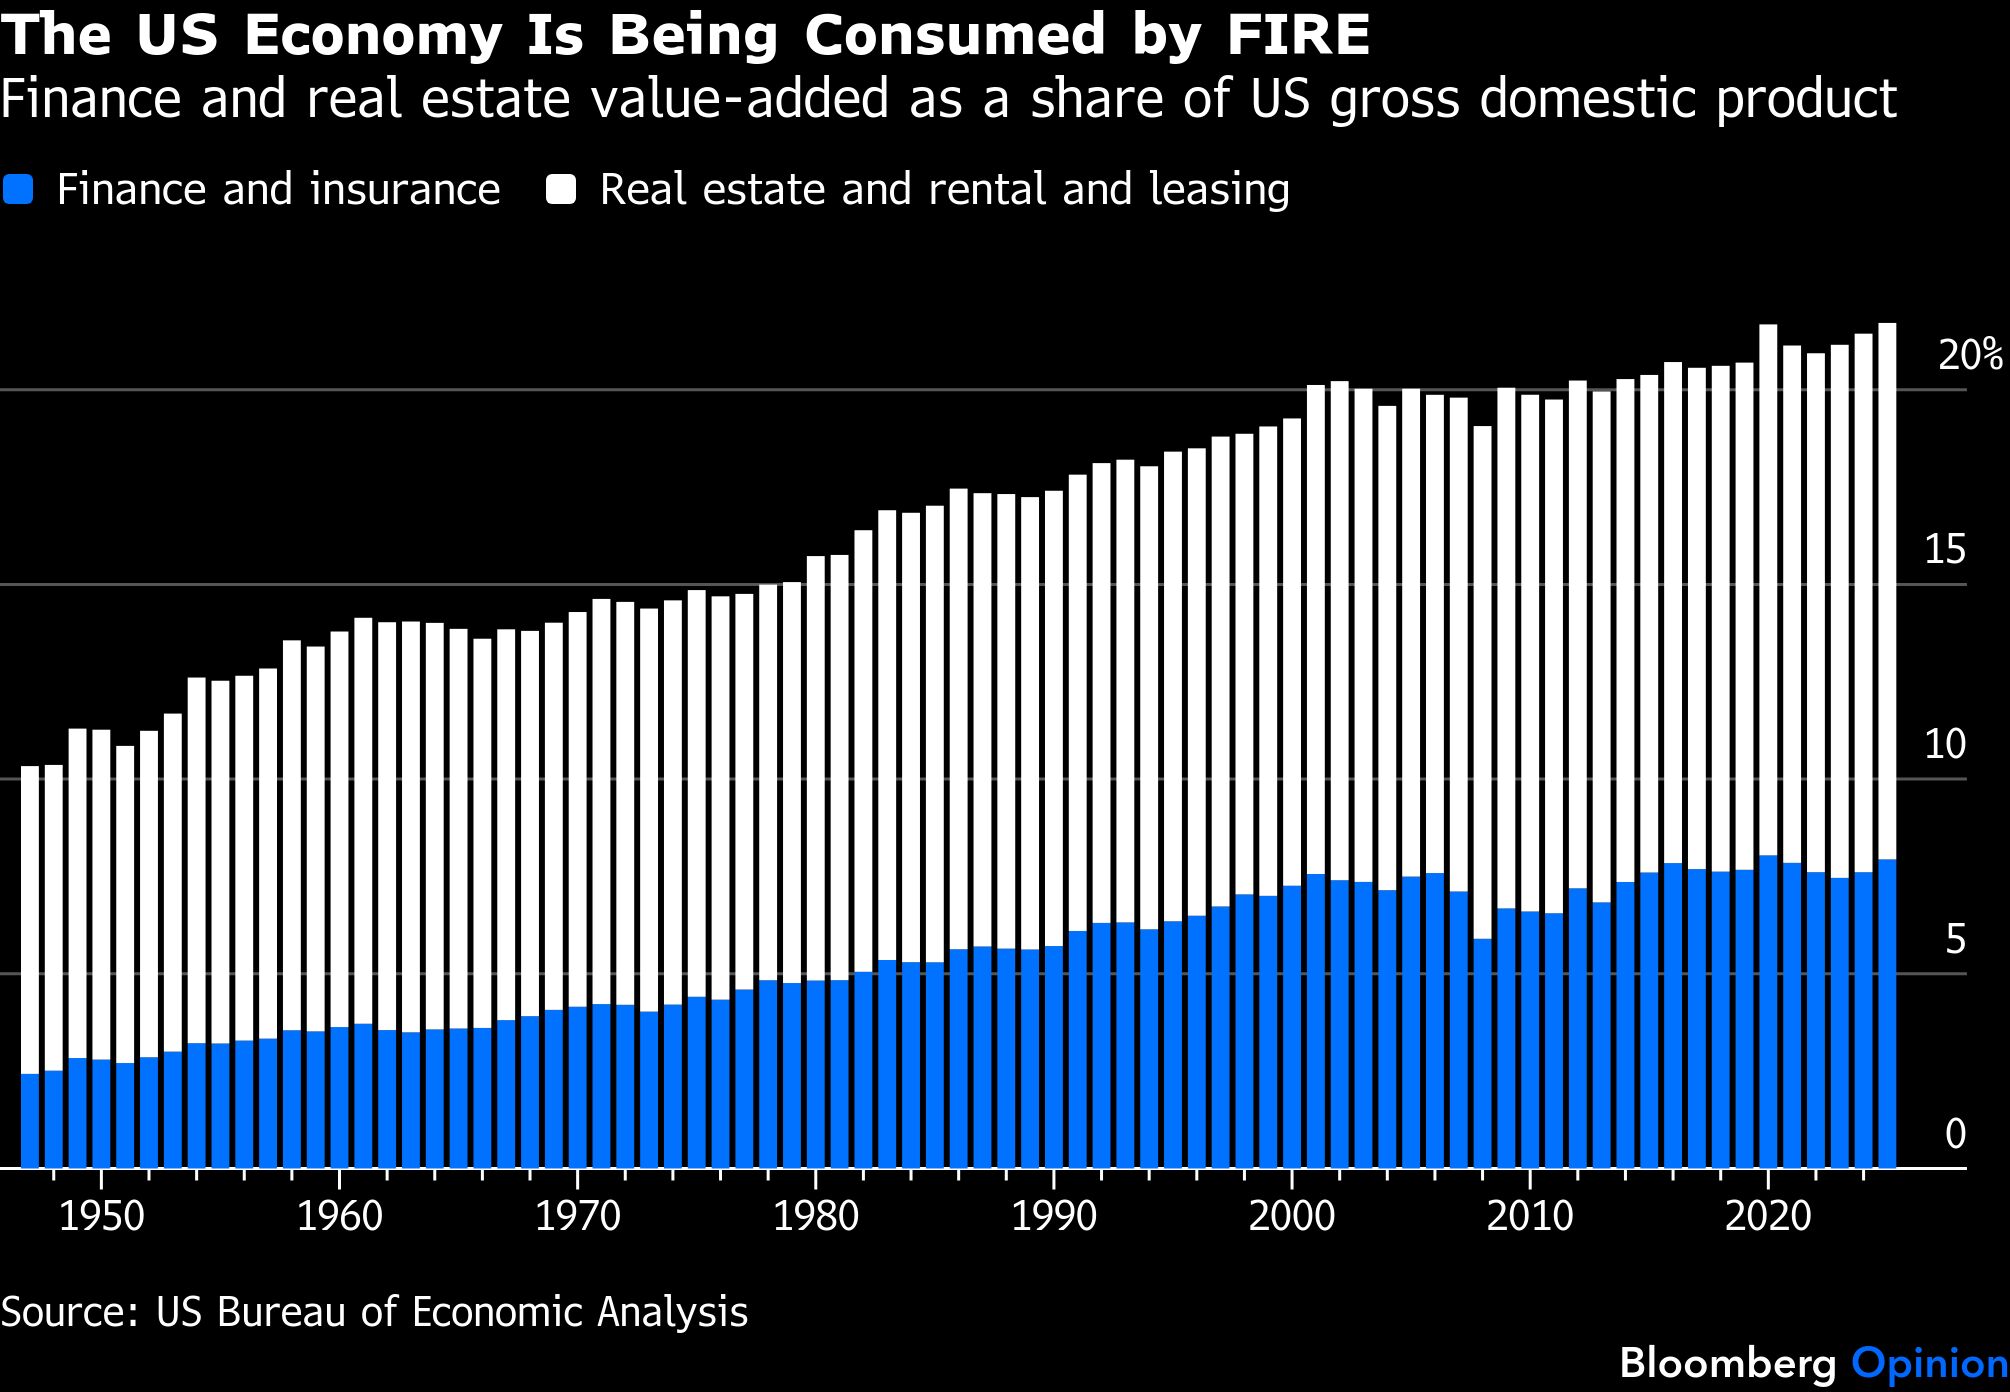
In the above wage chart, finance and real estate are combined because that was the only way to get numbers from before 1990. The two sectors are related, of course, and in the 2000s were often discussed in the same breath, usually by the acronym FIRE. FIRE’s share of GDP actually fell slightly in the 2000s before and during the financial crisis but has risen steadily since. Its 2025 share was a record, if you take things out to two decimal points, and is closing in on a whopping 22% of US economic activity.
A breakdown of real estate’s value-added into housing and nonresidential real estate is available back to 1997 and shows increases in the share of GDP since then and since just before the financial crisis for both, with the nonresidential increase a bit bigger. Since the pandemic it’s been all housing, though, with the struggles of the office sector driving nonresidential’s GDP share down slightly. Most housing value-added consists of what is best known in another context (the calculation of inflation) as owners’ equivalent rent, an estimate of what homeowners would be paying for their dwellings if they were renters. So basically what we’re seeing here is that housing has just kept getting more expensive. I don’t think that’s a good thing.
A message from Advisor Perspectives and VettaFi: Discover something new! Click here to register for our upcoming webcasts.
Bloomberg News provided this article. For more articles like this please visit
bloomberg.com.