Money Illusion — A User’s Manual
Membership required
Membership is now required to use this feature. To learn more:
View Membership Benefits The views presented here do not necessarily represent those of Advisor Perspectives.
You know the term “Money Illusion”: mistakenly believing that today’s dollars have the same purchasing power as the dollars of ten years ago. Or twenty. Or whenever you got your first job.
As with any illusion, fake replaces real, image supplants fact, and fog obscures truth. We’re here to help you sort it out.
Money illusion in today’s world comes in three flavors: prices, wages, and retirement savings. Price money illusion makes the $100 airport taxi ride seem expensive. Wage money illusion mistakes a $100,000 salary for high wages. Retirement money illusion lulls you into supposing you can retire once your projected 401(k) balance crosses $1 million.
When Did Money Start to Lose Value?
Around 1896. It’s been pretty much all downhill ever since, currency in your pocket buying less and less in the store. Wages going up, up, up — but never making you rich. More dollars saved, with less to show for it.
On to the user’s manual. Let’s work our way back to 1896 in stages. How far do you have to go for $100 today to have the same purchasing power as $50? In other words, the purchasing power of one dollar has been cut in half since what year? We’ll stop the halving at the fifth iteration in 1915 and then show the value for 1896.
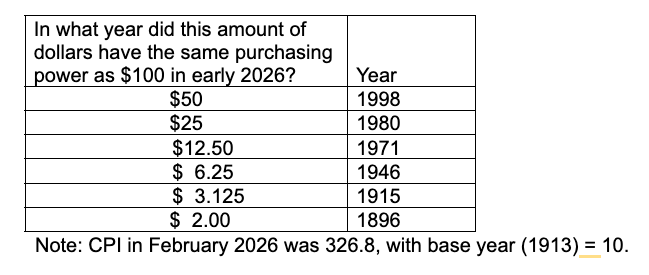
Yep. A dollar has lost 98% of its purchasing power since William McKinley ran for President.
First came the wartime inflation of World War I: 35% in 1915, 25% in 1918. Then more in World War II: 10% in 1941, 18% in 1946. And yet more: After a long reprieve in the 1950s and early 1960s, the infamous inflation of the 1970s roared ahead, peaking at 13% in 1979. But inflation didn’t stop there. As recently as 1998, $50 could buy what costs $100 today.
And now you know why those old comic books you found in a chest in your elderly uncle’s attic—full size, four-color, 16 pages—have 5₵ emblazoned on the cover, or why his younger brother goes on about the five-cent candy bars of his youth. Back in the day, a nickel was good money.
If you are reading this a year from now, or just want to play around with the numbers your own way, go to FRED and search for CPIAUCNS. That series stops in 1913, but Robert Shiller spliced an earlier series into it, taking the record of price changes back as far as 1871.
Wage Money Illusion
It’s the same question with wage money: How many years back do you have to go until a wage of $50,000 puts you in the same place on the salary leaderboard as $100,000 does today? And how much further for a wage of $25,000 to be the $100,000 of that day?
Note how we changed the standard: Not purchasing power, but your position relative to other wage earners. Wages typically rise faster than prices—over the long haul, about 1% faster. (It’s called productivity.)
It won’t work to deflate your current wage of $100,000 using the Consumer Price Index. If your wages have kept up with the average national salary, you have more purchasing power now than years ago. Your current $100,000 wage puts you about the 77th percentile among 2024 wage earners. (Wage data is updated more slowly, hence “2024” not “2026.”)
Yeah, not the 90th percentile. Certainly not the 99th. You’re gonna have to earn a lot more than $100K if you want to join the one percent.
For this calculation, we go to the Social Security Administration, which has a mandate to track the average national wage to set FICA taxes and subsequent benefits. To follow along at home, go to Social Security’s National Average Wage Index page
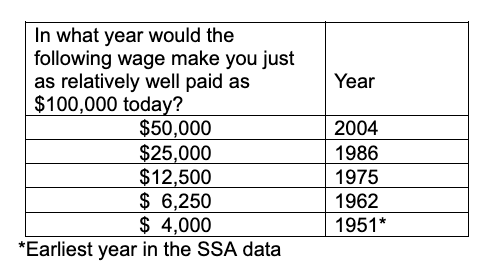
So, don’t look down on your ancient grandpa when he brags about pulling down a salary of $5,000 in 1951. That’s the equivalent of $125,000 in wages today. We trust you, ah, make rather more. Tease the old fellow by telling him your salary. Courtesy of money illusion, this will confirm his intuition that each and every one of his grandchildren is hot stuff.
About That Million Dollar 401(k) Balance…
If your portfolio grows faster than prices — you earn a real return — the dates in Table 1 won’t help to calibrate the true worth of your 401(k). If you’ve invested in the broad economy through an index fund, the dates in Table 2 don’t help either — not all the benefits of productivity flow to labor, some go to capital.
Our third series will use share of Gross Domestic Product. Dollars across centuries are squishy. After all, how do you compare the economic clout of your DoorDash and Spotify outlays to your great-great-grandpa’s on saddles and tickets to the local opera, in a world without record albums, let alone streaming music?
A while back, the editors at Fortune magazine hit on an ingenious solution: Express dollar wealth as a share of GDP at the time. Obviously, wealth of $2 billion in a $100 billion economy reflects a rather more dominant position than $100 billion in today’s almost $30 trillion economy. Your account balance divided by GDP supplies a ruler suitable for comparing wealth today to wealth a century ago.
Presently, GDP runs about $29.2 trillion. So, your $1 million 401(k), expressed as a percentage of GDP… has too many decimal places for a family publication. Bear with us, we did the math offline. Same rubric as before: How far back would you have to go before, say, a $333,000 401(k) was just as big, in that economy, as your million dollar 401(k) today?
U.S. GDP has been growing more or less continuously, with the occasional hiccup, since the birth of the republic, and faster than prices or wages. As a result, we can push the numbers a little lower than in either of the previous examples. This time we’ll divide (roughly) by three.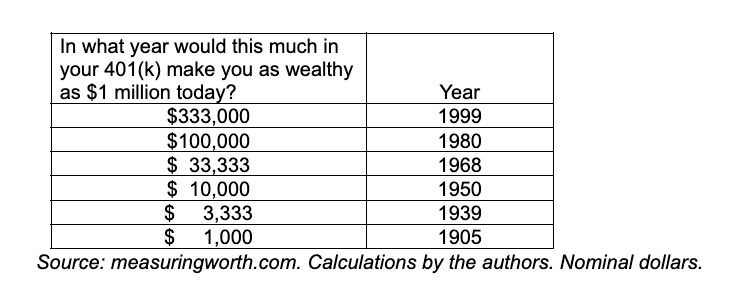
As you can see, $1 million today is just a tiny piece of the economy, corresponding to much smaller dollar amounts 20, 50, or 100 years ago, when the economy was also smaller.
Fight the Money Illusion!
This has been a Public Service Announcement. We regret to inform young people — largely ignorant of history — that their $100K salary makes them no less a wage slave than their great-grandparents in the sweatshop. For the old and cranky, we have explained why that $100 airport taxi ride is not outrageous.
And for those approaching retirement, we help put your 401(k) in perspective. Stop thinking of yourself as a millionaire — it’s just not helpful. But good on you for putting aside the equivalent of some thousands of 1950s-era dollars. You’ll need them.
Money Illusion in Practice: Your Social Security Benefit
And the next time you read that “no couple should receive more than $100,000 in Social Security benefits,” blow them a raspberry.
Sure, no couple should receive more Social Security than a few thousands of dollars in 1950s-era wage equivalents. Right. Too bad about you showing up for work every day for 35 years, paying taxes all the while, and expecting to earn a benefit in proportion to your earnings.
By the way, the maximum wage subject to FICA taxes in 2026 is $184,500. In 20 years, perhaps when you retire, at 4% wage growth that will be $404,250 (assuming the cap isn’t sacrificed for the greater good of preserving Social Security.)
The proposed $100K limit on Social Security benefits shows the Committee for a Responsible Federal Budget to be one more victim of money illusion.
How to Rewire Your Brain Around the Money Illusion
- Burn that 326.8 CPI value from early 2026 into memory. Check it from time to time when you spend on something different or unusual — like a taxi to Manhattan from JFK. Suppose it’s 2029, with CPI up to 360 & taxi ride up to $110 from $100? All good, situation normal — nothing to see here, folks. Just ongoing inflation of a bit more than 3% per year, the average over the past 100 years.
- Your salary here in 2026 is $100,000 when the max FICA wage is $184,500? That’s a ratio of 54.2%. Check in occasionally — compare your future salary ($125K? $140K?) to the then-FICA limit. If it’s more than 54%? Good news, you are getting ahead. Less? Face the fact that you are falling behind.
- If you have a million dollars in your retirement accounts today, that gives you a 1/29,200,000 share of current GDP. A few years from now, when your 401(k) is worth $1.5 million, check the GDP for that year at measuringworth.com to see if you are keeping up or falling behind.
And finally, for God’s sake, learn to think in real dollars and real returns. Projecting your retirement savings using 9% nominal stock returns and 4% nominal bond returns will rot your brain and lead you down the garden path to a Motel 6 and Greyhound Bus retirement. Give those expected returns the haircut they deserve: 5%–6% real for stocks (maybe), and 1% for short to intermediate bonds.
And finally, track the yields of Treasury Inflation Securities — not plain-vanilla ones — to get a sense of what your savings really earn. We check this page every afternoon.
1 Over the course of the 19th century the dollar had, very irregularly, almost doubled its purchasing power, until the peak in 1896.
Edward F. McQuarrie, Ph.D., is professor emeritus at Santa Clara University. He writes about financial history and its implications for retirement planning. His paper, “The 4% Rule Was Never Failproof,” won the 2026 Journal Research award from the Investments & Wealth Institute. Working papers describing his research can be downloaded here.
William J. Bernstein is a neurologist, the co-founder of Efficient Frontier Advisors, an investment management firm, and a writer with several titles on finance and economic history. He has contributed to the peer-reviewed finance literature and has written for several national publications, including Money Magazine and The Wall Street Journal. He has produced several finance titles, and four volumes of history, The Birth of Plenty, A Splendid Exchange, Masters of the Word, and The Delusions of Crowds about, respectively, the economic growth inflection of the early 19th century, the history of world trade, the effects of access to technology on human relations and politics, and financial and religious mass manias. He was also the 2017 winner of the James R. Vertin Award from the CFA Institute.
A message from Advisor Perspectives and VettaFi: Discover something new! Click here to register for our upcoming webcasts.
Membership required
Membership is now required to use this feature. To learn more:
View Membership Benefits