The official data will be released tomorrow, but if past trends continue, the US inflation rate will come in higher than most Americans are used to, but still relatively low. In May, the consumer price index rose 4.2% from a year earlier, while personal consumption expenditures increased 3.4%. To the extent these indicators are a way to take the economy’s vital signs, these numbers show a concern, but not a crisis.
But that’s not how many Americans see it. Satisfaction with the economy reached its lowest point ever in May, as measured by the University of Michigan’s consumer sentiment survey (June’s reading was the second-lowest). It’s notable that the index goes back to 1978, five decades that include an oil crisis, two stock market bubbles, a pandemic and six recessions — and yet, Americans still view today’s economy as the worst.
It’s not enough to say that Americans simply don’t know a good thing when they have it. Something is wrong in the economy, and economists can’t easily point to it — which is a clear indication that there’s something we aren’t measuring well. So let’s measure more.
One of the most useful measures to have would be price indices categorized by household type, rather than good or service, that would offer a portfolio of inflation estimates. This would be an easy lift with a lot of potential gain: The Bureau of Labor Statistics already collects a lot the data.
The BLS oversees the CPI, the consumer price index, which measures the change in the prices of roughly 100,000 goods and services each month. Those goods and services are weighted to produce an index that reflects a “market basket” of what consumers buy. The weights come from the BLS’s consumer expenditure survey, which tracks what Americans actually spend their money on. The BLS uses annual average spending patterns with a two-year lag, so the CPI’s current weights are based on average spending in 2024.
Right now, the BLS uses three baskets to make its monthly inflation estimates: one for all consumers, one for all urban consumers, and one for urban wage and clerical workers. That number should be expanded at least tenfold.
To start, each archetypal family type — single, married without children, married with children at home, married with children outside the home — should get a monthly basket. These can be further narrowed by gender, age, number of children, work status, income, whether they rent or own, and so on. There could child baskets, which would index the cost of things consumed by kids at various ages, from 0 to 18. Or how about a “common basket,” a price index for the 20 most commonly consumed goods or services in America?
The hard work is done; the big task in producing CPI each month is measuring the changes in the 100,000 goods and services. Creating more indices is just presenting that same data in more ways.
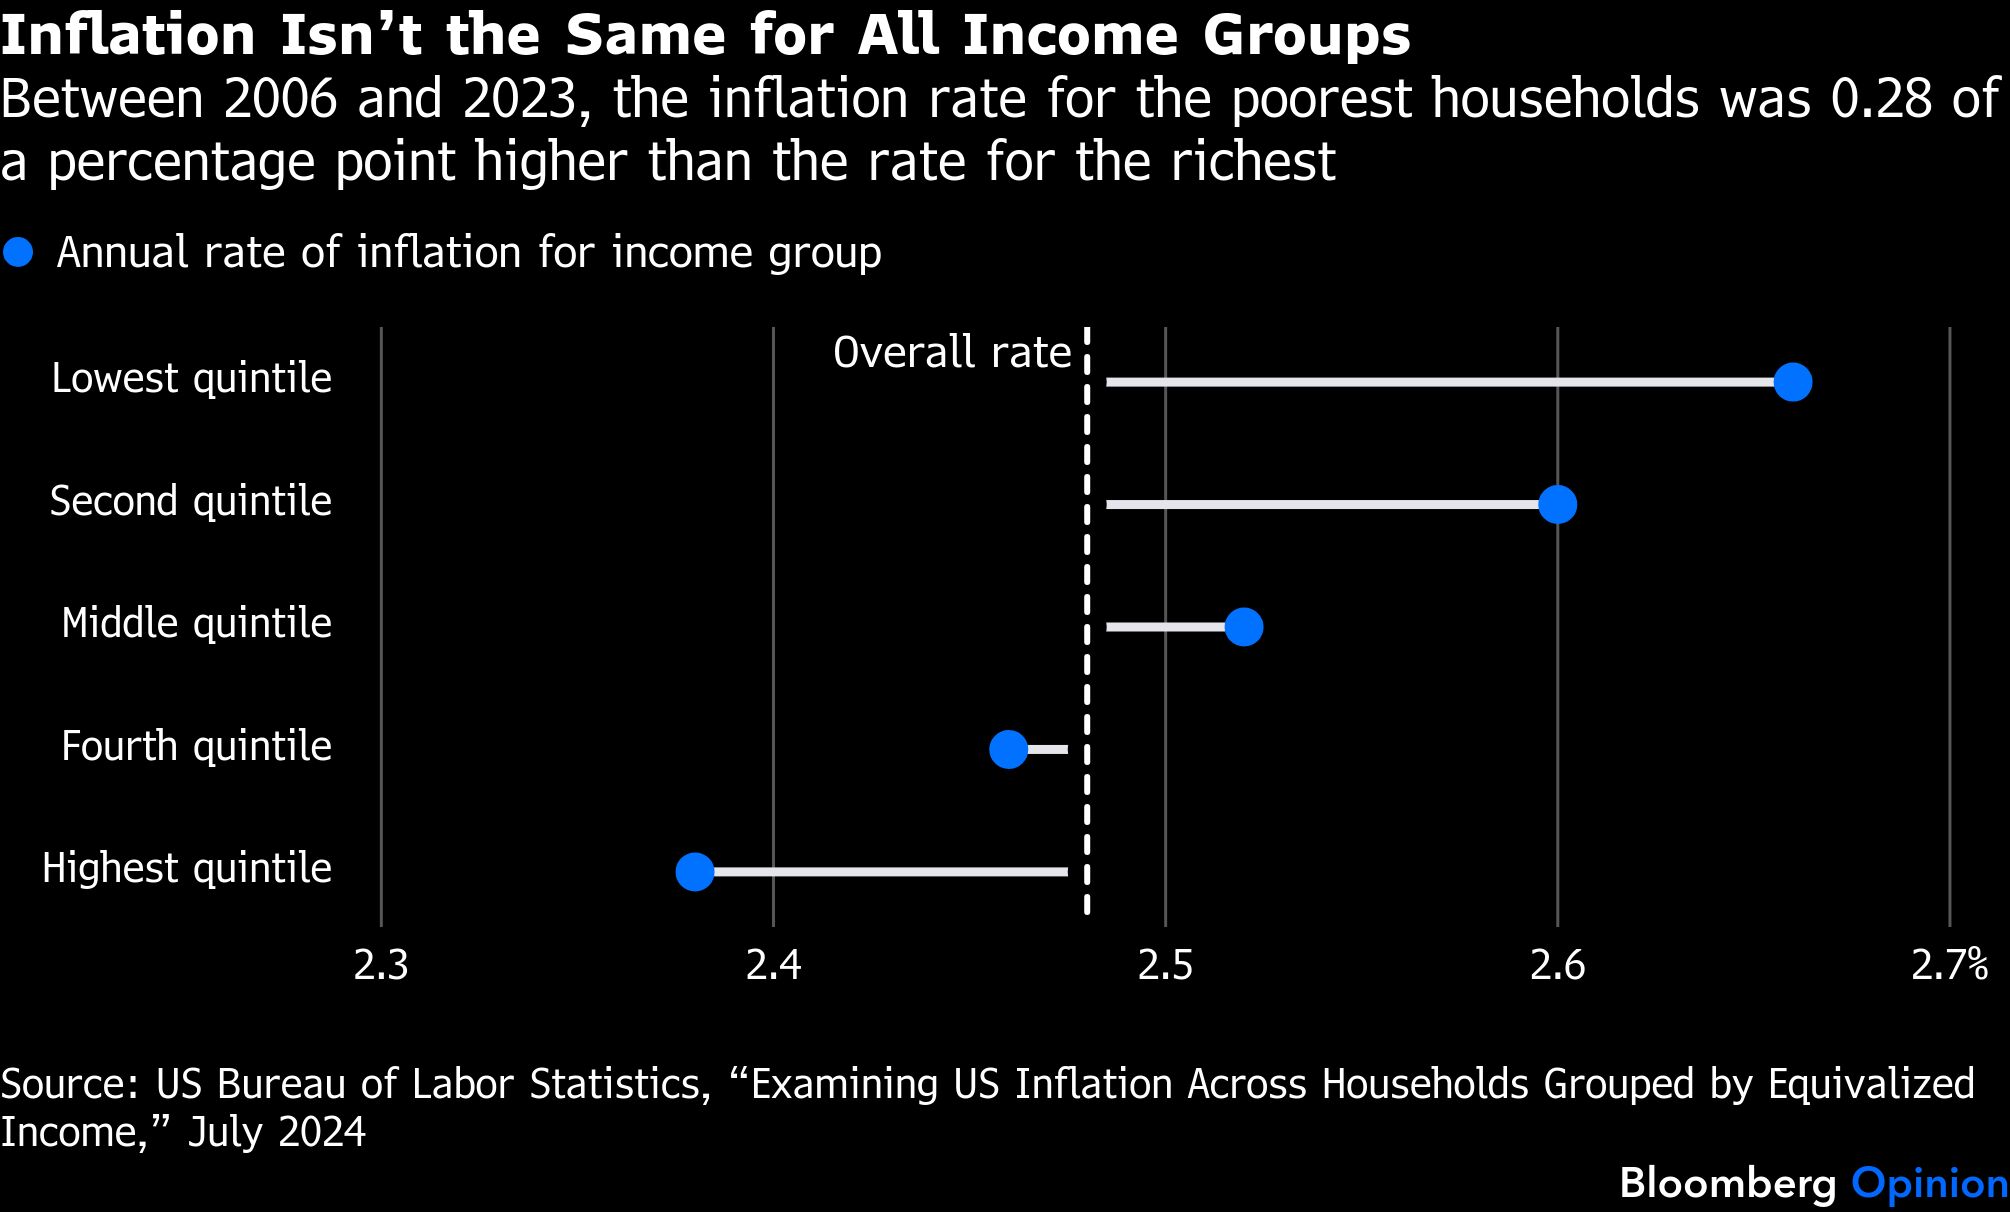
To a limited degree, the BLS does this already. A few years ago, some of the bureau’s economists compared inflation between 2006 and 2023 by income quintile. They used (a much more sophisticated version of) the process described here — weighting the measured monthly prices by expenditures of different groups within the economy. They found that the annual inflation rate for the lowest-income households was typically 0.28 points higher than for the highest quintile, which means the inflation gap between the two groups was 7.7 percentage points over the period covered by the study.

The BLS also has research series such as CPI for the elderly, CPI for new tenants, CPI without product-size changes, and CPI for specific income quintiles. These are produced less frequently than the monthly CPI, but more frequently than one-off research projects.
All these reports are eminently doable — with additional research staff and money to expand the sample size of the consumer expenditure survey. Hardly risky endeavors, and ones that would likely prove fruitful.
To be clear, it’s not as if today’s economic pain is a mystery that this data would somehow solve. Hiring is slow, wage growth is slow, prices have been elevated for years, credit-card debt is mounting, higher interest rates make for a lackluster housing market, AI is looming over the economy … I could go on.
But measurement is always valuable. It can quantify a human struggle and help researchers, advocates and public officials understand a problem. It can also serve as validation that a problem is seen. For years, consumers and workers have taken a far dimmer view of the US economy than the many measures enumerating its strengths. The way out of this contradiction is not to listen to Americans less, but to measure more.
A message from Advisor Perspectives and VettaFi: Discover something new! Click here to register for our upcoming webcasts.
Bloomberg News provided this article. For more articles like this please visit
bloomberg.com.
More Municipal Bonds Topics >