- The multiyear run of performance by emerging market (EM) sovereign external debt has been remarkable but residual valuations look either just fair (investment grade) or expensive (high yield) versus other comparable credits.
- We still see abundant opportunities in EM local markets, while EM equities are poised to benefit from a relatively low starting point for both earnings and earnings expectations.
An additional factor not to be underestimated is the magnitude of the response by developed world central banks to clip the specter of systemic risk that loomed large just a year ago. The Fed has been unrelenting in its pursuit of reflationary policies while the Draghi-led European Central Bank (ECB) has strongly signaled its intent to be a lender of last resort. Even the Japanese seem poised to embrace looser financial conditions in the wake of recent parliamentary elections, with hints that the coming year may see major changes in the Bank of Japan’s approach to inflation. Collectively, these measures have allowed global investors to focus on the core value proposition offered by emerging investments relative to developed: the ability to earn greater compensation while investing in cleaner balance sheets with higher growth prospects (though also underwriting higher degrees of volatility and less liquidity).
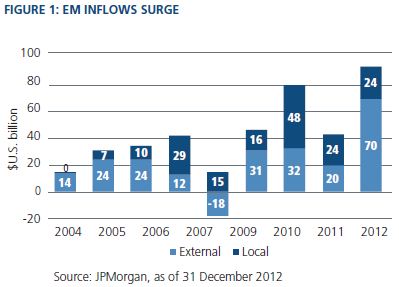
The secular pull into EM assets to take advantage of higher yields and stronger initial conditions was turbocharged cyclically in 2012 by a quantitative easing-led push out of financially repressed developed world assets, with negative real 10-year rates in both U.S. Treasuries (USTs) and German Bunds. The results of this push-and-pull dynamic were clearly evidenced by the surge in EM fund flows, which reached a record for combined flows into local and external debt strategies, with the external side in particular smashing its previous record yearly inflow by more than double (see Figure 1).
EM external debt – from bias to bubble?
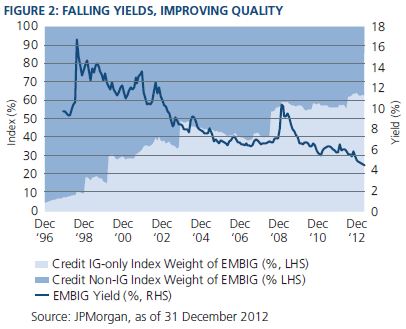
The multiyear run of performance by EM sovereign external debt has truly been remarkable, both in absolute terms and in its consistency – one-year, three-year, five-year, and 10-year returns have all boasted double-digit gains. This reflects a multitude of beneficial secular changes – which PIMCO has been acting on for clients – that have manifested themselves through higher credit ratings and lower yields for EM debt, as illustrated in Figure 2. According to J.P. Morgan, their Emerging Markets Bond Index Global (JPM EMBIG) had a composite credit rating of BBB-, an average duration of 7.7 years, and an average yield of 4.5%, as of the end of 2012. It is hard to find a 10-year maturity investment grade bond where credit quality is still on an improving trajectory that pays 4.5%!
If we further decompose the HY portion of the asset class we can see, similar to the analysis above, that if Venezuela and Argentina were removed from the HY universe, what would be left is a 7.2-year duration, BB+ rated group of countries which trade at 274 bps over USTs. This compares poorly to standard HY indexes such as that shown in Figure 3, where duration tends to be much shorter and spreads are significantly higher, according to JPMorgan and PIMCO calculations.
In aggregate then, we might argue that investors pouring money into EM benchmark-tracking vehicles such as ETFs, as opposed to a highly differentiated approach, are, in essence, taking a larger bet on the prospects of Argentina and Venezuela – two countries that have mixed policy track records, including the expropriation of foreign interests in onshore private enterprises, and substantial political risks. We can further say that the residual valuation of the EM external debt asset class now looks either just fair (IG) or rich (HY) versus other comparable credit alternatives.
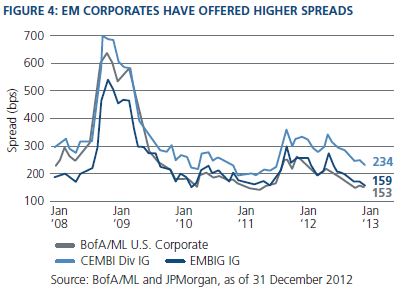
One sector of the EM external debt universe where we still see abundant opportunities is in EM corporates. As Figure 3 shows, EM corporate debt exhibits a similar yield to EM sovereign external debt on average, but with 1.5 years less duration and a one-notch higher credit rating, an attractive mix given historically low global yields, without sacrificing credit quality. While many investors still look at EM corporates as an extension of EM sovereign exposure, we have long argued that EM corporates should also be contrasted with the global corporate credit universe. As Figure 4 shows, whether relative to EM sovereign or developed market (DM) corporate debt, EM IG corporate debt offers an interesting spread pick-up. Importantly, when comparing across the corporate space, this pick-up comes with on average better credit metrics from the EM corporates universe.
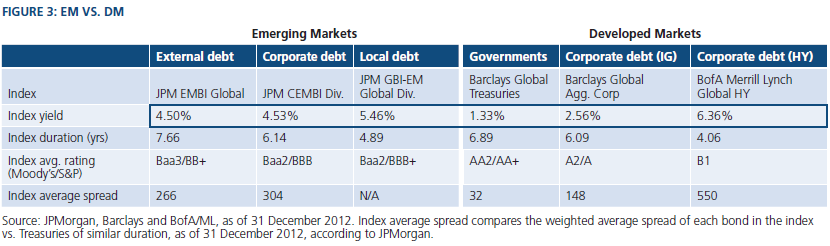
Similar to external debt, EM local debt markets have been strong performers. However, when compared to developed world alternatives, EM local markets stand out as continuing to offer significant value. In aggregate, EM local markets provide investors with a BBB+ rated asset class, with a modest 4.9 years of duration and an aggregate local currency yield to maturity of 5.5% – once again an attractive combination of credit rating, maturity and yield (as shown in Figure 3) at year-end 2012.
Unlike external debt, however, we see that the local markets portion of the asset class is much less subject to the types of compositional effects that may skew relative value. To be sure, there are significant differences in local markets at the individual country level which can be capitalized on via active management, but no one or two countries radically alter the composition of the index from a weighted credit ratings perspective the way that Venezuela and Argentina do in external debt. Instead, local markets offer investors an asset class that is dominated by investment grade credit quality names with 90% of the index weight made up of countries with at least one investment grade credit rating. Despite this higher rating, it traditionally tends to be higher yielding and shorter in duration than EM external debt.
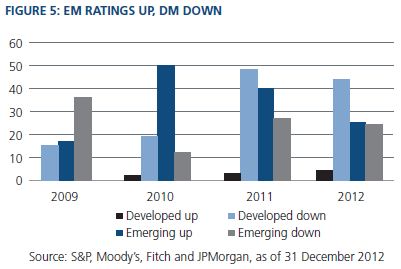
Compared to developed world fixed income alternatives, EM local stands out sharply. While negative real rates out to 10 years are an unfortunate reality for many developed world sovereign debt investors, most EM local markets continue to operate with positive real policy rates and provide investors the opportunity for attractive carry and roll down further out the curve. Similar to the comparison above, we can see in Figure 3 that investors moving out of developed world government bonds and into EM local debt pick up over four percentage points of yield while lowering their overall duration by roughly two years. And what about the credit quality difference you might ask? The secular convergence between EM and DM credit ratings continues and has actually accelerated since the Lehman Brothers bankruptcy with 33 aggregate EM upgrades over the last four years vs. an aggregate 120 downgrades in the developed world (see Figure 5).
Investment implications
Emerging market investments remain well positioned to outperform their developed world counterparts over time, but are not immune to the ramifications of lower growth headwinds that have characterized the New Normal global economy. In particular, the distortions created by policies that either explicitly or implicitly promote financial repression in key developed markets have also exerted a gravitational pull on portions of emerging world investing. Investors across all asset classes must identify where value has dislocated from fundamentals, and ensure that there is sufficient reward per unit of risk taken, even when investing at the seemingly highest levels of credit quality. EM is no different, and strategies at PIMCO that move dynamically across EM asset classes are well positioned to add value for our clients.
Within EM, we believe that the external debt portion of the asset class has been most directly impacted by artificially depressed UST yields, with investors moving en masse out the U.S. dollar credit spectrum to grab additional basis points of carry. As such, significant portions of the external debt universe now appear to have undertaken a large part of a decade-long secular pricing convergence to levels that are in most cases fairly valued and in some cases even quite rich.
With some EM IG-rated sovereigns now trading in 10-year maturities with similar yields to the U.S. Consumer Price Index, we find that insufficient compensation is being offered to hold these names against credit risk, liquidity risk, and even U.S. inflation risk. At the high yield end of the continuum in EM, we see first-time issuers taking advantage of the wave of liquidity to print inaugural deals all the way out to 10-year maturities – unheard of in traditional corporate HY.
We believe more attractive value prevails in EM local markets where nominal yields are still relatively high, real yields are generally positive and steep curves in some key names provide compelling opportunities to benefit from roll down strategies for as long as loose monetary policies persist. However, this better value opportunity comes with potentially higher volatility as underwriting EM FX exposure can produce larger swings in total return, but also represents a tailwind for performance as G-3 currencies are debased over the long term.
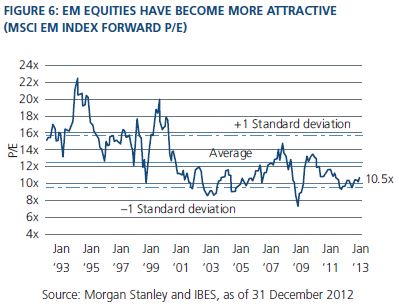
Finally, a tactical rotation into EM equities should benefit from a rebound in activity in China and valuations that look attractive after three years of sideways performance.
Managing Director
Co-Head, Global Emerging Markets
All data is as of 31 December 2012 unless otherwise noted.
Statements concerning financial market trends are based on current market conditions, which will fluctuate. There is no guarantee that these investment strategies will work under all market conditions or are suitable for all investors and each investor should evaluate their ability to invest for the long-term, especially during periods of downturn in the market.
The JPMorgan Emerging Markets Bond Index Global is an unmanaged index which tracks the total return of U.S.-dollar-denominated debt instruments issued by emerging market sovereign and quasi-sovereign entities: Brady Bonds, loans, Eurobonds, and local market instruments. JPMorgan Corporate Emerging Markets Bond Index (CEMBI) Diversified is a uniquely-weighted version of the CEMBI index. It limits weights of those index countries with larger corporate debt stocks by only including a specified portion of these countries’ eligible current face amounts of debt outstanding. The CEMBI Diversified results in well-distributed, more balanced weightings for countries included in the index. The countries covered in the CEMBI Diversified are identical to those in the CEMBI, which is a global, liquid corporate emerging markets benchmark that tracks U.S.-denominated corporate bonds issued by emerging markets entities. JPMorgan Government Bond Index-Emerging Markets Global Diversified Index (Unhedged) is a comprehensive global local emerging markets index, and consists of regularly traded, liquid fixed-rate, domestic currency government bonds to which international investors can gain exposure. Barclays Global Corporate index is a subindex of the Barclays Global Aggregate Index which provides a broad-based measure of the global investment-grade fixed income markets. The three major components of the Global Aggregate index are the U.S. Aggregate, the Pan-European Aggregate, and the Asian-Pacific Aggregate Indices. The index also includes Eurodollar and Euro-Yen corporate bonds, Canadian Government securities, and USD investment grade 144A securities. The Barclays Global Treasury Index tracks fixed-rate local currency sovereign debt of investment-grade countries. The index represents the Treasury sector of the Global Aggregate Index. The BofA Merrill Lynch Global High Yield Index is an unmanaged index of below-investment grade bonds of corporate issuers domiciled in countries with investment grade foreign currency long-term debt rating (based on a composite of Moody’s and S&P). The index includes bonds denominated in U.S. dollars, Canadian dollars, sterling, and euros (or euro legacy currency), but excludes all multi-currency denominated bonds. Barclays Credit Investment Grade Index is an unmanaged index comprised of publicly issued U.S. corporate and specified non-U.S. debentures and secured notes that meet the specified maturity, liquidity, and quality requirements. To qualify, bonds must be SEC-registered. The MSCI Emerging Markets Index is a free float-adjusted market capitalization index that is designed to measure equity market performance of emerging markets. The MSCI Emerging Markets Index consists of the following 21 emerging market country indices: Brazil, Chile, China, Colombia, Czech Republic, Egypt, Hungary, India, Indonesia, Korea, Malaysia, Mexico, Morocco, Peru, Philippines, Poland, Russia, South Africa, Taiwan, Thailand, and Turkey. The MSCI World Index is a free float-adjusted market capitalization weighted index that is designed to measure the equity market performance of developed markets. The MSCI World Index consists of the following 24 developed market country indices: Australia, Austria, Belgium, Canada, Denmark, Finland, France, Germany, Greece, Hong Kong, Ireland, Israel, Italy, Japan, Netherlands, New Zealand, Norway, Portugal, Singapore, Spain, Sweden, Switzerland, the United Kingdom, and the United States. BofA Merrill Lynch U.S. Corporate Index is an unmanaged index comprised of U.S. dollar denominated investment grade corporate debt securities publicly issued in the U.S. domestic market with at least one year remaining term to final maturity. It is not possible to invest directly in an unmanaged index.
This material contains the opinions of the author but not necessarily those of PIMCO and such opinions are subject to change without notice. This material has been distributed for informational purposes only. Forecasts, estimates, and certain information contained herein are based upon proprietary research and should not be considered as investment advice or a recommendation of any particular security, strategy or investment product. There is no guarantee that results will be achieved. Information contained herein has been obtained from sources believed to be reliable, but not guaranteed. No part of this material may be reproduced in any form, or referred to in any other publication, without express written permission. PIMCO and YOUR GLOBAL INVESTMENT AUTHORITY are trademarks or registered trademarks of Allianz Asset Management of America L.P. and Pacific Investment Management Company LLC, respectively, in the United States and throughout the world. © 2013, PIMCO.
© PIMCO
© PIMCO


