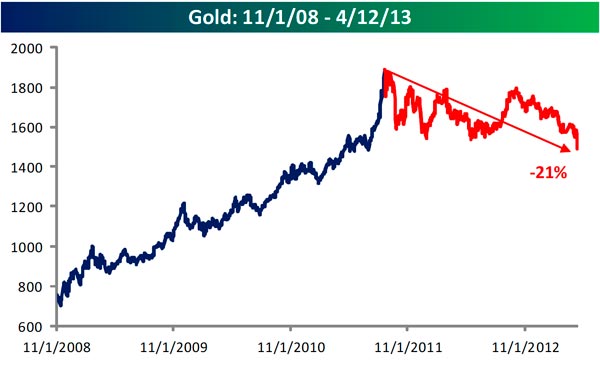
Gold prices officially fell into bear market territory on Friday. With a 4% decline that day, the current drop in the price of gold from its August 22, 2011 top crossed the negative 20% mark. Today as I write this, the precious metal is down another 10% plus.
To say that the yellow metal is oversold is hardly an exaggeration. Gold futures are more than four standard deviations below their 50-day average price change. That’s an extremely rare occurrence not seen since the seventies.
Gold bugs, I am sure, hope that this means that gold investors should see a nice rebound here. Unfortunately, gold seems to be more of a trending commodity than a mean reverting asset. That means that once set in motion one way, like an ocean liner, it’s slow going to turn it around.
The folks at Bespoke Investment Group did some checking and found that when gold was this oversold, it tended to continue lower overall except for the next weekly period.
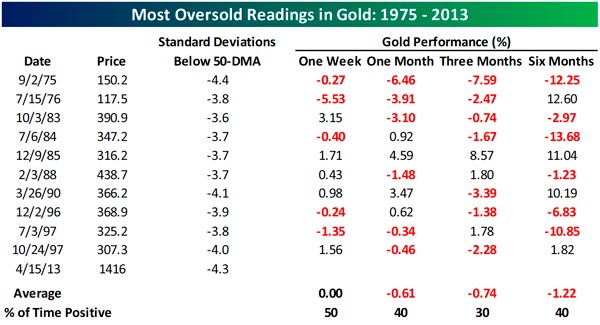
Source: Bespoke Investment Group
I do note, however, that Bespoke’s table was done as of Friday’s close. Therefore, it appears we are in uncharted territory, as today’s decline will take us farther into oversold territory than we have ever been before… since Friday’s close we have fallen another 10.5%. Checking the table above, that brings us to a level that is pretty close to the very worst decline experienced after these types of oversold levels (-13.68% back in the 1984 decline).
Normally, gold takes a much shorter time period to work off of a market top than the relatively long time we have been in decline since the market hit its August, 2011 heights. On average, gold has taken just short of 200 days to decline 20%. This time it has taken almost 600!
Source: Bespoke Investment Group
The average decline from a market top in gold has been about 31% (since gold futures began trading in 1975). This decline already is the greatest in dollar terms, as we have seen over $550 per ounce shaved off the price since 2011. This easily exceeds the previous record holder, a $328 per ounce sell off in 1980-81. In percentage terms, this decline still has a ways to go to catch up to the 45.8% loss on that market crash, which also set the record for worst percentage loss in gold since 1975.
Of course, after today’s 10.5% decline, the decline this time around will already have broken the negative 29% mark. This moves it within 2% of the average price decline of the last 40 years and within 12% of the 1980-81 record. A fall to that record level would mean another $160 decline but the 2% fall means only $26 more.
The average decline after a 20% fall in gold’s price has been 14.1%. With today’s 10.5% further price deterioration, it already consumes three-quarters of the average drop.
In any event, we seem much closer now to a bottom in gold than we are to a top. Still, one headline today proclaimed it “The End of the Era of Gold.” While this is great for the contrarians, like most gold aficionados, to see this in the press (such proclamations usually suggest a move in the opposite direction), there is some reason for concern. Once again, we can trace it back to Europe.
The recent financial mess in Cyprus has resulted in a substantial sale of the government’s gold reserves. It does not take much of an imagination to think that brewing crises in Italy, Spain, and Portugal (to name but a few of the troubled world economies) could lead to similar sales by their governments.
Still, after looking at the data, it appears to me that rather than falling for reasons that are peculiar to gold and that might presage an end of the gold era, instead we have gold moving as a commodity. Most metals have been in a broad decline all year. Gold is just a very visible member of the pack. The correlation between its price changes and the industrial metal, copper, is on the high end historically.
I’m much more willing to blame gold’s fall on the decline today in Chinese growth (as China is a leading consumer of metals) than I am willing to believe that gold is no longer an attractive investment vehicle (even though the decline was from the lofty heights of a 7.8% expectation to just 7.6% reported, hardly a wide miss, and less significant, I wager, given the fact that the government’s target is 7.5%!).
Furthermore, the surprising decline of 0.6% in the Producer Price Index reported last week proved there is more than a hint of de flation in the air. As gold is the weapon (asset) of choice in in flationary times, this is hardly the period in which to declare an end to an era.
Clearly the glitter is off the ingots at the moment, but its light does reflect onto stocks. While gold was falling over 20%, stocks as represented by the S&P 500 Index have advanced 40%. And historically, when gold has fallen as much as it has, stocks continue to rally over the next one, three, and six months, on average.
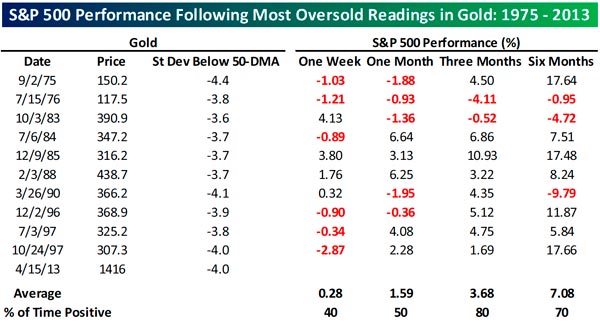
Source: Bespoke Investment Group
Given the extent of the decline in gold, now may be the time to start accumulating some of the yellow metal for that 5% allocation that most financial planners advise buying and holding “just in case.” A good way to do that is with our Gold Equities Trading and/or Tactical Hard Assets strategies, which add active management into the mix.
In the meantime, the real glitter is in the equities market, which hit new heights just last week and whose fall in sympathy with gold today provides one more opportunity to “buy the dips.”
All the best,
Jerry
© Flexible Plan Investments


