While we are encouraged that the U.S. economy has been growing, as measured by Gross Domestic Product (GDP) growth, for 15 consecutive quarters starting in the third quarter of 2009, we are concerned that the growth rate has been below that of previous economic recoveries and the economy appears to be stalling and struggling to get back above a 2% growth rate thus far in 2013. To this end, 1stquarter 2013 GDP was revised downward (the third such estimate) to an annual growth rate of just 1.8%. To put this into perspective, the GDP growth rate in the U.S. averaged 3.23% from 1947 until 2013.
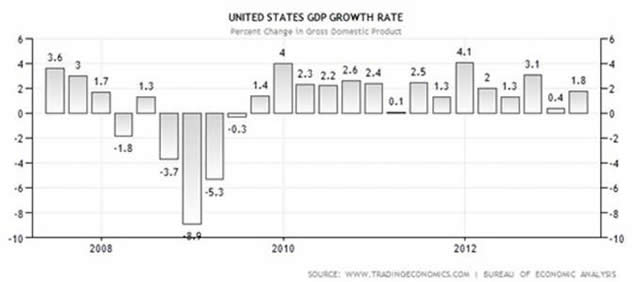
Adding further fuel to the economic growth concern fire, Barclays recently revised their 2ndquarter GDP growth forecast down to the paltry range of 1.0% - 1.6% after reports of the U.S. trade deficit widening in May and disappointing retails sales in June. In a similar fashion, BTIG’s chief Global Strategist Dan Greenhaus stated recently on Twitter that, “Q2 should be less than 1.0%, the second time in 3 qtrs GDP is less than 1.0%. That's not very good."
It is important to reiterate that we, at Hennion & Walsh, still do not believe that there is a high probability of the economy falling back into recession (which we still define as two consecutive quarters of negative GDP growth) at this point in time. We have, however, come to the realization that the “new norm” as it relates to economic growth in the United States may fall within the grinding GDP range of 2.2% - 2-8% for the next couple of years.
Others have suggested that this “new norm” may last even longer. For example, the Conference Board in the November 2012 Global Outlook (see chart below) forecasted an annualized growth rate of 2.3% in their base case for the years 2013-2018 and a further reduced annualized growth rate projection of 2.0% in their base case for the years 2019-2025, representing a U.S. relative distribution of roughly 18% of overall World output.
Comparison of Base Scenario with Optimistic and Pessimistic Scenarios, 2013 - 2025 (November 2012)
|
2013 - 2018 |
2019 - 2025 |
||||||
|
GDP Growth in Optimistic Scenario |
GDP Growth in Base Scenario |
GDP Growth in Pessimistic Scenario |
GDP Growth in Optimistic Scenario |
GDP Growth in Base Scenario |
GDP Growth in Pessimistic Scenario |
Distribution of World Output 2025 |
|
|
United States |
2.5 |
2.3 |
2.1 |
2.4 |
2.0 |
1.7 |
18.4% |
|
Europe* |
1.5 |
1.2 |
0.8 |
1.6 |
1.2 |
0.9 |
17.4% |
|
of which: Euro Area |
1.4 |
1.1 |
0.8 |
1.4 |
1.1 |
0.8 |
12.0% |
|
Japan |
1.6 |
1.1 |
0.6 |
1.2 |
0.9 |
0.7 |
4.9% |
|
Other advanced** |
3.3 |
2.5 |
1.7 |
2.5 |
1.8 |
1.2 |
7.3% |
|
Advanced Economies |
2.1 |
1.8 |
1.4 |
2.0 |
1.6 |
1.2 |
48.0% |
|
China |
7.5 |
5.5 |
3.4 |
4.9 |
3.7 |
2.5 |
22.3% |
|
India |
5.8 |
4.7 |
3.6 |
4.6 |
3.9 |
3.2 |
8.3% |
|
Other developing Asia |
6.4 |
5.0 |
3.6 |
5.6 |
4.4 |
3.2 |
4.9% |
|
Latin America |
3.8 |
3.1 |
2.5 |
3.4 |
2.8 |
2.2 |
7.2% |
|
Middle East |
2.8 |
2.6 |
2.4 |
2.5 |
2.3 |
2.0 |
2.5% |
|
Africa |
5.0 |
4.1 |
3.2 |
5.1 |
4.2 |
3.3 |
2.7% |
|
Russia, Central Asia and Southeast Europe*** |
2.9 |
1.9 |
1.0 |
2.0 |
1.4 |
0.8 |
4.1% |
|
Emerging and Developing Economies |
5.5 |
4.2 |
2.9 |
4.2 |
3.3 |
2.5 |
52.0% |
|
World Total |
3.9 |
3.0 |
2.2 |
3.3 |
2.5 |
1.9 |
100.0% |
Source : The Conference Board Global Economic Outlook 2013, November 2012.
*Europe includes all 27 current members of the European Union, as well as Switzerland and Norway.
**Other advanced includes Canada, Israel, Iceland, Korea, Australia, Taiwan Province of China, Hong Kong, Singapore, and New Zealand.
***Southeast Europe includes Albania, Bosnia & Herzegovina, Croatia, Macedonia, and Serbia & Montenegro, and Turkey.
Should these GDP forecasts come to fruition, we may see the Fed maintaining their accommodative stance for longer than many market participants are now anticipating.
© Hennion & Walsh Asset Management
