EPV: Establishing Predictive Value (i.e., Demand Characteristics)
‘EPV: Establishing Predictive Value’ utilizes <U/O> Applied Indexation to refine assigned benchmarks and examine causality among variables.
EPV: Establishing Predictive Value (i.e., Demand Characteristics) is designed as a complement to quantitative portfolio strategies and fundamental research. Continuing the thread from EPV:RO, tested is the premise of structural bias in performance benchmarks as determined by third party data vendors with implied effects on peer group analytics and valuation.
From a recent EPV exercise . . .
Demand characteristics as it relates to data integrity are examined below based on the parameters of 1) data accuracy, 2) impact on fair value and 3) assessment of benchmark relevance.
Assigned benchmarks are determined by client designation and industry convention. On one level, simple allocation to a particular asset class is the major driver in overall portfolio performance. Multi-layered, from public facing to institutional, client-driven demand is at times unevenly matched against variability of data integrity—and the performance differential is measurable.
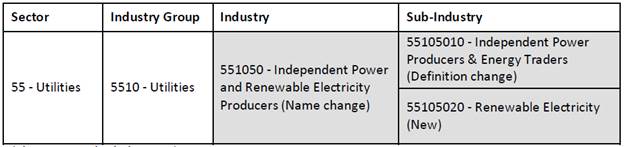
Observers of demonstrated <U/O> Platform process and methodology will note the Alternative Energy Subindustry transcends 18 Industry Groups as defined by the Standard & Poor’s Global Industry Classification Standard (GICS). Upcoming changes to the MSCI and S&P Dow Jones 2014 GICS structure reflect the emergence of Renewable Energy into the mainstream economy . . .
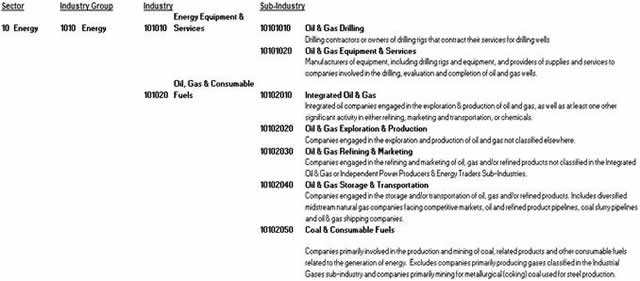
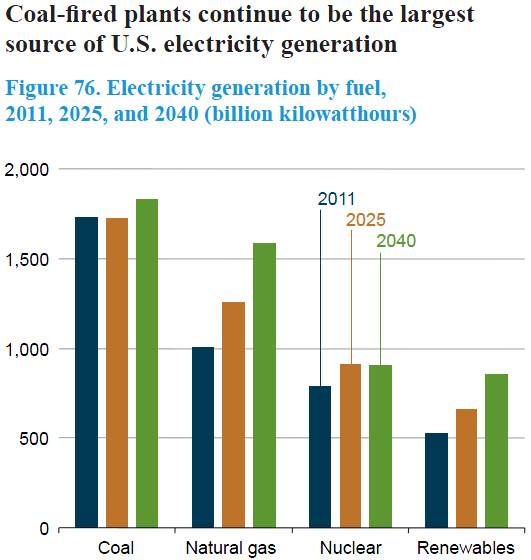
However, when contrasting GICS methodology with the US Energy Information Administration’s Annual Energy Outlook 2013 we observe one energy equation including Renewables with Petroleum, Coal, Natural Gas and Nuclear . . .
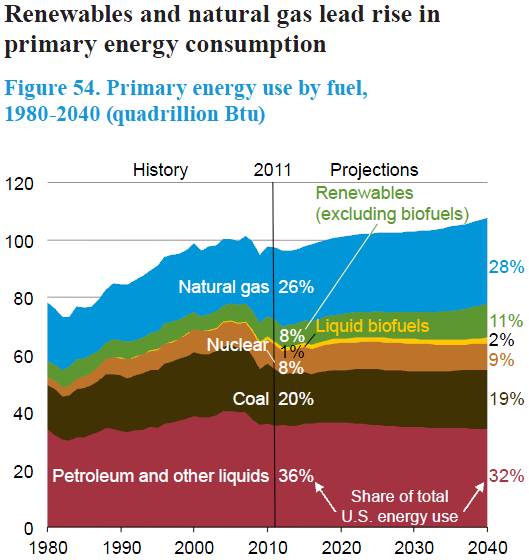
As opposed to inclusion within the Energy sector . . .
. . . S&P DJ Indices determined Renewable Energy’s economic contribution is best measured by its generation and distribution of electricity
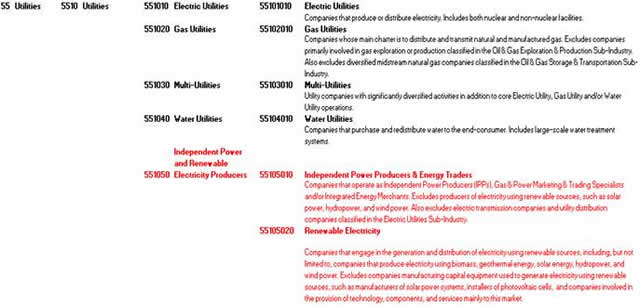
Agreed, US national energy policy supports state mandated renewable portfolio standards for electric generation . . .
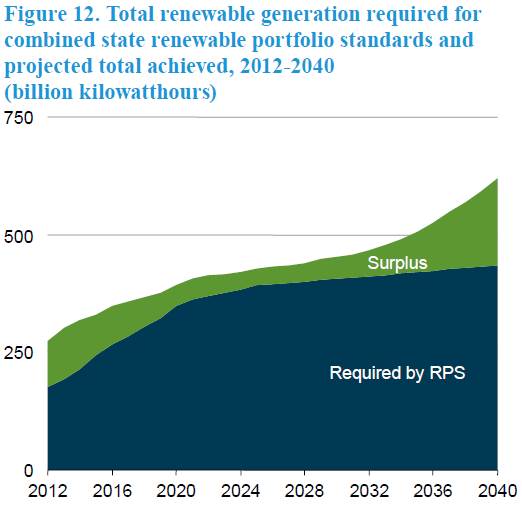
. . . though segmentation of Renewables from the Energy equation is unwarranted as one considers electricity a product from energy sources
Furthermore, differentiation within the GICS Renewable Electricity Sub-Industry is obscured by broad Industry Group and Industry designations when compared to Renewable components . . .
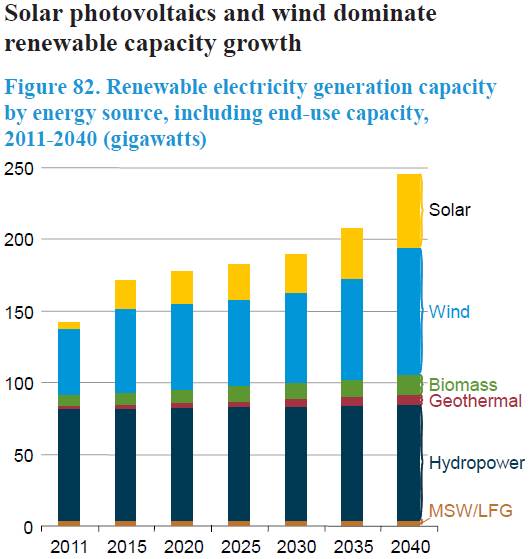
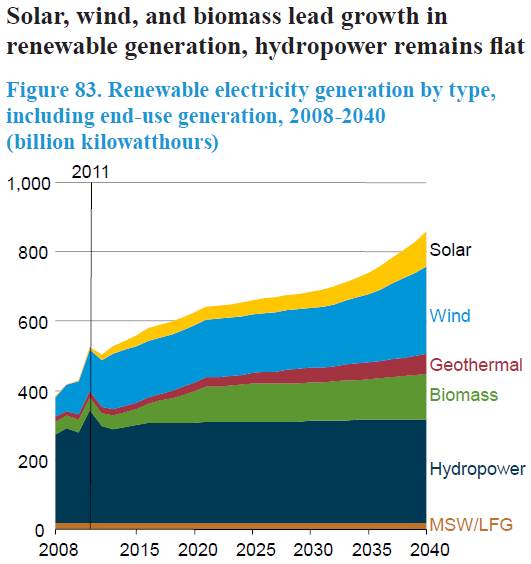
Presented graphically, differences in respective growth rates within the Sub-Industry is important for policy and investment decisions . . .
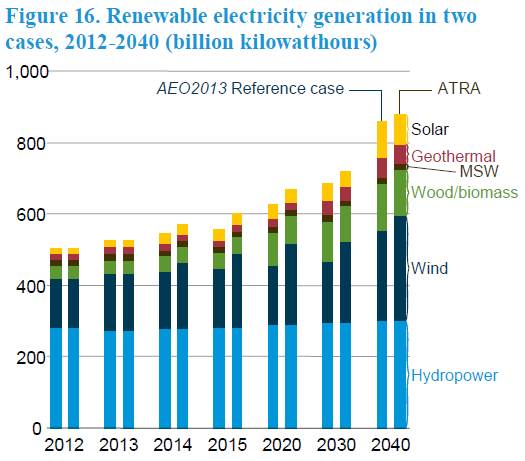
. . . offering an opportunity for competitive advantage in terms of resource allocation, investment banking and asset management
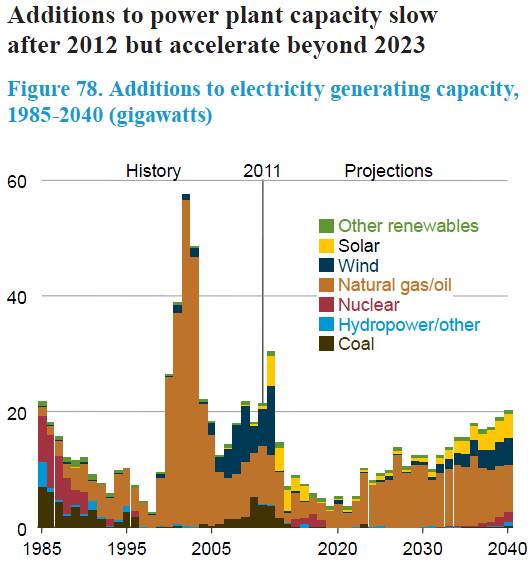
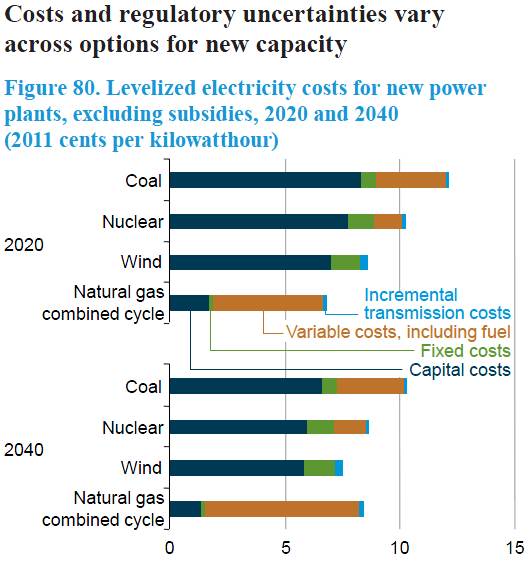
Importantly, efforts towards grid parity (absent subsidies) drive capital allocations . . .
Derivative analytics of institutional performance index standards are typically segmented as a quantitative discipline of finance or IT systems engineering. As a requisite part of due diligence much may be gained by reconciling public/sovereign policy with proprietary indexation and data modularity against requisite adjustments to benchmark presentation. Acquiescence among third party data vendors thus far varies depending on culture ranging from deference to statistical methods, a favor towards modularity and an assimilation of general themes (though often misapplied).
EPV:RO advocated a tiering of players within industries and across economic sectors. An example of well-respected firm Morningstar’s presentation of Aerospace & Defense material and component supplier Hexcel cautions against placing the company on par operationally as Industry Peer Boeing.
Examination of Securities and Exchange Commission filings illustrate both companies participation in separate parts of the Aerospace & Defense Industry’s product life cycle. BA production targets are readily contrasted with material supply in HXL 10K, ‘the impact on Hexcel of Airbus and Boeing’s production rate changes is typically influenced by two factors: the mix of aircraft produced and the inventory supply chain effects of increases or reductions in aircraft production’.
In this case the SEC serves as arbitrator, providing Standard Industrial Classification System (SIC) codes distinguishing HXL (2821) . . .
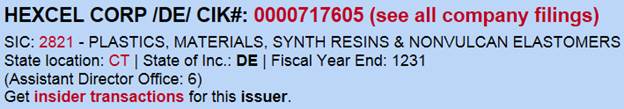
. . . and BA (3721) . . .

. . . though Morningstar’s array of HXL Industry Classification further obfuscates . . .
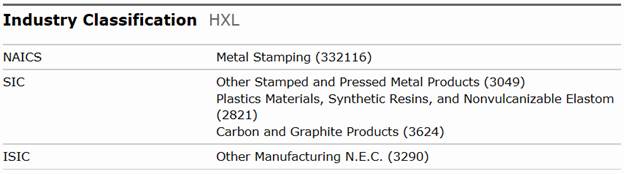
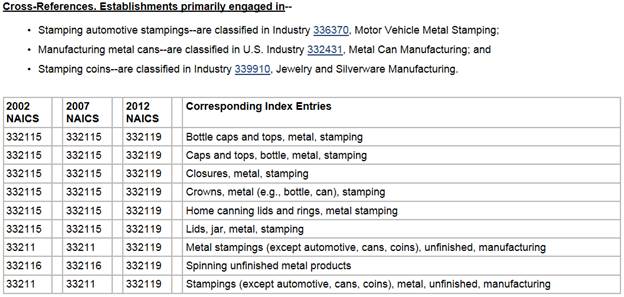
. . . with multiple SIC codes (two of which are no longer in use) and a dated North American Industry Classification System code (which includes bottle caps and jars as comparables) . . .
. . . plus a broad International Standard Industrial Classification code (which includes pencils and umbrellas)

To note Morningstar sits atop of the Wall Street Journal’s Best on the Street analyst rankings, in 2012 two times ahead of second place. When evaluating a firm’s analyst reports in conjunction with proven statistical methods, one may prefer a quantitative approach. Outstanding is at which point in the research and security selection process—investment rationality, performance attribution, client meetings—is it important to have accuracy and transparency among data points.
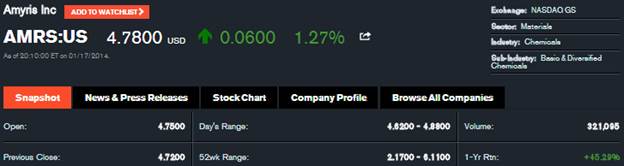
Revisiting the essential global financial infrastructure provided by Bloomberg, sampled is the clarity provided by publicly accessible Sector/Industry/Sub-Industry classifications (upper-right corner of proceeding exhibits):
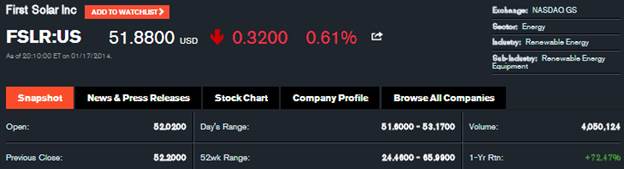
Acknowledged in evolution is FSLRs Energy Sector and Renewable Energy Industry designations though as the review is continued, on an operating basis Solar is not distinguished from . . .
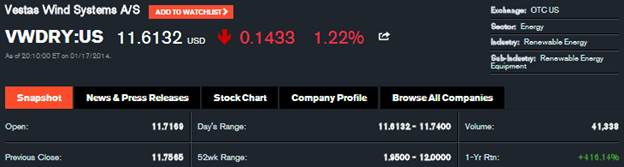
Wind, or . . .
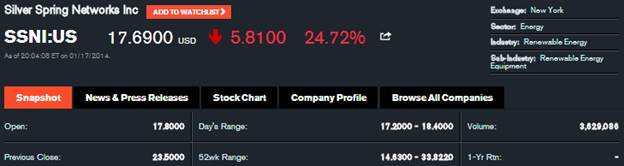
Smart Grid, or . . .
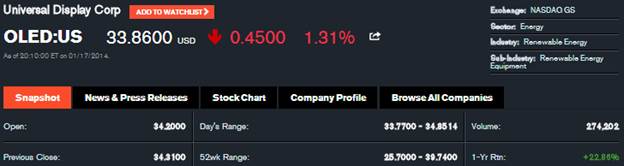
LCD, to sample just four of a combined <U/O> PBW/PZD universe (n=117). Morningstar is similarly vague . . .
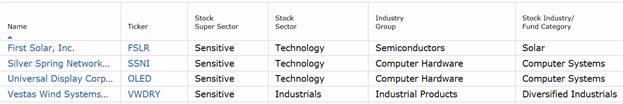
. . . and curiously continues to place Solar within the Technology Sector and Semiconductors Industry Group. A model for revision, noted is a representative Biofuel company (n=4 of combined PBW/PZD universe) Sub-Industry . . .
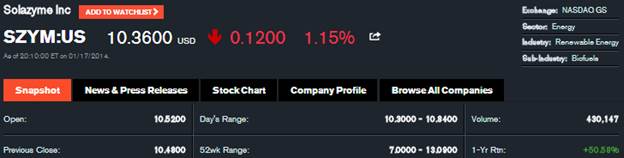
. . . but the assignment is absent from this one . . .
Based on year-end data, 44% of PBW component members (n=54) were assigned the generalized Energy/Renewable Energy/Renewable Energy Equipment designation (or two with the slightly modified Energy/Renewable Energy/Renewable Energy Project Dev) totaling 43% of portfolio weight, representing 23% of PBW market capitalization; contrasted with both the US and International component members of PZD, only 14% are similarly categorized equaling just 5.5% of portfolio weight and 3.2% of market capitalization.
Data suggests identifying under-followed Small- and Mid-Cap companies engaged in emerging technologies offers to exploit inefficiencies in established nomenclature: [PBW] Small-Cap 48.6%, Mid-Cap 36.5%, Large-Cap 14.9%; [PZD] Small-Cap 10.1%, Mid-Cap 31.3%, Large-Cap 58.6%.
Current debates question whether the reconfiguration of an assigned benchmark creates a structural bias in portfolio management, specifically the effects of Smart Beta and Active versus Passive strategies on a market neutral posture. Observed when determining performance attribution within designated benchmark ETFs or thematic investing is an inherent structural bias common in position building (i.e., from 50 bps to a 2% position), traditional portfolio management (managing 2% to 3% positions) and period-end ‘window dressing’.
ETF steward Vanguard characterizes the performance issues of factor tilting by non-market weighted index portfolio strategies in ‘A Review of Alternative Approaches to Equity Indexing’. In the study, Vanguard attributes the occurrence of modified strategies outperformance to Value and Small-Cap categories’ historic relative outperformance rather than Alpha generation in a Smart Beta or Active approach, decreasing the degree of PM-attributable risk adjusted excess returns by alternative index tactics. Promoted is the benefit of full sector exposure determined by an all-cap market weighted GICS strategy and selected exposure along its nine factor grid:
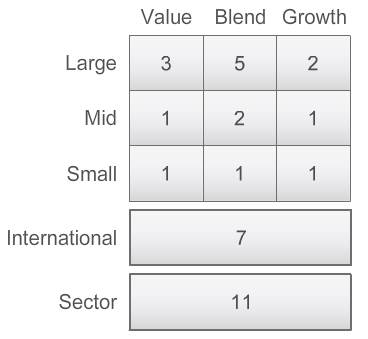
Still, as we’ve seen from our first example, a GICS neutral strategy is also debatable.
Derived from Invesco PowerShares ETFs PBW and PZD Sector structure then initially standardized via Morningstar and Bloomberg methodologies (ref: 3Q13 Iteration), consider the further refined <U/O> Model Portfolio Segment/Classification below as of September 30, 2013 (n=68):
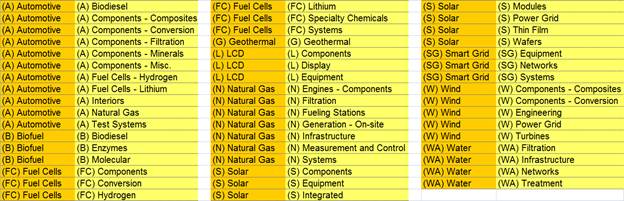
Not exhaustive by any means, the structure provided simply displays the characteristics of select companies within the PBW/PZD universe based upon business segment operations.
Testing the hypothesis in <U/O> Model Portfolio, a base case scenario necessitates the following assumptions: 1) a static derivative quantitative equity strategy is employed for analysis (effectively Long all <U/O> Matrix component members with negative inversions), 2) no degree of macroeconomic, Sector, Industry, Subindustry or fundamental research is utilized beyond initial <U/O> Matrix Segment/Classification assignments via SEC documents and related, 3) performance is measured against subsequent period position total return (i.e., Q3 indicators versus Q4 performance), 4) positions sold by PBW/PZD intra-quarter are carried forward at portfolio weight without attributed performance (allocated at 0%) and 5) foreign exchange translation is not applied to individual position performance.
Under these conditions, the <U/O> Model Portfolio performs:
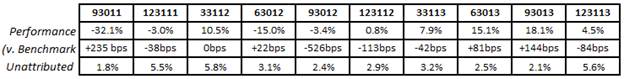
<U/O> MP 2013 returned 45.6% in 2013, +99 basis points to the market weighted blended PBW/PZD benchmark with a cumulative unattributed portfolio performance position total of 13.4%; <U/O> MP 2012: -7.2%/-659 bps/14.2% unattributed; <U/O> MP 2H11: -35.1%/+197 bps/7.3% unattributed. With standard filters detailed in quarterly Summary Templates provided on a static period basis (3Q11-3Q13), cumulative screened returns totaled +332.8% versus Industry Group and +518.4% v. respective benchmark (n=13).
Refinement of third party nomenclature improves peer groups analytics and provides for outperformance as even off-period performance figures illustrate the relative strength of negative indicator inversion applications. Removing the static nature in base case offers utilization to capture both accelerating and deteriorating fundamental assessments of corporate performance whereby adverse cyclical commodity exposure is easily parsed—e.g., Solar, Rare Earths, Biofuels peak-to-trough.
Active management and fundamental analytics provide for application of inverse indicators, Sector/Industry research, relative value and company-specific financial analysis—like testing for food allergies, diet is pared then added-back in stages.
To be sure, inverse indicators based on the variance between component member market capitalization and respective portfolio position weighting relative to peers in each <U/O> Matrix Segment and Classification do provide distinct characteristics. As detailed previously in this forum, predominantly:
- Small- and Mid-Cap companies within the sample group possess (or trend to) corresponding negative indicators (portfolio position weight greater than proportionate market capitalization)
- Mid-Caps exhibit both leadership and lag, Small-Caps demonstrate volatility of outperformance/underperformance in sensitivity to price and demand changes
- Without exception Large-Cap companies maintain positive indicators reflecting the dominance of capitalization within a classification, counter-cyclicality of conglomerates during off business cycles and/or lag effect in up markets
Demonstrated is the capability to lever <U/O> methodology in overweighting outperforming Segments/Classifications/component members as well as underweighting underperforming positions of respective industry leaders and laggards in support of directional price movements among subcycles within greater cyclicalities as well to add, lever, divest or short exposure based on demand characteristics and future expectations (e.g., overweight underperforming or underweight outperforming positions).
The extent to which an assigned benchmark and component members market capitalization deviate from a market weighted (neutral) posture is the measure by which <U/O> Matrix captures the relationship via inverse indicators provided by the rationalization of nomenclature on both a Segment and Classification basis. Opportunities to exploit incongruities in nomenclature persist as long as a significant proportion of an investment universe is generalized.
Finally, technical analysis rightly anticipates a reversion to the mean for markets based on historic economic and security price performance over cycles (source Hussman):
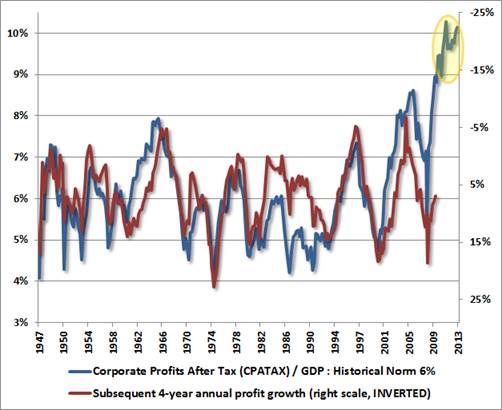
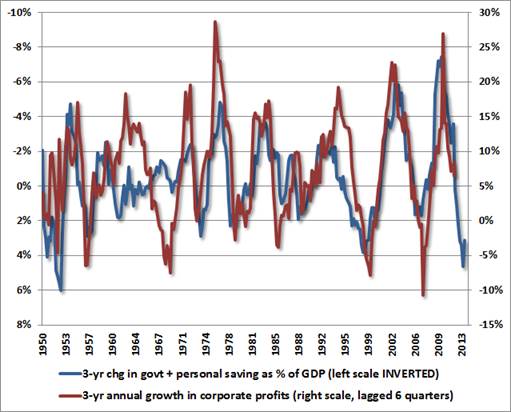
However, as data is aggregated and curves are smoothed, the fitted lines mask differentiated corporate and business segment growth rates evident in diverse economic activities—the cyclicalities and subcyclicalities across sectors and within industries.
Demand characteristics are both client-driven (performance, benchmarks) and institutionally borne (integration). Applications of benchmark analysis and indexation are intended to improve the quality of data, performance attribution and peer group analytics. Intuitively, valuation necessitates specific business segment rationalizations and related metrics.
Appendix:
The premise of refining an assigned benchmark to create a more relevant ‘Tier 2 – Relative Value’ grouping via Nomenclature is conferred in sampled single and multivariate scenarios whereby inverse indicators embed company performance/forecasts, publicly available information and analyst projections to the extent by which a component member deviates from a market-weighted (neutral) posture.
The placement of determined PBW/PZD component members within <U/O> Matrix segments and classifications provides an investment narrative supporting a general portfolio strategy to achieve Alpha, whereby variance of classification relative to company-specific operating segments identify and isolate above trend growth rates based on fundamental sector drivers.
<U/O> Applied Indexation embedded in <U/O> Matrix details 3rd and 4th degree indexation methodology for use across economic sectors and asset classes. The resulting characteristics of exchange-listed component members, such as those engaged in emerging technologies with differentiated capitalization levels, can be apportioned for further examination without exclusion due to the finite nature of indexation. By managing concurrent cycles, change in a particular industry can be characterized and anticipated.
The execution of a strategy which captures the attributes of an assigned benchmark, transcends industries and fulfills requisite investment mandates efficiently creates a turnkey product adding velocity to the research process. Once a relevant benchmark is established, deconstruction of its elements may begin to detail the quantitative characteristics of its component members. Structuring the assigned benchmark in accordance with a standardized process establishes relativity and a basis of comparison for further computations.
Published research serves as both a quantitative reference and instructional resource in addition to a template for client services. Metrics may be modified to accommodate the universe of sector, industry and subindustry research. For assistance implementing the aforementioned concepts within your financial/economic models or investment research process, please note three levels of consultation: Qualitative – Support, Quantitative – Directed and Quantitative – Fundamental.
© Universal Orbit