The last month of 2013 looked much like the year overall: U.S. stocks were strongly positive, and international developed markets also gained. At the other end of the spectrum, bonds declined as yields rose and emerging-markets stocks and bonds were generally negative. For the full year, the Vanguard 500 Index (our S&P 500 proxy) was up 32%—the index’s best showing since 1997—and small caps soared even higher, gaining 39%. In the year-end commentary that follows, we review the big-picture themes underlying these results, including U.S. (and global) monetary policy and U.S. (and, in some cases, global) economic improvement. Several of the year’s dominant macro trends were also front and center in December. Monetary policy—a major source of support for rising global stock markets in 2013—made news last month as the Federal Reserve announced its first actual reduction in its monthly bond buying. In contrast to May of 2013 when Fed Chairman Ben Bernanke began discussing a possible taper, investors took December’s announcement largely in stride. Another key theme for the year overall was U.S. economic improvement. Here, too, December continued the trend with positive data releases in areas such as employment and consumer confidence.
Developed international markets gained nearly 2% in December and 22% for the year. Much as in the United States, supportive monetary policy (in Europe and Japan) was one factor that helped stocks. On the economic front, the picture is more mixed. While Europe exited recession, many countries continue to struggle with excessive debt and weak economies. While Japan’s stock market was the top performer in 2013, it remains to be seen whether Prime Minister Shinzō Abe’s plan for dealing with deflation and sparking economic growth delivers on its initial promise. Finally, amidst the positives, emerging markets were strikingly divergent as softer economic growth generated investor concerns and the potential Fed taper roiled markets further.
The core, investment-grade bond market suffered a rare calendar-year loss, falling 2%, its first decline since 1999. Results were driven by a general preference for risk assets as the economy recovers and investors seek higher returns, as well as concerns about a potential change in U.S. monetary policy. We review the performance of our portfolio positions in the commentary that follows, in addition to providing our outlook for the asset classes we cover.
The Improving Macro Picture
We find ourselves with a more sanguine big-picture view, at least over the nearer term, than we have had in some time. U.S. and global economic fundamentals gradually improved over the past year across a number of dimensions, and seem poised for continued improvement or at least stability in 2014. Unfortunately, the risks related to excessive global debt, subpar growth, and unprecedented government policy that we have worried about since the aftermath of the 2008 financial crisis still remain largely unresolved. But before we revisit our concerns, let’s quickly run through some of the key positives.
the global economy slowly strengthens
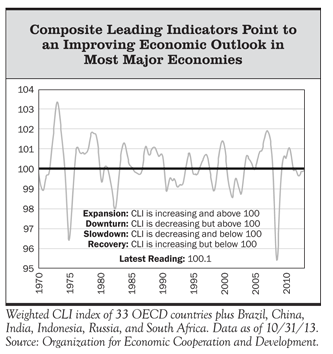
At the broadest level, the growth rate for the global economy (which the International Monetary Fund estimates at 2.9% for 2013) improved in spots over the year and seems set to increase at least modestly next year. On a year-over-year basis, the U.S. economy grew at a real (i.e., inflation-adjusted) rate of around 2% in 2013 (through the third quarter), Europe finally emerged from recession, and the United Kingdom (2.6%) and Japan (2.1%) also generated modest but positive growth. Emerging-markets’ growth was disappointing overall in 2013, but they should benefit from improved export demand in developed markets next year. As shown in the chart at right, the leading indicators index produced by the Organization for Economic Cooperation and Development recently rose above 100 and is increasing, which indicates an economic expansion is underway. The indicators are designed to provide early signals of turning points between the expansion and slowdown of economic activity, and are based on a wide variety of data collected by the OECD from its 33 developed country members and a handful of emerging countries.
Manufacturing is a particularly bright spot with the J.P. Morgan Global Manufacturing Purchasing Managers’ Index hitting its highest level since February 2011 and also signifying an accelerating economic expansion. The PMIs are based on monthly surveys that provide advance indication of what is happening in the economy by tracking changes in production, new orders, inventories, employment, and prices.
housing and labor gains help boost the u.s. economy
Specific to the U.S. economy, there are a number of positives extending a trend that we highlighted in our commentary at the end of 2012.
- The housing market continues to improve. For example, the widely followed S&P/Case-Shiller Home Price Index was up 11% from a year earlier, and CoreLogic reports the percentage of homeowners who owe more than their homes are worth fell to 13% (as of the third quarter) compared to 22% a year ago.
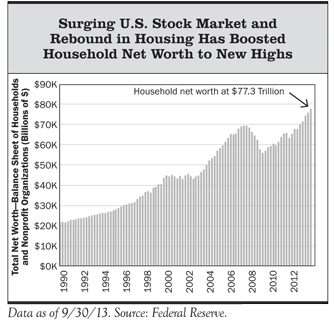
- Along with the surging U.S. stock market, the strengthening housing market boosted household net worth to new highs.
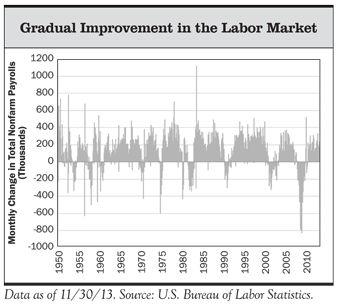
- The labor market continues to gradually improve. Nonfarm payrolls (the net new jobs created in the economy each month) averaged a solid rate of nearly 200,000 per month during 2013 (although that is still below the pace of job growth during a typical economic recovery), and the unemployment rate dropped to 7% in November. Of course, as we and others have pointed out, much of the decline in the unemployment rate has been driven by a drop in the labor participation rate to 30-year lows.
an improved debt and credit picture bodes well for consumer spending
Household deleveraging (i.e., debt reduction and repair of consumers’ balance sheets) continued apace and household debt appears to be well along the path toward reaching more sustainable levels. The household debt/income ratio, a measure of the willingness and ability of consumers to increase their borrowing, has dropped 20% from its peak in 2007, and is now back where it was in 2003 and in line with its long-term historical trend.
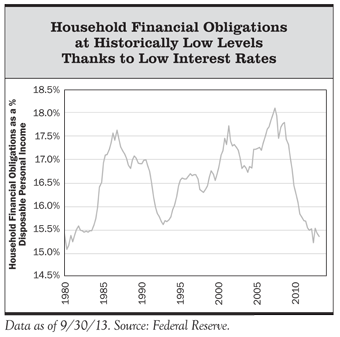
Meanwhile, household debt service and financial obligations ratios remain at historically low levels thanks to extraordinarily low interest rates engineered by the Federal Reserve, along with modest income growth. Furthermore, credit conditions (i.e., credit availability and cost), as measured by a variety of indicators, also continue to improve and remain relatively loose.
These indicators bode well for an improvement in consumer spending, or at least limited further consumer retrenchment.
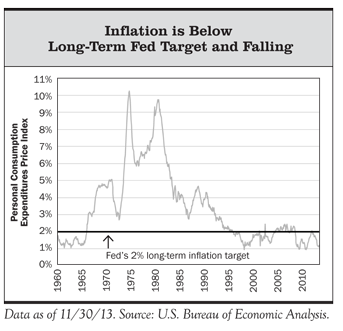
inflation is low, monetary policy remains supportive, and the budget deficit has declined
Inflation in the United States (and globally, with a few exceptions) is low and remains well-contained due to subpar growth and significant slack (excess capacity) in the economy. While most commentators talk about the inflationary risks from overly accommodative Fed policy (and we agree that is a medium- to longer-term risk), there remains a more immediate risk of continued disinflation (a falling inflation rate). In 2013, the price index for personal consumption expenditures—the Fed’s preferred measure of inflation—fell further below its target of 2%. As of November 30, 2013, the core PCE index (which excludes food and energy prices) stood at 1.1%, its lowest level since early 2011. The headline PCE inflation rate (which includes food and energy prices) was just 0.9%. On the other hand, if the economy gains some momentum and unemployment comes down further we will likely see increased wage pressures, which would put some upward pressure on inflation. (Rising wages would also pressure corporate profit margins, which as we have repeatedly noted—and note again later in this commentary—remain at/near historical highs. This would have negative implications for earnings growth and stock market performance.)
Related to the inflation picture, developed country central banks are likely to remain highly accommodative at least over the next year or two in terms of holding short-term interest rates at extremely low levels, and in some cases also providing additional liquidity via quantitative easing bond purchases. Specific to the United States, at its December 18, 2013, meeting the Fed initiated tapering of QE bond purchases by $10 billion, to $75 billion per month. Fed chairman Ben Bernanke also stated that if the Fed sees continued improvement in labor market conditions along with stable inflation it “will likely reduce the pace of asset purchases in further measured steps at future meetings.” If so, QE would likely be finished before year-end 2014 (there are eight Federal Open Market Committee meetings each year).
But importantly, the Fed also reinforced its intention (a.k.a. “forward guidance”) to keep the federal funds policy rate at near zero for the foreseeable future, including “well past” the point when unemployment drops below 6.5%. Moreover, Bernanke was clear that the Fed remains concerned about inflation that is too low and anticipates keeping rates low at least until inflation clearly moves back toward its 2% objective.
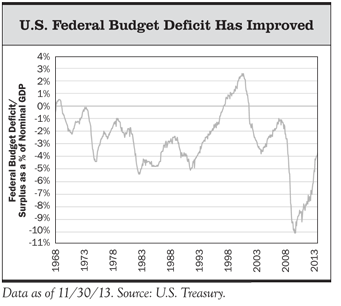
The U.S. federal budget deficit has come down sharply over the past year, and, with the recent bipartisan two-year budget agreement, the drag on GDP growth from fiscal policy tightening will be reduced in 2014. This compares to 2013 when tax increases and “sequester” spending cuts shaved 1.5 percentage points off of GDP growth, according to Congressional Budget Office estimates. The two-year budget deal also greatly reduces the threat of another government shutdown during that span. However, another ugly political fight over the debt ceiling remains a possibility later in the first quarter of 2014. And the need for a credible medium- to longer-term plan for government deficit and debt reduction remains.
So, there are many macro positives that should not be ignored, but it is important to remember that just because economic fundamentals are improving doesn’t necessarily imply a strong year for the stock market. Valuations, earnings growth, interest rates, and overall investor sentiment/psychology (to name a few) are likely to be much more important drivers of market returns. The stock market is a discounting mechanism, so presumably it already incorporates positives like stronger economic fundamentals as this evidence comes out. This is reflected in what we still see as unattractive/high valuations (even given our more sanguine macro outlook). So, we wouldn’t be surprised to see a decent year for the global economy, but a weak year for U.S. stocks after the very strong rally in 2013. There also remain significant macro risks and uncertainties that continue to influence our investment outlook and portfolio positioning as we look out over the next five years. We will discuss those next.
macro risks, negative considerations, and uncertainties remain
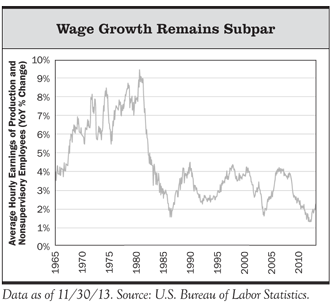
Wage growth and income growth in the United States remain subpar, although both have been increasing since late 2012. Weak income growth implies that consumer spending is likely to be subdued even as consumer deleveraging becomes less of a headwind. With consumption accounting for roughly 70% of U.S. GDP, this suggests continued sluggish economic growth absent a significant increase in consumer borrowing or reduced saving.
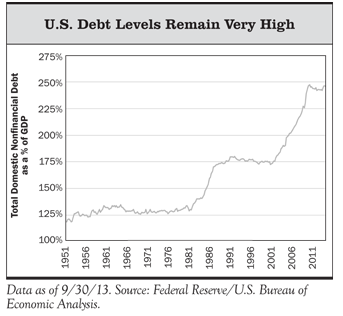
OverallU.S. debt levels remain very high and the projected growth in government debt and entitlement spending relative to GDP is still too high to be sustainable over the very long term. Resolving this without causing an economic contraction is likely to be challenging, even in a normal growth environment.
The chart to the right shows total household, government (federal, state, and local), and nonfinancial corporate debt as a percentage of GDP. It is still right near the all-time post–World War II high, due to continued growth in government and corporate debt.
Beyond the economics of deleveraging, the situation is made even more challenging due to the U.S. political dysfunction. The ability to forge compromise and progress on the country’s longer-term debt/deficit situation remains highly uncertain, although there may be signs of light reflected in the recent bipartisan budget agreement. It’s possible that the political dysfunction hit a low point with the government shutdown fiasco last fall. And public opinion of Congress is so low there is the potential for a positive surprise in this regard (though we won’t hold our breath.)
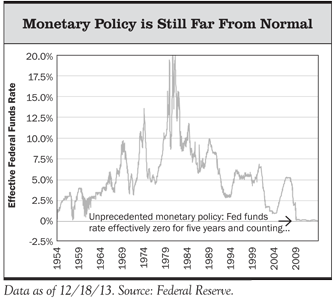
Fed monetary policy is still far from normal and, although the QE taper has begun, there remains a great deal of uncertainty as to how the Fed will exit from its zero fed-funds rate policy and unwind its huge balance sheet (currently at $4 trillion, or 22% of GDP, and still growing due to bond purchases) without causing an economic or market shock. We think it’s more likely than not that the Fed will err on the side of tightening monetary policy (raising rates) too late rather than too early, and that inflation will become an issue for the financial markets, which would be a negative for both stocks and bonds. But as discussed above, that is not an immediate concern. Given the Fed’s policy pronouncements as well as their unpleasant experience with the market’s reaction to last summer’s “taper talk,” we’d put a low probability on the Fed tapering or tightening too aggressively. But policy errors in either direction are certainly possible. (The change in Fed leadership from Bernanke to Janet Yellen is unlikely to lead to a significant change in policy.)
Despite exiting recession in 2013, the eurozone economy remains very weak, with structural imbalances between creditor and debtor countries that are still far from resolved. There remains a meaningful risk of deflation and a debt crisis stemming from the weaker peripheral countries. The banking system is undercapitalized and in need of a credible region-wide banking union backstop (and recent efforts on this front are far from sufficient). In October, eurozone inflation fell to 0.7%, which prompted the European Central Bank to make a surprise interest-rate cut to a record low 0.25% amid rising fears that Europe might follow in the footsteps of Japan’s “lost decades” of stagnation and deflation. Meanwhile, eurozone unemployment climbed to more than 12% in 2013 and is at much higher levels in the periphery (e.g., 27% in Spain), causing social unrest with the potential to spiral into a more serious crisis.
Risks in the financial system related to China’s debt/infrastructure spending bubble remain. While it is encouraging to see China’s new leadership acknowledging and addressing the cyclical and structural imbalances in their economy, it is no guarantee they can successfully manage them without a major disruption. At least partly reflecting these risks, the Shanghai stock market ended 2013 down 13% from its highest point earlier in the year, and down nearly 7% for the year overall.
Japan is the world’s third largest economy, so the success or failure of “Abenomics” (prime minister Shinzō Abe’s wide-ranging plan for reinvigorating Japan’s economy) is a wild card that will have important global economic and market implications. We don’t have a high-conviction opinion as to its ultimate outcome—just recognition that it’s another manifestation of an unbalanced and weak global economy, and the extremely aggressive and unconventional policies that are being undertaken to try to turn things around.
the big picture in summary
While there have been fundamental improvements in the macro environment over the past year, many big-picture risks remain as we look out over the next five years. We are not confident in predicting that any of these risks will actually play out, but we think many of them have a reasonable likelihood of happening (and many of these risks are interrelated, meaning if one happens others are more likely to occur as well). If so, the consequences for financial markets and asset prices would likely be severe. Although there don’t appear to be any near-term catalysts, we believe it remains prudent to manage our balanced portfolios with these risks—and their potentially significant market impacts—firmly in mind. This is particularly so, given our assessment that current valuations for U.S. stocks (in aggregate) are not sufficiently pricing in the potential impact on the market if these risks actually do play out.
Investment View: Looking Back and Looking Ahead
With that macro backdrop, we’ll move now to a discussion of our portfolios, looking at some of the key developments in the financial markets over the past year, their impact on performance, and our investment outlook heading into 2014. Before doing so, though, we feel compelled to reiterate that we don’t invest based on a one-year outlook or time horizon. Similarly, we don’t judge the success of our investment decisions (or those of the fund managers with whom we invest) on a one-year basis. But, it is human nature at year’s end to look back at what transpired over the past 12 months . . .
portfolio headwinds
The primary headwind to our relative performance in 2013 was our under-allocation to U.S. and developed international equities.
» Equities: Underweight
Our balanced portfolios were underweighted to global stocks in 2013 and that hurt us in terms of returns, although we still believe it was prudent from a forward-looking risk-management standpoint. Over the course of the year, as we weighed the macro and valuation risks facing equities against our estimate of their longer-term (i.e., five-year) return opportunity, our conclusion was that having a moderately defensive portfolio positioning (reflected in a below-benchmark allocation to stocks) made sense. The fact that the major risks we considered did not play out over the past 12 months does not invalidate them.
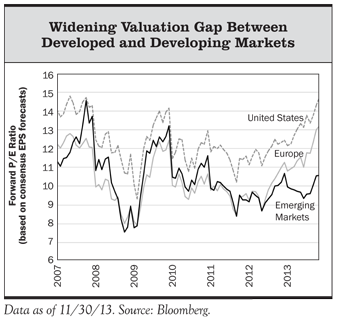
Our total underweighting to stocks ranged from 10% to 15% depending on the portfolio’s risk objective (we had a larger underweight in the more conservative portfolios). U.S. stocks were 9%–11% underweight so within our overall stock underweighting we were more underweighted to U.S. stocks than to non-U.S. stocks. Within our non-U.S. stock exposure, we were underweighted to developed international stocks relative to emerging-markets stocks. Finally, within our U.S. stock exposure, we have been underweighted to small-cap stocks relative to large-cap stocks. All of these relative positions were headwinds to our performance in 2013. U.S. stocks were the top-performing asset class, with the S&P 500 up 32%, followed by developed international stocks (up 22%). Emerging-markets stocks declined 5%. Adding to the relative performance headwind, small-cap U.S. stocks outperformed U.S. large caps by roughly six percentage points.
» Large-Cap U.S. Stocks: Underweight
We have presented our analysis and rationale for our underweight to U.S. stocks in many previous commentaries (including our Third Quarter Investment Commentary), so we won’t repeat the details again here. But in summary, based on our scenario analysis (using a range of reasonable earnings-growth and valuation assumptions) and looking out over our full five-year tactical time horizon, our estimate of the most likely annual return for U.S. stocks is in the low single digits. We don’t believe stocks’ current upside potential is high enough to fully compensate us for their downside risks unless a more optimistic scenario than expected plays out. Put differently, we view U.S. stocks as broadly overvalued, but not egregiously so and therefore we have been moderately underweight.
However, our portfolios still maintain significant exposure to U.S. stocks because our analysis suggests they can perform at least reasonably well across a meaningful portion of our potential return range, both in absolute terms and relative to other competing asset classes and strategies in which we could currently invest. At the same time, we are also revisiting a key assumption in our base-case scenario equity model. Specifically, a key driver of our low single-digit five-year return estimate for U.S. stocks is the endpoint valuation multiple of 15x earnings. In what we assumed would be a more risk-averse investment environment consistent with the aftermath of previous financial crises, we felt this was a prudent valuation multiple to apply in our base case scenario. This multiple is also in line with the very long-term stock market average. However, this valuation assumption has not played out, with the market currently selling at roughly a 19x multiple on trailing 12-month earnings. As the macro environment continues to gradually improve, we have been internally discussing whether 15x is too conservative an assumption and we are now in the process of formally reassessing whether it makes sense to increase our base case P/E multiple. There are many variables for us to consider in this analysis and we expect to complete it in the early months of 2014.
» Small Cap U.S. Stocks: Underweight
From a top-down perspective, small-cap stocks look even more overvalued, both on an absolute basis and relative to large caps, which is the primary reason we are underweight small caps. For example, analysis by the Leuthold Group shows small caps selling at a 20% valuation premium relative to large caps. They note that this is the fourth-highest monthly observation in the past 30 years. In addition, from a bottom-up perspective, a number of small-cap and all-cap managers we respect have been saying they are finding it increasingly challenging to find attractive investment ideas in the small-cap space as stock prices have shot higher. As a result, many of them are holding large cash positions or have shifted their all-cap portfolios heavily in favor of larger-cap names (although many of our managers are also reporting stretched valuations and limited buying opportunities in the large cap space as well).
» Emerging-Markets Stocks and Emerging-Markets Local-Currency Bonds: Overweight
We devoted a good portion of our Third Quarter Commentary to our analysis of potential returns and risks for emerging-markets stocks and bonds. We also discussed the key drivers of the disappointing recent performance of these asset classes and our rationale for having a long-term (strategic) exposure to them in our portfolios. Moreover, on a tactical five-year basis, we continue to view emerging-markets stocks as likely to generate better returns than U.S. stocks across most scenarios—a function of their more attractive starting valuations (particularly after the huge disparity in performance in 2013) as well as what we expect to be stronger earnings growth over this time horizon. But we also continue to view the downside risk and volatility of emerging-markets stocks as higher than for U.S. stocks, and we take this into account in our overall portfolio construction. Putting it all together, we are one percentage point overweight to emerging-markets stocks in our Balanced model and 6% overweight in our most aggressive Equity portfolio (including our assumed “look-through” exposure to emerging-markets stocks held by our diversified international fund managers).
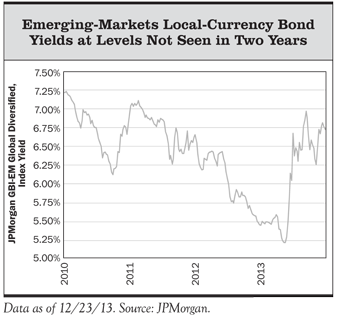
Emerging-markets local-currency bonds were the worst performing asset class in our portfolios in 2013, declining 9%. Not only did they lose money, but we funded them from a mix of U.S. and international equities, so the relative return shortfall was more than 35%. (We funded emerging-markets local-currency bonds from stocks because we view them as having much higher downside risk than traditional bond funds.) The position’s poor showing after several years of strong performance (14% annualized gains from 2009 to 2012) was a function of both rising interest rates (i.e., falling bond prices) and declining currencies in emerging markets.
We are maintaining a 3%–5% position in emerging-markets local-currency bonds in our balanced portfolios because we expect them to generate mid- to high-single-digit returns over the next five years, and because they also provide some “insurance” against an unexpected decline in the U.S. dollar, which is one potential outcome of the Fed’s aggressive monetary policy.
While the weak performance of emerging-markets stocks and bonds in 2013 was certainly disappointing, it is important to remember that 1) we view these as long-term investments; 2) their potential returns remain attractive on a longer-term basis; 3) by definition a diversified portfolio is going to have some investments that are performing more poorly than others over any given period, but that does not invalidate the longer-term portfolio benefits of owning a variety of asset classes with different risk and return drivers; 4) the magnitude of the relative outperformance of U.S. stocks vs. emerging-markets stocks and local-currency bonds in 2013 was unusual; and 5) we think it was largely an overreaction to shorter-term factors (e.g., disappointing emerging-markets growth, Fed tapering fears) and not justified by longer-term fundamentals or valuations.
» Alternative Strategies: Overweight
The third area in the portfolio that we funded from our tactical underweight to U.S. and international stocks was alternative investment strategies. These include lower-risk strategies such as merger-arbitrage and event-driven arbitrage. Alternative strategies are intended to generate long-term returns that are better than core bonds, with much lower downside risk and volatility than equities and relatively low or no correlation to traditional stocks and bonds. Beyond this strategic rationale for owning alternatives, on a current tactical (five-year) basis we believe they can generate returns at least comparable to stocks across our most likely scenarios, and with much less risk.
Our alternative strategies met their strategic risk/return objectives for the most part in 2013, generating positive returns and outperforming core bonds with low volatility, though the arbitrage strategies’ returns were below our longer-term expectations. In the few brief periods where stocks declined meaningfully in 2013 we saw the risk management benefits from owning alternatives. But for the year as a whole they were no match for global stocks’ 20%-plus returns. We continue to maintain a 5%–6% allocation to alternatives in our balanced portfolios for their diversification benefits and expected contribution to overall portfolio risk-adjusted return. When our outlook for stocks improves and our tactical equity allocation moves back toward a full strategic weighting, we’d expect to fund a larger portion of our alternatives position from bonds than stocks.
what worked
Having now spent several pages discussing the headwinds to our portfolios last year, let’s turn our attention to two significant positive drivers of our performance for the year. Our portfolios benefited from two main tailwinds in 2013: our underweight to core bonds, and the performance of our actively managed stock and bond funds.
» Core Fixed-Income: Underweight
» Flexible and Absolute-Return-Oriented Fixed-Income: Overweight
For the past several years we have been underweight to core investment-grade bonds in our balanced portfolios. Our analysis has indicated that longer-term returns for core bonds will be very unattractive—a function of their very low starting yields and the likelihood that interest rates would rise over our five-year horizon, leading to price declines. As such, we replaced more than half of our core bond exposure with tactical positions in several “non-core” flexible and absolute-return-oriented fixed-income funds run by skilled managers. We also added positions in floating-rate loan funds in our most conservative bond-heavy portfolios, where the negative return impact from rising interest rates on the overall portfolio is greatest. In aggregate, these non-core fixed-income positions have been a big positive for our balanced portfolios’ performance over the past five years, and they paid off again in 2013.
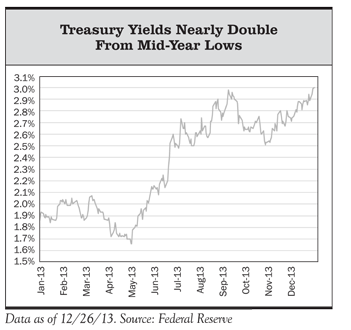
The 10-year Treasury yield started the year at 1.8% and ended it at 3.0%. This translated into a 2% loss for the Barclays Aggregate core bond index—its worst year since 1994, and second worst in the index’s 37-year history. In aggregate, our non-core bond funds outperformed the core bond index. With one exception (PIMCO Unconstrained), all of them also generated positive returns for the year. So clearly, our tactical decision to significantly underweight the core bond asset class was beneficial. We are maintaining this underweight going into 2014.
Looking ahead, longer-term expected returns for core bonds remain unappealing. Unlike stocks, where the range of potential returns is very wide depending on the scenario, core bonds are likely to return somewhere in a narrow range of 1%–2.5% annualized over the next five years. Given this dreary return outlook, the sole purpose of core bonds in our balanced portfolios at present is as protection against a negative economic surprise or financial market shock that causes investors to flee stocks and riskier assets in favor of the safety of high-quality bonds. We stress test our balanced portfolios for such a scenario as part of our risk management process, which is a key driver of our core bond allocation decision.
We also continue to evaluate the trade-off between the opportunity cost of our core bond position (i.e., the likely higher returns we could earn from riskier investments, including more aggressive flexible bond funds) and the benefit it provides in terms of downside protection, particularly for our clients who are most risk averse. In a bull-market year like 2013, the opportunity cost of core bonds is evident. But should some of the deflationary risks and weaknesses that remain in the global economic system intensify, core bonds would benefit.
» Our Actively Managed Stock Funds Also Added Value
Our actively managed stock funds were also significant positive contributors to performance in 2013. Most of our U.S. large-cap, international, global, and emerging-markets fund managers beat their index benchmarks for the year. The funds we invest in vary to some extent across our different investment platforms, but using the AdvisorIntelligence Equity model portfolios as an example, we estimate that our active stock pickers added roughly 400 bps of performance versus the benchmark. While we can never predict how our active managers will perform from one year to the next, we do intensive and ongoing qualitative due diligence to gain a high level of confidence in their ability to outperform over the longer term. Moreover, as global macro risk considerations become less of a market concern, individual company fundamentals and valuations should move to the fore as the key drivers of stock prices. That is an environment that should play to the strengths of our stock pickers and managers.
» Speaking of Diversification…
Putting it all together, as we look back on our portfolios’ performance in 2013, we view it as a year in which our investment discipline, manager selection, portfolio management, and risk management processes were critical, as each of these played an important role in determining our portfolio allocations. While our biggest tactical positioning was away from the asset class that ended up having the strongest performance (U.S. stocks), we still maintained meaningful exposure there because we also recognized the potential for a more positive scenario for stock returns and, in all but the most pessimistic scenarios, stocks were still likely superior to core bonds. Our positioning reflected both our conviction that on a five-year forward basis U.S. stocks were unlikely to deliver satisfactory returns and our acknowledgement of the unusually high degree of uncertainty and, by implication, unusually wide range of potential outcomes.
Part of what we mean when we talk about being intellectually honest is that we don’t pretend to have certainty or a high degree of confidence in a particular outcome if we don’t believe such confidence is strongly justified by the facts, circumstances, and our analysis. To do so would be fooling ourselves and in turn our clients. That is why diversification —owning a variety of asset classes, strategies, and managers that should perform differently depending on the scenario, and building a portfolio that should perform reasonably well across a wide range of possible scenarios—is an important part of our discipline in addition to our conviction-driven (i.e., fat pitch) investment approach.
Over the long term we expect to outperform, but it won’t happen every year and we won’t take undue risks to try to achieve that objective. And despite our overweight to emerging-markets stocks (the worst-performing region) our Equity portfolios outperformed the benchmark (thanks to very strong active equity manager performance). Moreover, from an absolute return perspective, we are pleased with the 2013 performance. Our typical Balanced (60% stock/40% bond) portfolio delivered a low-double-digit return, which is well above our longer-term return expectations given the portfolio’s risk profile.
More importantly, despite what has been our moderately defensive positioning throughout this very strong bull market period, our portfolios have generated very attractive absolute returns (ranging from 11% to 18%, depending on the model) while also meaningfully outperforming their benchmarks, over the trailing five years.
Concluding Comments
The renowned value investor Seth Klarman (his hedge fund has generated roughly 20% annualized returns over 30-plus years) concisely summarized the current environment when he wrote the following in his Year-End 2012 Shareholder Report:
Investing today may well be harder than it has been at any time in our three decades of existence, not because markets are falling but because they are rising; not because governments have failed to act but because they chronically overreact; not because we lack acumen or analytical tools, but because the range of possible outcomes remains enormously wide; and not because there are no opportunities, but because the underpinnings of our economy and financial system are so precarious that the unabating risks of collapse dwarf all other factors.
While it strikes us that the underpinnings of our economy are getting stronger, we agree with Klarman’s broad sentiments. Patience and maintaining a long-term perspective, while always very important, are especially critical in this environment. Most asset classes are currently priced for just fair or subpar longer-term returns in our view, and stock market sentiment in the United States is reaching optimistic extremes, suggesting a pullback may be close at hand. Investment “fat pitches” are few and far between and this is not the time for most investors to be at the plate swinging aggressively. (Yet that is what always seems to happen after markets have strongly rallied, and the very heavy recent inflows into stock mutual funds and ETFs suggest it is happening again.) However, with hugely accommodative monetary policies still in place against a backdrop of tame inflation and gradually improving global growth, we could make the case that the conditions for a major market decline also do not appear imminent. Stocks could continue to follow the path of least resistance higher over the months ahead.
Our investment approach does not try to time short-term market moves or turning points. Our asset allocation discipline is to assess potential asset class returns and risks across a range of scenarios, based on our forward-looking analysis and judgment, and informed by our experience and study of market history. We don’t know the timing, but we are confident better investment opportunities will arise over the next few years—it’s always been the case, driven by market cycles and the timeless human emotions of fear and greed. If so, our “dry powder” in the form of lower-risk investments in fixed-income and alternatives will be a major benefit to our portfolios instead of the drag on returns they were in 2013. We will continue to apply our discipline in order to capitalize on compelling return opportunities when they arise, but always with a strong focus on the risks our portfolios may be exposed to, while understanding that not all such risks will ultimately come to pass.
We appreciate your confidence and trust, and all of us at Litman Gregory share our best wishes for a happy, healthy, and prosperous new year.
–Litman Gregory Research Team (1/2/14)
© Litman Gregory