Why would investors even think about investing in fledgling, so-called frontier economies half a world away? The quick answer is that some of the best-performing stock markets in the world can be found in places like Kenya, Bulgaria and Argentina. Annual equity returns topped 40% in all three countries in 2013 while a number of other frontier markets (FMs), including Romania, Serbia and Nigeria, experienced annual returns ranging from 25% to 35%.1 Although past performance is not a guarantee of future results, investors in search of portfolio growth and diversification are taking note.
Not so long ago, even the larger emerging markets (EMs) were considered exotic. But over the past two decades they have become a familiar investment story. Since 1988, EMs’ share of global market capitalization (market cap) has grown from 1% to more than 17%, and over the past decade outperformed the S&P 500 Index by 67%.2 While some EMs are still growing at a healthy clip, others—including Brazil, Russia, India and China, the large “BRIC” nations that dominate the EM indices—have seen slowing growth rates as of late. This slowdown has been a principal reason that broad EM indices dropped in 2013.
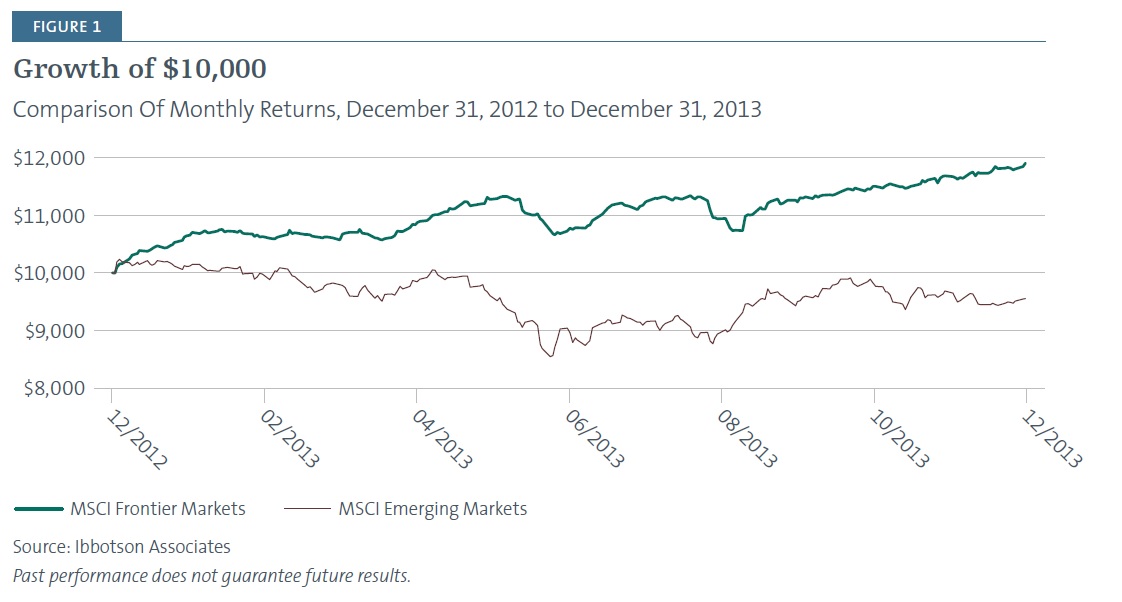
Now a growing number of investors are looking to many frontier markets as the next wave of global development—especially given the recent surge in the performance of their equity markets. Overall, the MSCI Frontier Markets Index gained 25.9% in 2013, as compared to a -2.30% decline for the MSCI Emerging Markets Index (Figure 1).
In essence, many frontier nations are the emerging markets of tomorrow. The 26 markets in the MSCI Frontier Markets Index today represent an estimated 1.1% of world market cap, the same share EMs had 25 years ago. Twenty-five years from now – who knows? One thing is clear: frontier markets are among the fastest-growing economies in the world. From 2008 to 2012, the average gross domestic product (GDP) growth rate of frontier nations was 5.4%, far outstripping the U.S. average rate of less than 1%. And while the U.S. economy has picked up steam, forecasts for the 2013-17 period estimate that FMs’ GDP will expand at an average annual rate of 4.3%, more than the 2.9% rate forecast for the U.S.3
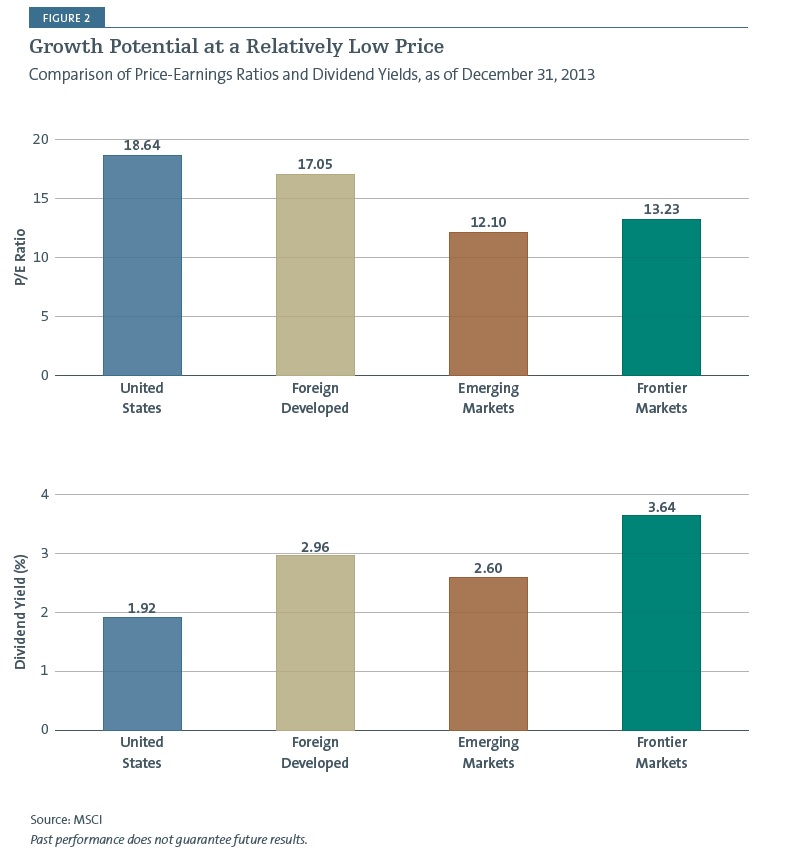
In assessing the opportunities, analysts point to the favorable demographics and strong growth potential of these early-stage economies, along with their low valuations relative to developed nations (Figure 2). Indeed, the total stock market value of frontier nations is equivalent to about 3.5% of their collective GDP, while the corresponding figure is 17.4% for emerging markets and 60.5% for the developed world.4
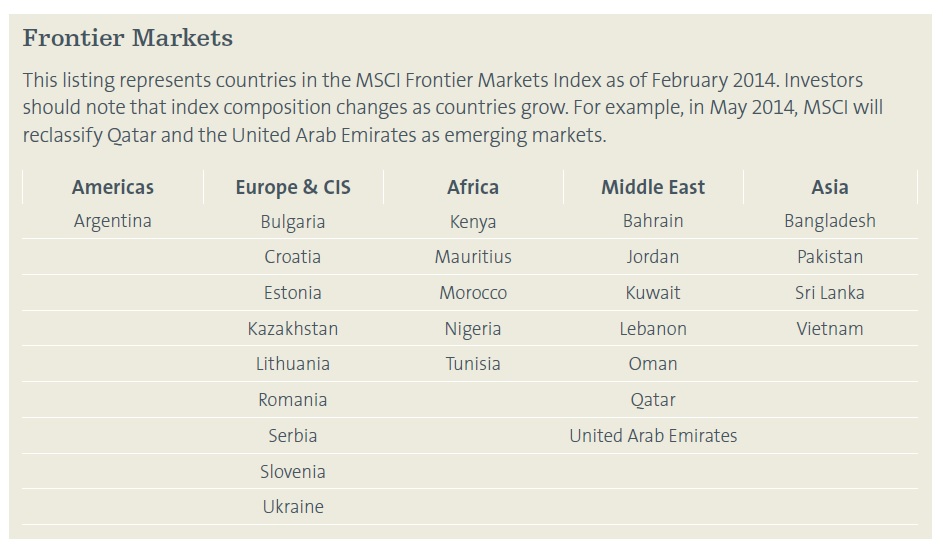
Frontier Markets
This listing represents countries in the MSCI Frontier Markets Index as of February 2014. Investors should note that index composition changes as countries grow. For example, in May 2014, MSCI will reclassify Qatar and the United Arab Emirates as emerging markets.
But the question looms: what about the risks? Spreading sectarian clashes in the Middle East, economic woes in Argentina, election violence in Kenya—such troubles understandably give investors pause. It’s important to remember that FM nations lack the level of political stability, the financial infrastructure, and the legal and regulatory framework that characterize more developed markets. Language and cultural barriers, physical distance and less abundant information all factor into the aura of risk surrounding frontier markets.
Investors are right to be cautious; frontier markets are no exception to the principle that excess returns come with additional risks. But to fully understand the risk profile of this nascent asset class, investors need to look past common assumptions and misconceptions. Those who do may discover some facts surprisingly different from what they might expect. What follows is a brief survey of key investment considerations and risks for those venturing into the FMs, as well as our views on how investment strategies can be designed to help mitigate risks.
Political and Sovereign Risks
When investing in countries where civil and political unrest can be common there can be a risk of market disruption. For example, an eruption of massive protests in Ukraine drove its stock market down 3.5% between November 21 and December 17, 2013, but made almost no ripple in other FMs. In fact, during that period the broader frontier index was up 1.7% and Ukraine’s nearest frontier neighbor, Romania, saw its market rise by 1.3%.5
That’s because frontier markets have had an unusually low correlation to each other. Spanning the Americas, Europe, Africa, the Middle East and Asia, these far-flung economies have little in common beyond being in a similarly early stage of development. A major development might roil the economy in Nigeria or Argentina, but will have little or no effect in Estonia, Kuwait or Vietnam.
At the same time, frontier stock markets are often dominated by domestically-oriented sectors, such as banks, telecommunications and consumer companies that are driven more by the local economy than by global macro trends. As a result, between January 1, 2009, and December 31, 2013, the average intercountry correlation among MSCI Frontier Markets Index nations was 0.36 as compared with 0.63 for countries in the MSCI Emerging Markets Index and 0.76 for the MSCI EAFE Index.6
Our takeaway is that, given the diversity of frontier markets and the low correlations among them, gaining exposure via a strategy that invests across a broad cross section of FMs can potentially help dampen the risk in any one country.
Volatility
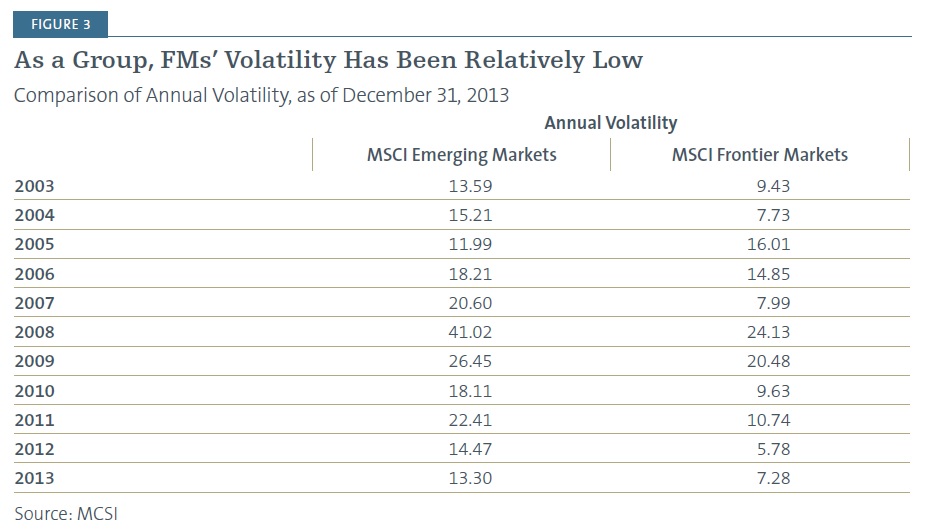
Individually, frontier markets can be quite volatile. But because they are so diverse and relatively uncorrelated, as a group they have actually been less volatile than the MSCI Emerging Markets Index or the S&P 500 Index in recent years (Figure 3). This low group volatility reinforces our belief that a broadly diversified approach to frontier market investing is critical.
A recent Morningstar analysis cites other reasons why frontier markets have been less volatile than EMs. Morningstar points out that EM equities have been considered a “risk-on” asset class and that during “risk-off” periods, investors have left in droves. “Given the relatively low foreign investor penetration in frontier-markets stocks and bonds, [the frontier markets] asset class has not been as susceptible to this hot money-driven volatility,” Morningstar concludes.7
Fiscal Stability and Corruption
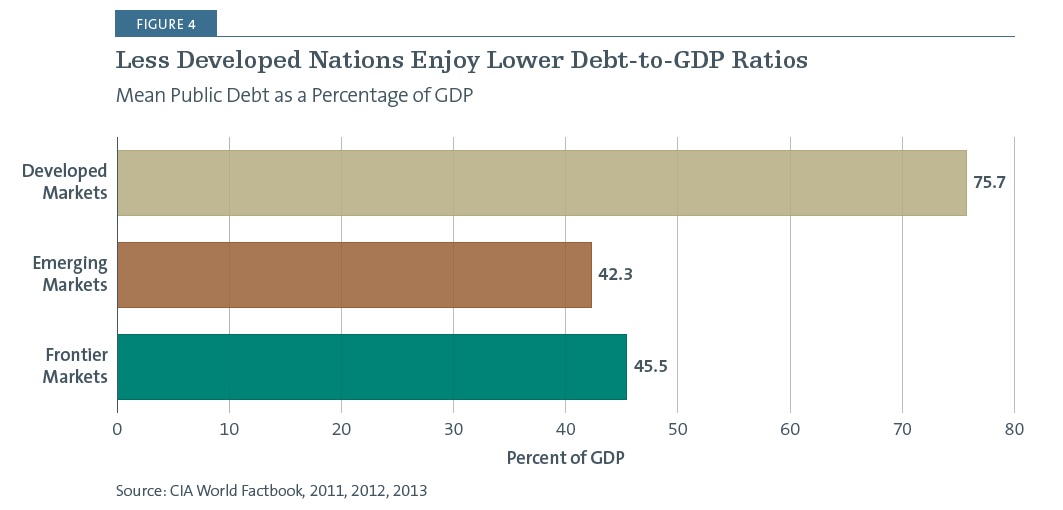
At a time when many developed nations are grappling with serious fiscal challenges, one might assume that frontier markets are in even worse straits. In fact, the reverse is probably true. Having learned their lessons from earlier defaults, crashes and bailouts, many frontier nations have generally tightened up their fiscal policies and, as a group, are on solid fiscal ground. As a result, frontier nations generally have far lower sovereign debt levels than developed nations (Figure 4).
Contrary to widely held perceptions, corruption is not rampant in all FMs. For example, according to Transparency International’s 2013 Corruption Perceptions Index, the United Arab Emirates is ranked 26th and Estonia is ranked 28th on the list of the least corrupt countries. This is ahead of Portugal at 33 and Israel at 36. Ranked at 157 out of 175 nations, Zimbabwe is the lowest-scoring frontier nation on the list—that is, among the most corrupt. But 15 of the 26 nations in the MSCI Frontier Markets Index rank ahead of the BRICs. China, the “least” corrupt BRICs nation, ranks 80th, and Russia is 127th on the list.
Liquidity
By nature, the frontier market opportunity is limited in size. As of December 31, 2013, the market capitalization (free-float adjusted) of the MSCI Frontier Markets Index was $540 billion— not much greater than Apple’s $490 billion market cap on that date. FMs’ average daily trade volumes provide another gauge of FMs’ liquidity. During 2013, the MSCI Frontier Markets Index traded approximately $225 million a day. To put this in perspective, Starbucks stock traded $330 million a day for the same time period. At the individual company level, 90% of those in the MSCI Frontier Markets Index trade less than $1 million per day as of October 31, 2013.8 This limited liquidity can make it challenging for investors to build positions in the frontier markets.
On the other hand, to date, the majority of the investment in FMs has come from major institutions such as public and corporate pension funds. Institutional investors tend to represent “patient money,” allocating for the long term and seeking to mitigate their risks through portfolio diversification. This suggests that at this point in their development, frontier markets may be less prone to massive sell-offs than other, more mainstream asset classes.
Operational Complexity and Costs
Given the relative immaturity of frontier equity markets, they can pose operational challenges. For example, the chances of failed trades may be higher, settlement processes may also be less automated and more prone to error, currency conversions and custodial relationships are more complex when dealing with smaller markets and foreign investors may encounter ownership restrictions or added reporting requirements. In evaluating prospective frontier managers, investors are wise to ask how their strategies and methods have been designed to deal with such issues.
It must also be noted that investing in smaller, less liquid markets is almost always more costly. More than 30 of the 142 frontier market names trade at bid-ask spreads exceeding 1.50%, and currency transactions may add costs as well. Trading commissions can also be high, particularly in some of the less developed markets, where they may exceed 2.0%. Furthermore, while annual custodial costs are generally negligible in developed markets, in FMs they can range as high as 0.60%.
Conclusion
Frontier markets offer an unfolding opportunity for investors who are seeking growth along with global diversification. But the risks of investing in these less mature markets need to be well understood. We believe frontier-market investors should:
Make sure they are thoroughly educated about the asset class and its potential risks, including keeping up to date on developments in this fast-moving area of investment, especially since the “frontier” label refers to a shifting roster of nations. For example, Qatar and the United Arab Emirates are expected to graduate from frontier to emerging market status in 2014.
Gain exposure to the asset class through a broadly diversified approach.
Incorporate an allocation to frontier markets in a broadly diversified portfolio.
There is no doubt that the risks and costs of investing in frontier markets are greater than in emerging and developed markets. But when it comes to some risk factors, such as fiscal stability, frontier markets may be less risky than many assume. Beyond that, some risks can be partly mitigated through thoughtfully designed, diversified investment strategies. It is possible that in some situations, adding a frontier markets allocation to a portfolio may actually lower its overall risk, given historically low correlations between FM, EM and developed market indices.
Additionally, frontier markets offer growth potential, low correlations within markets and with other asset classes, along with relatively attractive valuations. We believe that these nascent markets represent an opportunity that growth-minded investors should not overlook.
You should consider the investment objectives, risks, charges and expenses of the Forward Funds carefully before investing. A prospectus with this and other information may be obtained by calling (800) 999-6809 or by downloading one from www.forwardinvesting.com. It should be read carefully before investing.
RISKS
There are risks involved with investing, including loss of principal. Past performance does not guarantee future results, share prices will fluctuate and you may have a gain or loss when you redeem shares.
Foreign securities, especially emerging or frontier markets, will involve additional risks including exchange rate fluctuations, social and political instability, less liquidity, greater volatility and less regulation.
Asset allocation and diversification do not assure profit or protect against risk.
1.MSCI, 12/31/13
2.Standard & Poors and MSCI, ten years ending 01/31/14
3.IHS Global Sights, from Q2 2013 fund overview
4.EPFR, as cited in Barron’s on 11/09/13, http://on.barrons.com/1ajemy6
5.MSCI, 12/31/13
6.Morningstar Direct, 12/31/13
7. http://news.morningstar.com/articlenet/article.aspx?id=620048
8.Standard & Poor’s and MSCI
Definition of Terms
Bid-ask spread refers to the difference in price between the highest price that a buyer is willing to pay for an asset and the lowest price for which a seller is willing to sell it.
Correlation is a statistical measure of how two securities move in relation to each other.
MSCI EAFE Index is a stock market index that is designed to measure the equity market performance of developed markets outside of the U.S. and Canada.
MSCI Emerging Markets Index is a free float-adjusted market capitalization index that is designed to measure equity market performance in the global emerging markets.
MSCI Frontier Markets Index is a free float-adjusted market capitalization index that is designed to measure equity market performance of frontier markets.
Price-earnings (P/E) ratio of a stock is a measure of the price paid for a share relative to the annual income or profit earned by the firm per share. A higher P/E ratio means that investors are paying more for each unit of income.
S&P 500 Index is an unmanaged index of 500 common stocks chosen to reflect the industries in the U.S. economy.
Valuation is the process of determining the value of an asset or company based on earnings and the market value of assets.
Volatility is a statistical measure of the dispersion of returns for a given security or market index.
One cannot invest directly in an index.
Nathan Rowader is a registered representative of ALPS Distributors, Inc. Forward Funds are distributed by Forward Securities, LLC.
Not FDIC Insured. No Bank Guarantee. May Lose Value.
© 2014 Forward Management, LLC. All rights reserved.


