It was after midnight. While the sky was clear and the stars were sparkling, there was no moonlight as the moon was new. I walked briskly down the street, but after a long day of sales presentations and meetings, inside I was tired and dragging. On each side of me dark houses loomed. There were no street lights.Â
I whistled. I called softly, not wanting to stir the neighbors, up the winding street and back, and then I retraced the trail all over again.
Occasionally I would hear a stirring, a rustling in the brush. And then a barking dog, but it only retreated as I moved closer to the sound.
Once as I walked back toward home, I heard the soft clicking sound of feet upon the roadway behind. I turned. I waited silently. I called out again, but I could see nothing.
It had been fruitless. I trudged home dispirited, but as I turned up the driveway I could hear the phone ringing. I rushed to the door and grabbed the receiver. It was now 1:30 in the morning and it was my neighbor from up the street.
“Got your dog, Jerry,†Steve said. “She was barking outside our back door. I think it’s your Molly.†Much chagrined, I hurried back down the street and collected Molly from a just-awakened friend. Apologizing profusely, I attached a lead to Molly’s collar, removed the useless electronic fence neck band from her, and silently marched the cowering dog back home.
She knew she’d done wrong, but she just couldn’t help herself.
Four days later the crime was repeated. This time it was in broad daylight, as I witnessed Molly’s arch-enemy, the brown squirrel, lure her off our property.
Molly, of course, came up empty handed (empty pawed?) in her pursuit. She then plunged into the thick brush of the wetlands, as I, in turn, pursued her. This, however, proved her undoing. The only easy exit from the wet and muddy thicket led onto the neighbor’s dock, where she was trapped (between water and a hard place) and captured.
And they say that herding cats is difficult!
Of course, this week’s analogy to the stock market should be pretty straightforward. And it works on a couple of levels.
First, the temptation to leave home is always there and some are easily lured away (“squirrelâ€). Investors flock to risk-managed investment strategies when the market goes through its periodic financial shocks.
In my opinion, that’s the right thing to do. These strategies are designed to minimize the otherwise out-sized stock market losses that occur every three to seven years, wreaking havoc on virtually all investor portfolios. They are meant to protect investors from their worst fears and allow them to return to the better gains normally available in stocks when the latest crisis is abated.
But as the reality of stock market losses for nearly every investor begins to fade from memory, replaced by more and more friends and neighbors enjoying short-term gains (usually just earning back what they have lost), investors are tempted to escape the disciplined bonds of risk-managed investing and take a more speculative romp on the wild side.
When stocks then take their inevitable plunge, they once again seek the safety of some boundaries, and poorer, but not necessarily wiser, the cycle is repeated.
On some level, they know they did wrong, but they just couldn’t help themselves.
That’s the long-term pattern that most investors seem to follow over the full market cycle of rally then bust. Capitulation, then over confidence, and then they return to capitulation yet again.
In the short term, it’s a similar problem, but different. Once burned, investors shy away from equities. Behavioral finance studies show that there are reasons why investors are slow to embrace a new bullish market trend.
The reason is that there is a fundamental difference in the way investors perceive probabilities for gains versus the actual odds of possible returns. For example, a given trend-following strategy may register a profitable trade 50 times out of 100. It still will make money if the gains are large while the losses are small, even though the probability for gains is break even.
Yet studies show that while the odds of a profitable trade in this example are 50%, the average investor will underweight the chance of success. On average, experiments have shown that a 50% probability is viewed as just a 42% chance. That’s just the way our human brains are wired. We overweight small probabilities (the “possibility†effect), and underweight higher probability situations (the “certainty†effect).
Similarly, Molly knows that she gets a small shock every time she crosses over the electronic fence line, yet, she underweights the probability and does it anyway. Maybe that similarity is why dogs are man’s best friend.
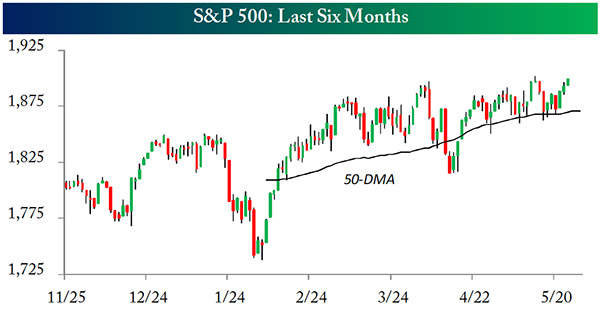
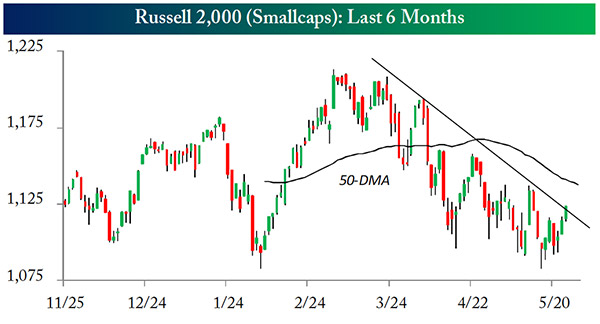
Friday the S&P 500 made a new all-time index record high. This occurred despite the fact that negative news stories continued to jet through the daily news cycle, mid-term elections loomed, earnings were just so-so and small cap and tech indexes had just experienced a greater than 10% correction.
Source: Bespoke Investment Group
Source: Bespoke Investment Group
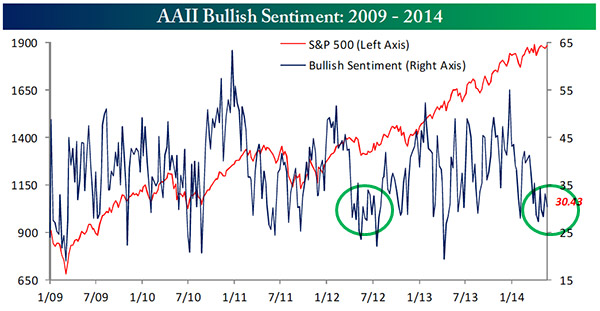
Despite the advice of some (including this columnist) that the long-term up trend continues and to stay the course or, better still, buy the dips, some investors felt the need to flee to cash. Even in the face of multiple new highs this year alone, investor bullish sentiment has been mired in a middling trading range varying just 10% from top to bottom.
Bespoke Investment Group mentioned in its commentary that this has gone on for quite some time (ten weeks, to be exact) and was relatively rare. I thought I’d take a look at what had happened over history during these fairly unusual circumstances.
Source: Bespoke Investment Group
| Â | After 10 weeks of static bullish sentiment |
 | All periods 9/1987-2/2014 |
||||
| Â | 1 month later |
2 months later | 3 months later | Â | 1 month later |
2 months later | 3 months later |
| Average return | 1.78% | 1.68% | 5.52% | Â | 0.64% | 1.32% | 2.01% |
| Positive periods | 26 | 25 | 27 | Â | 844 | 875 | 938 |
| Total | 37 | 37 | 37 | Â | 1375 | 1375 | 1375 |
| Percent positive | 70.3% | 67.6% | 73.0% | Â | 61.4% | 63.6% | 68.2 |
| Worst loss | -3.08% | -8.59% | -5.21% | Â | -28.16 | -34.06% | -37.64 |
Chart: Bespoke Investment Group. Weekly data source: Pinnacle Data. Calculations by Flexible Plan Investments, Ltd.
As you can see, the occurrence of such a period of relative stability of investor bullish sentiment has been on average quite bullish in the intermediate term. The gains have been bigger than normal and they have happened more often. Also impressive is the fact that even when the market has upset the odds and retreated instead of advancing, the extent of the downturn has been moderate.
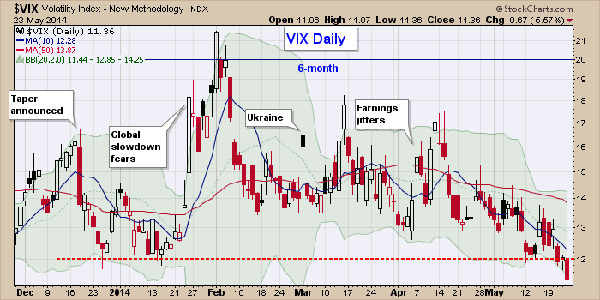
Another interesting chart that I came across this week relates to volatility. The VIX Index is often referred to as the “Fear Index†because it also expresses a view on investor sentiment. The lower the Index the less fearful of the future investors are said to be, while high readings of this option-based indicator are associated with a heightened level of fear.
As the daily chart shows, the VIX closed last week at its lowest level of the year, and, at below 12, one of its lowest levels ever. I checked the history of this relatively rare occurrence as well.
| Â | Six month low in VIX and VIX under 12 | Â | All periods 1/1990-2/2014 |
||||
| Â | 1 month later |
2 months later | 3 months later | Â | 1 month later |
2 months later | 3 months later |
| Average return | 0.21% | 1.78% | 1.94% | Â | 0.65% | 1.32% | 2.02% |
| Positive periods | 30 | 38 | 35 | Â | 3629 | 3781 | 3975 |
| Total | 48 | 48 | 48 | Â | 5889 | 5889 | 5889 |
| Percent positive | 62.51% | 79.17% | 72.92% | Â | 61.6% | 64.2% | 67.5 |
| Worst loss | -3.83 | -4.56% | -3.31% | Â | -28.0% | -38% | -41% |
Chart: Stockcharts.com. Daily data source: Pinnacle Data. Calculations by Flexible Plan Investments, Ltd.
Again, other than a smaller-than-average return in the first month, all of the numbers are equally bullish and the downside risk of being wrong seems limited.
The fact that interest rates continue to trend lower, seasonality remains positive, and we saw breakouts or near breakouts on most indexes last week further supports the bullish case. It would seem to overwhelm the negativity expressed by divergences at the new high in the S&P by measures of market breadth, new highs and lows, and volume, but only time will tell.
However, if you are a client of a dynamic risk-managed investment firm, while these indicators can give comfort and support if your manager is essentially bullish on the market at the present time (like we are), it’s more important that you stay the course, remain at “home,†and follow the advice given.
By quantifying the investment process, the advisor has done all of the work for you. The manager’s methodology has been designed to shift through the indicators and allow the firm to best position your account based on the strategies chosen by you for your individual suitability profile. If your advisor has a long history of success and you have chosen your advisor with care, there is no reason to “run away†when a hazard appears on the trail, or to try something new when an investment “squirrel†darts across your path.
Searching for Molly can be a pain, but finding her is always a joy.
All the best,
Jerry
P.S. – Anyone have an alternative to an invisible fence for a street-wise rescue dog that is much too curious for her own good?


