Just Because the Fed Is Doing the Right Thing Now Is No Guarantee It Will Continue to Do So
The Fed is continuing to slow the growth in the amount of credit it is creating. In December 2013, the year-over-year growth in the sum of Fed outright holdings of securities and its net repurchase agreements (repurchase agreements minus reverse repurchase agreements) was 41.1%. As of May, the year-over-year growth in this sum had slowed to 24.8%. At the same time that growth in Fed credit creation has slowed, growth in commercial bank credit creation has increased. In December 2013, year-over-year growth in the break-adjusted commercial bank credit was 1.0%. As of May, year-over-year growth in break-adjusted commercial bank credit had risen to 3.6%. In the five months ended May, the compound annual growth rate (CAGR) of break-adjusted commercial bank credit was 7.4%. For reference, the median year-over-year growth in monthly observations of break-adjusted commercial bank credit in the past 38 years was 7.0%. As shown in Chart 1, year-over-year growth in the sum of Fed credit and break-adjusted commercial bank credit was 8.5% in May compared to a 38-year median growth rate of 7.1%.
Chart 1
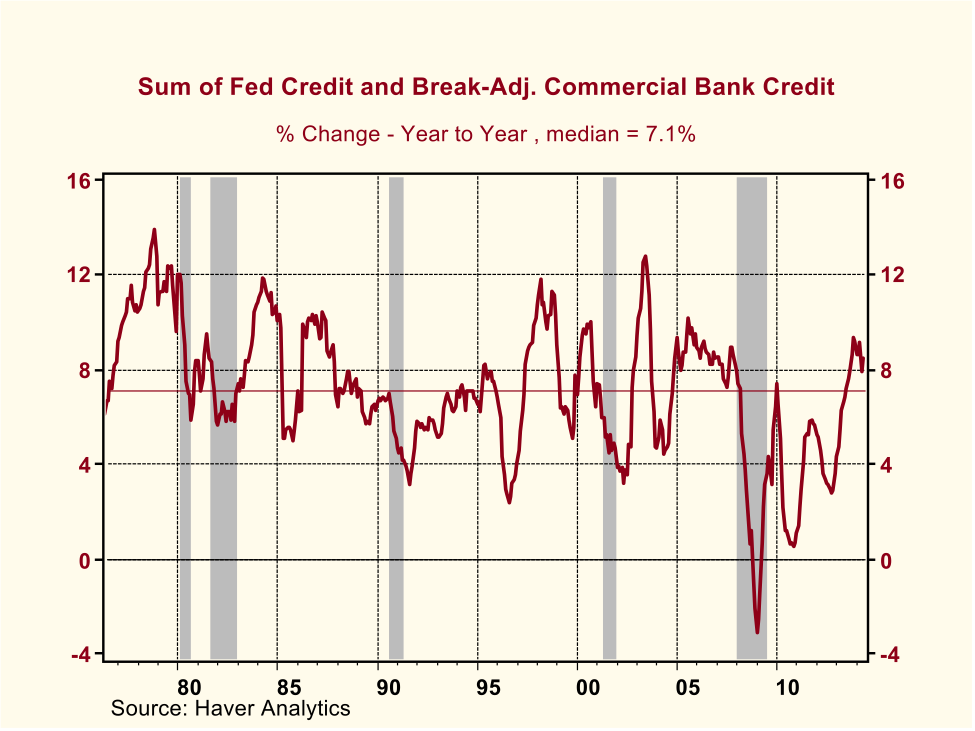
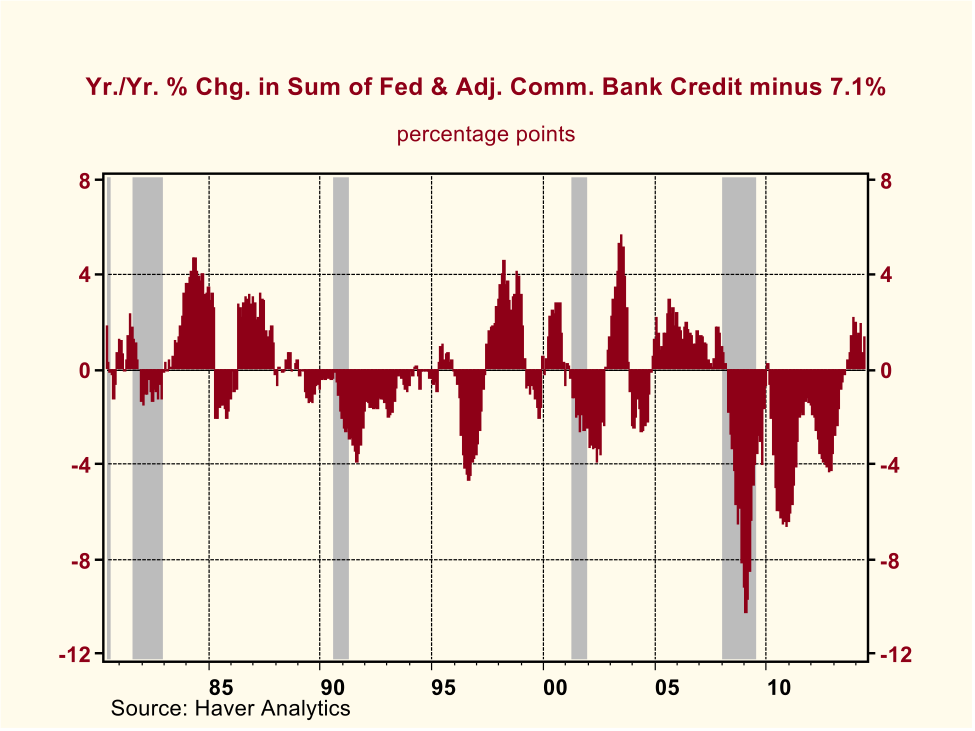
Chart 2 shows the deviation between the year-over-year percent change in the sum of Fed and adjusted commercial bank credit from 7.1%, the 38-year median of the year-over-year percent change in this credit sum. As one can see, the year-over-year percent change in the sum of Fed and bank credit had been “deficient”, often severely so, relative to its median from March 2008 through June 2013, with the exception of January 2010. But, as was stated above, in the 12 months ended May 2014, annualized growth in the sum of Fed and break-adjusted commercial bank credit was 8.5%, 150 basis points above its 38-year median percent change. So, the “drought” in the sum of Fed and adjusted commercial bank credit appears to have been broken with the combination of the resumption of Fed net acquisitions of securities in September 2012 and the recent acceleration in the growth of commercial bank credit.
Chart 2
As a “refresher”, the reason I pay particular attention to this credit sum is that growth in a variant of it has a strong association positive association with growth in gross domestic purchases (defined as gross domestic product plus imports minus exports). The credit variant includes, in addition to Fed credit and commercial bank credit, credit created by saving institutions and credit unions. Commercial banks, saving institutions and credit unions issue deposits that are redeemable at par. Thus, they are referred to as depository institutions. So, my credit variant is the sum of Fed credit and depository institution credit. As I have explained in previous commentaries, what distinguishes this credit variant from other measures of credit is that credit created by the Fed and depository institutions is credit created figuratively out of “thin air.” As such, it enables its recipients (borrowers) to increase their current spending while not requiring any other entity to pare back its current spending.
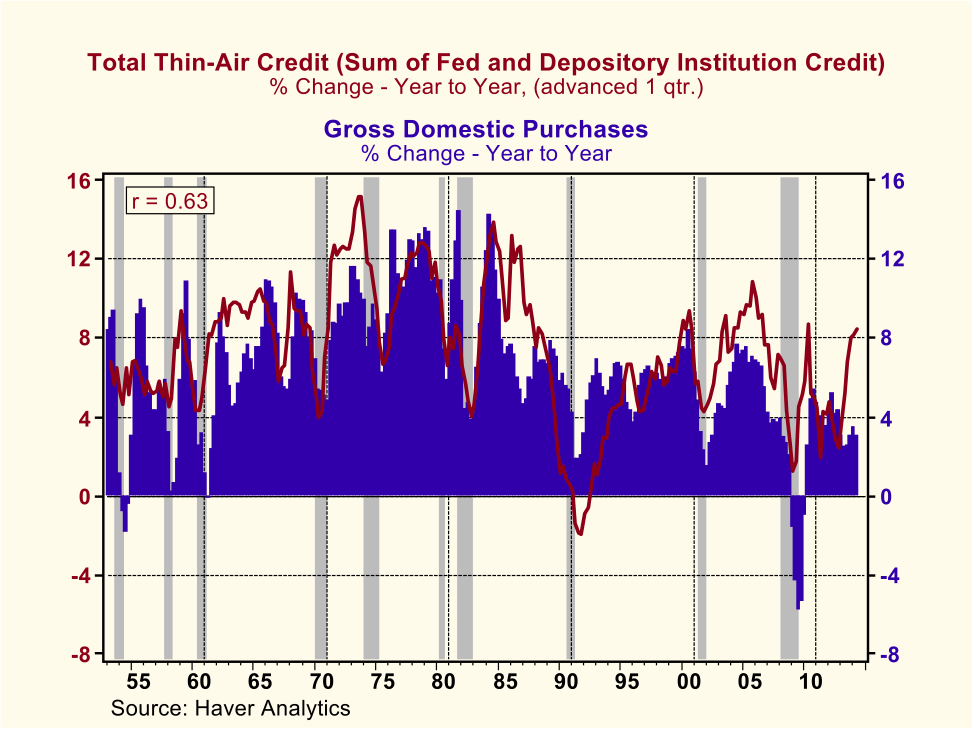
Plotted in Chart 3 are the year-over-year percent changes of quarterly observations in the sum of Fed and depository institution credit along with gross domestic purchases from Q1:1954 through Q1:2014. When the percent changes in thin-air credit were advanced by one quarter, a higher positive correlation (0.63) was obtained than with the two series compared contemporaneously or with changes in gross domestic purchases advanced by one quarter. This suggests that growth in thin-air credit “causes” growth in gross domestic purchases rather than vice versa. Because gross domestic purchases include only purchases of currently-produced goods and services, they do not capture spending or transactions on other things that additional thin-air credit might finance, e.g., purchases of financial assets or previously-produced real assets. I would argue that the correlation between changes in thin-air credit compared to total transactions would be higher than its comparison to gross domestic purchases. Regrettably, I am not aware of a series that measures total nominal transactions.
Chart 3
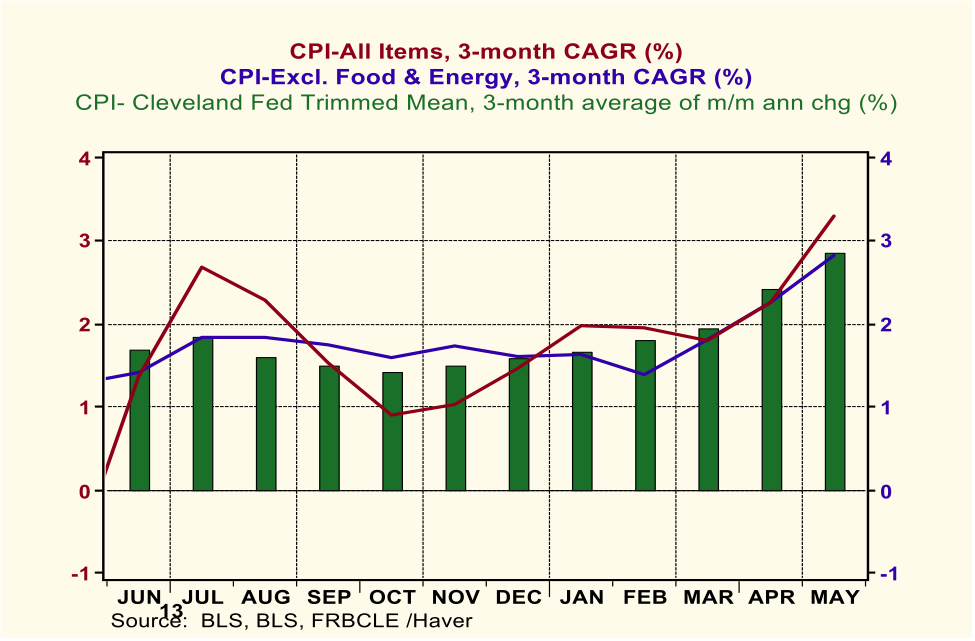
After an economically-depressing, not to mention, psychologically-depressing, severe winter, the U.S. economy appears to be responding predictably to the relatively rapid growth in thin-air credit. Chart 4 shows that both nominal retail spending on goods and the real production of goods have rebounded in growth in recent months. Chart 5 shows that growth in combined new and existing home sales has come roaring back. Chart 6 shows that the least-revised labor market data, the weekly state unemployment insurance benefit data, are indicating an improved labor market environment. Chart 7 shows that U.S. equity prices continue to climb. And Chart 8 shows that no matter how you slice it or dice it, the rate of increase in consumer prices for goods and services is accelerating.
Chart 4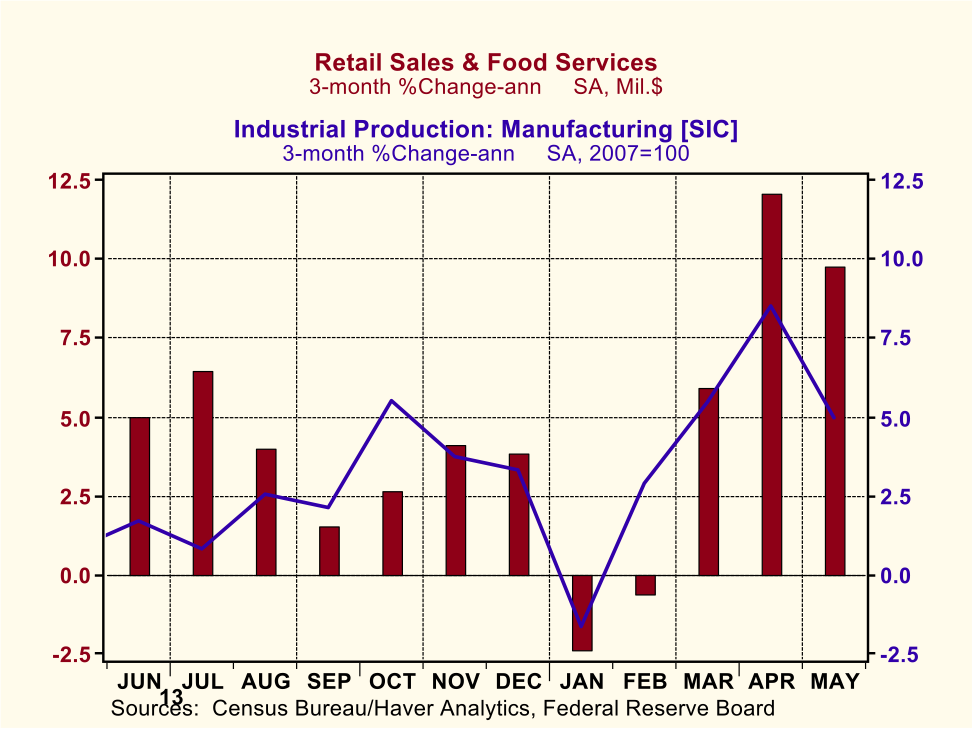
Chart 5
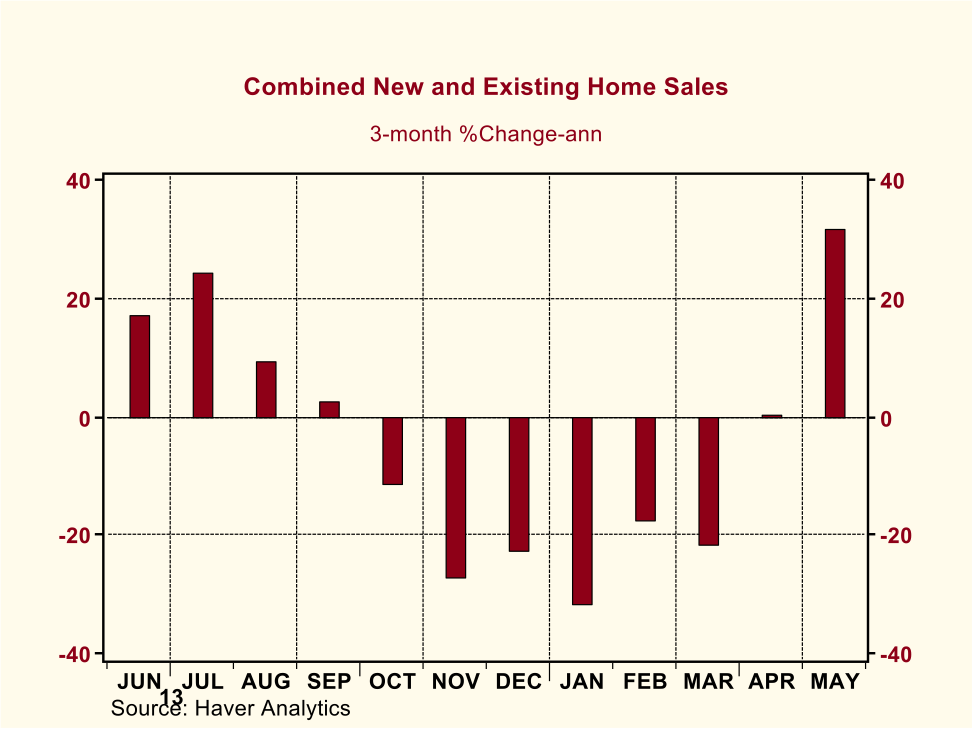
Chart 6
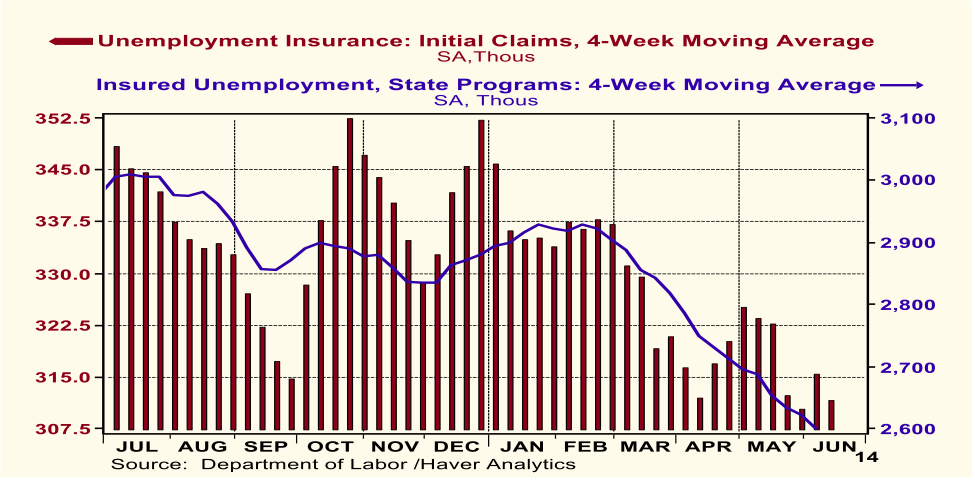
Chart 7
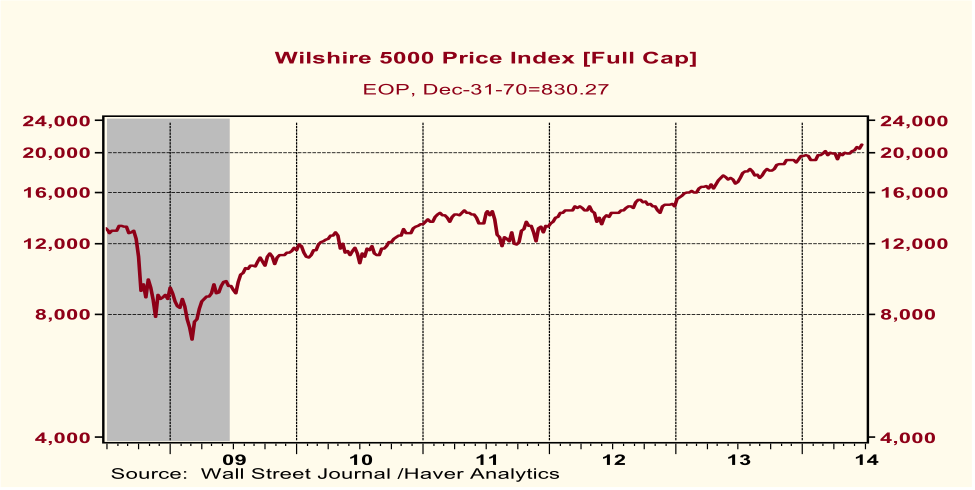
Chart 8
The upshot of all this is that unless the Fed wants to create an undesirable inflationary environment in terms of asset prices and/or consumer prices of goods and services, it is time for the Fed to scale back its creation of credit, which it has been in the process of doing since the January 2014 commencement of its monthly tapering in the net acquisition of securities. The Fed also has stepped up the amount of its reverse-repurchase-agreement operations, which serve to reduce Fed credit, all else the same.
But the Fed pursuing the correct monetary policy today for reasons it does not understand instills little confidence that it will continue to pursue the correct policy tomorrow. When the Fed announced in September 2012 that it was going to resume its net acquisitions of securities, it did not say that it was doing so in order to boost the then anemic growth in thin-air credit. No, it justified the resumption of net acquisitions of securities in terms of lowering the yields on longer-maturity securities. The Fed never publicly explained how it decided that $85 billion of net securities acquisitions per month was the correct amount. Nor did it publicly explain why the $10 billion tapering of net securities acquisitions per FOMC meeting was the correct amount. The Fed continues to be obsessed with the price of credit, an interest rate, rather than the quantity of credit. Moreover, on those rare occasions when the Fed might mention the quantity of credit, it has never made a distinction between thin-air credit and all other credit. But then, neither have many other economic commentators, save for those of the Austrian School.
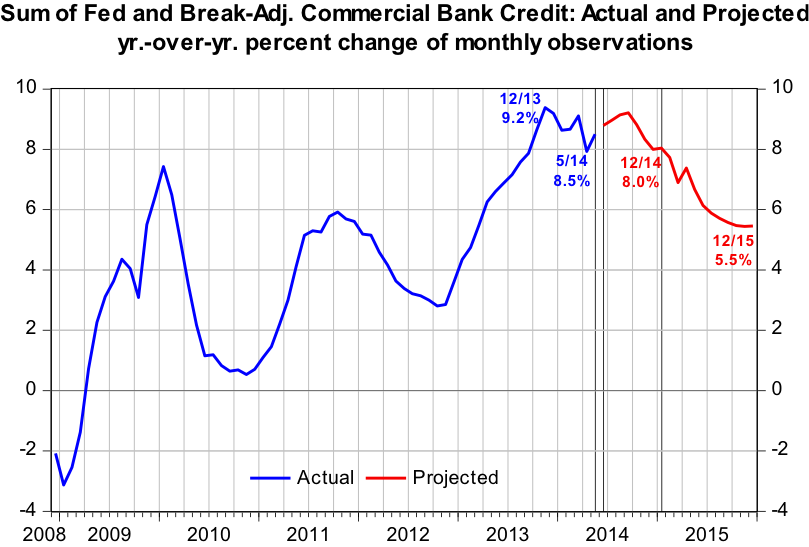
Let’s make some assumptions to give us an idea as to the likely behavior of thin-air credit over the next year and a half. Assume that the Fed continues to taper its net acquisitions of securities by $10 billion per FOMC meeting, implying that by the December 2014 meeting, it would be making no net new outright acquisitions of securities to its balance sheet. Assume that the Fed maintains the amount of its net repurchase agreements at a level equal to that of the average of the first five months of 2014, $245.9 billion. Lastly, assume that break-adjusted commercial bank credit continues to change at a CAGR of 7.4%, its annualized growth rate in the five months ended May 2014. Chart 9 shows the actual year-over-year percent changes in monthly observations of the sum of Fed and break-adjusted commercial bank credit from December 2008 through May 2014 as well as projected values through December 2015 based on the above assumptions.
Chart 9