Whos Mr. Excitement and Whats He Got To Do With Stocks?
Born here in Detroit in 1934, he died just short of 50 years later after lying in a coma for nine years. In 1975 he had a heart attack on stage while singing his hit single “Lonely Teardrops,” reportedly as he mouthed the lyric “My heart is crying.” Much earlier a royalty dispute between his managers had led Barry Gordy to split and form Hitsville USA (Motown records). “Mr. Excitement,” as he was known, thrilled fans worldwide doing the splits and sip sliding across the stage while he sang R&B and soul throughout the fifties, sixties, and seventies.
Selling millions of records, he caused Barry Gordy, who wrote his first two hits, to proclaim that he was "The greatest singer I've ever heard.” And Michael Jackson dedicated his Grammy for the Thriller album to him and his influence on Jackson’s career.
As I watched the stock market last week, one of Jackie Wilson’s greatest hits, later covered and taken to number 2 on the charts by Rita Coolidge and featured in the “Ghostbusters 2” movie, kept repeating in my head:
"Your love is lifting me higher than I’ve ever been lifted before.”
Watch and listen to the great Jackie Wilson here
The stock market did just that last week as new highs were hit by the S&P 500 on both Wednesday and Thursday. But it’s not clear that “love” was doing the lifting. Instead, the market seemed to be climbing the proverbial “wall of worry,” this time created from foreign concerns, a slow economy and fears about the new direction for Fed actions appearing on the distant horizon.
Here at Flexible Plan, though, we were not just celebrating the stock market’s new highs but new all-time highs registered by our FUSION and STF Indexes that are calculated by a unit of the New York Stock Exchange to track seven of our strategy indexes. The six FUSION and one STF indexes are available online through CNBC, Yahoo! Finance, Morningstar Direct, and Bloomberg. (See the FUSION and STF articles later in this issue of the Market Hotline for more details on how to connect.)
Check FUSION Aggressive here and STF here
What’s great about these NYSE Indexes is that you can now follow our indexes daily. And most of these services have the strategy histories back to 1998. That means their hitting new all-time highs now is a very big deal around here.
Indexes themselves are interesting financial market creations. For over 100 years there have been a handful of stock market indexes that investors have watched as a short-hand way of gauging what the stock market was doing. The Dow Jones Industrial Average was the grandfather of them all. But because the average was price-weighted and only included 30 stocks, it was slowly replaced by the broader cap-weighted S&P 500 Index in the years after its 1928 introduction.
As the financial markets grew, more stock indexes appeared, and then bond indexes entered the scene in force. While we thought there had been an explosion in these indexes in the seventies and eighties, we actually “hadn’t seen noth’n yet”!
With the advent of Exchange Traded Funds (ETFs), the number of indexes seemed to climb into the stratosphere. At first the ETFs merely cloned indexes that were already established, like the Dow and the S&P. But as the ETF market matured, the process was reversed. Indexes were created to provide the basis for the creation of an ETF to mirror its behavior.
Funny thing about this proliferation of indexes that we all cite and depend upon, as the fine print always states, they can’t be traded. None of these indexes (including the Dow and the S&P that we see in the newspaper and online) reflect actual trading. But they do show the application of a methodology to a group of stocks or other asset categories. They don’t reflect the expenses of trading (price slippage for large orders, bid-asked spreads, and commissions) and they don’t reflect any associated management fees that always exist in the real world (someone must be paid to compile and trade the index methodology). Nor do they reflect the lack of discipline or process that may exist by one trying to trade the index’s methodology on their own in the face of real world crises.
Jackie Wilson sang, in words that probably resound in every investor’s heart who saw their finances following the stock market indexes lower in 2007-2008:
“Now once I was downhearted
Disappointment was my closest friend.”
Yet, in the song he demonstrated that in the face of disappointment, he stuck with his plan, as he continued:
“But then you, came
and he soon departed
And you know he never
Showed his face again”
While the rebound from the 2008 financial crisis is a similar recovery, I would not use “never” when it comes to the stock market. But sticking with an investment plan through thick and thin is what indexes demonstrate.
This stick-to-it-ness may be necessary in the short run. As I have written since the first of the year, I expect the market to have its first 10% correction yet this year. While this has already occurred in some indexes, like the Russell 2000 Small-Cap Index, and I could claim that my prognostication has already been fulfilled, I do expect to see it occur in the S&P as well at some point. After all, it has been over 1,000 days since we had a 10% or greater set back (the fifth longest time in stock market history without such a downturn).
However, unless you are especially nimble and have your own market timing plan and the discipline to trade it, I have also been recommending that investors ignore such a possibility and stick with their stock investments.
I base this on the fact that none of the longer-term indicators that we follow have turned south. And just as we are in the fifth longest time without a correction, there have been four other times when the wait for such an occurrence has been even longer.
Yet there are a number of indications that stocks may be peaking in the short term. We are overbought (the market has moved higher much faster than average and may need to cool off), many indicators of market breadth, volume, and volatility are not as strongly positioned as the indexes, and seasonality is especially weak during the next two weeks (historically prices have fallen more often than they have risen during this period).
Still, we stay focused on other indicators. Second quarter earnings and revenue reports continue to come in, and over 60% of companies are beating analyst estimates on both concerns.
Interest rates remain low. Investors must ask themselves, “Would they rather buy a 10-year government bond yielding about 2.5%, or S&P 500 stocks that are averaging 80% of that yield and have the potential for price appreciation?” The comparisons overseas are even more attractive for stocks of countries like England and Germany, where average stock yields actually surpassed their comparable government bond yields.
The intermediate- and long-term price trends remain solidly bullish, and bullish market sentiment of investors remains inexplicably low in the face of the new market highs being experienced by the S&P 500 and our FUSION and STF Indexes. And the percent bearish actually exceeds the percentage of bulls. No overconfidence being exhibited here!
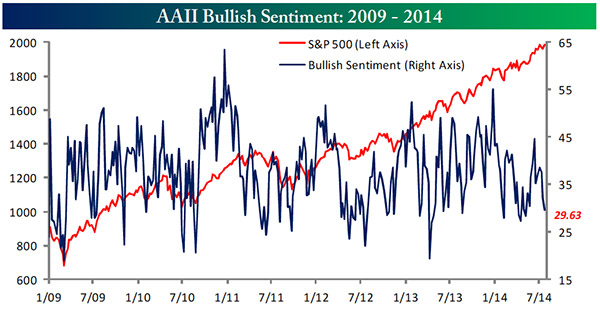
Source: Bespoke Investment Group
Finally, I have been reporting for more than a month that reports on the economic state of our economy have been decidedly negative. More reports have disappointed than have exceeded expectations. Last week that changed. Although we only had fifteen reports, ten beat economists’ expectations. This week we have over 30 reports slated. We will see if this new direction can continue and become the basis of a new trend and support a resumption in the quest for “higher and higher” new highs.
When we created the FUSION and STF Indexes, we took our FUSION and STF methodologies and applied it to actual account results and real world asset class indexes that all pre-existed our methodology. All the indexes do is apply the trading methodology to real-world numbers in the past to give us an idea of how that methodology would have traded in the past market environments.
While we have traded the underlying STF (2009) and FUSION (2013) methodologies for quite some time, the new indexes open up a new transparency for investors thinking about using them. Now as these methodologies continue to be traded by us in the real world, a benchmark index is posted daily to allow the world to watch their progress. So far, as Jackie sang, they keep lifting us “higher and higher.”
All the best,
Jerry
PS: For more on Jackie Wilson’s life, here’s an early ABC report:
Jackie Wilson – The man behind the music


