The current environment for stock investors can be trying. Global cross currents regarding economic growth, employment, government policy, and corporate earnings have created the first test of investors’ mettle in almost two years. We have an opportunity to use current market events to review our investment plan and check our emotional temperature.
Still No Correction
There are many adages in the investment business that relate to how investors overreact to market turmoil. In recent days, I’ve seen many of these quoted. Perhaps one of the most appropriate now, is one from Mark Twain who said, “October: This is one of the peculiarly dangerous months to speculate in stocks. The others are July, January, September, April, November, May, March, June, December, August and February.” (Keep in mind that Mark Twain was a famously horrible investor who was near penniless when he died.) Mr. Twain was right in one sense; October is one of the worst months for stock market volatility and performance. I’ve also seen a plethora of articles talking about how famous investor Warren Buffet waits for times of panic to make sound investments. His famous quote is “be fearful when others are greedy and greedy when others are fearful.”
I am not suggesting that the current volatility is a market panic, far from it, and that’s the point. The U.S. stock market is up over 190% from the March 2009 low. We haven’t seen a sizable correction in the stock market since 2011. Using the S&P 500 stock index to assess the rise in stock prices that began in August of 2011 through the recent peak in September, we see the stock market was 79% higher. We’ve had a couple of corrections during this period. The summer of 2012 saw a market decline of approximately 9.75% and in October of 2013 the market declined by 7%. Not one correction of 10% during that period. The current decline from September’s peak is approximately 7%.
That is a long time to go without a significant decline. Instead, the U.S. stock market has been making new highs as domestic economic growth improved and investors saw corporate profit margins remaining elevated. The stock market rally during the last two and a half years also has the potential to lull investors into a false sense of security. In the last six trading days, we’ve seen five days with the market moving up or down 1 to 2%. The reasons for this volatility are many and we discuss them in this quarter’s Financial Insights.
Behaviorally Driven
I have been a student of behavioral finance for many years. This discipline provides a psychological backdrop as to how investment decisions are made. One of the first things I learned studying this was that investors tend to become anchored by their most recent experience. That is to say that if an investment does well for them, they believe it will continue to do well even if there is evidence to the contrary. It also leads to investors ignoring (or perhaps forgetting) about the volatility inherent in a particular type of investment.
It isn’t that the current environment isn’t uncomfortable, it is just important to recognize that it is part of being a stock investor. We know that over longer periods of time, stocks trade on fundamental information tied to company earnings performance and the pace of economic activity. We also know that there are periods of time when stocks trade on the basis of either irrational expectations or confusion regarding the information provided at the present time.
Because stock prices are no more than a reflection of the present value of future corporate earnings discounted by an interest rate, we know that when either earnings or interest rates become harder to predict they can become more volatile. The divergences in global policy and earnings expectations are the primary cause of the recent turmoil.
Market Timing
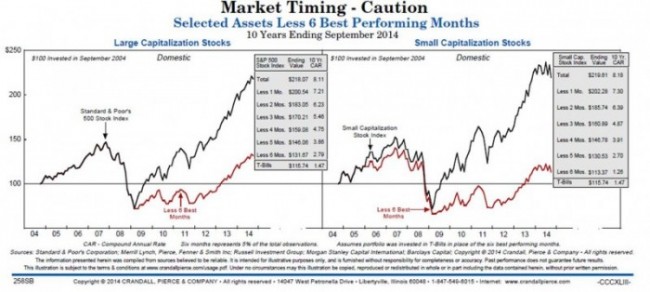
So why not significantly alter your equity allocation when signs of volatility take place? The chart below looks at the performance of large and small capitalization stocks over the last ten years, with and without the best performing six months. As you can see, if you remove the best six months of large cap stock performance your return is 2.79% annualized versus 8.11%. For small cap stocks it is 1.26% versus 8.18%. We are big believers in understanding relative value among asset classes and their segments and allocating capital on that basis. We do not believe that wholesale shifts among asset classes are neither prudent nor possibly successful given the importance of not missing out on 180 days of 3,650.
Finally, you have an investment policy statement. Now, when markets begin to become more volatile, is the time to check in on the emotional quotient you indicated in that risk profile. Am I or is my organization still comfortable with our policy statement? Note that is not the same question as ‘Am I nervous today?’ Rather, it is a reference to the fact that when establishing your policy allocation you thought about your time horizon and objectives. If those remain the same, so too should your policy allocation.


