Following the market declines in 2008 and 2009, many investors have shown interest in alternative investment strategies such as hedge funds and mutual funds that employ hedge fund-like strategies. These types of strategies have been around a long time, but until recently their use among individual investors has been somewhat limited. So, investors and their advisors have had to tackle a series of new challenges, such as trying to identify good managers or determining what is a reasonable allocation to alternatives. Some investors have been disappointed by the performance of alternative investment strategies. Part of their disappointment can be attributed to the fact that stocks have been in a very persistent bull market with very low volatility, which is a challenge for any strategy that utilizes a hedging activity. However, I believe the problem may be that most investors have struggled with understanding how to allocate to alternative investment strategies and that poor allocation decisions have led to less-than-optimal portfolio results.
I think that many investors have elected to view alternative investment strategies as a separate asset class from stocks and bonds and have cut out a portion of their portfolio to allocate to one or more strategies. In reality, hedge funds and their mutual fund brethren are in fact stock and bond investments that are executed differently than traditional funds. Therefore, investors should still consider alternative investment strategies to be stock and bonds and allocate to them to enhance their overall allocation strategy. Let’s look at a way that we could use hedge funds to complement a traditional allocation strategy.
Forming an opinion on market conditions
The most important part of determining an allocation is to have an opinion about the market conditions (i.e., bull or bear market). There are dozens of ways this can be accomplished, but I am partial to using something akin to the Sharpe ratio to determine market conditions in which I use 100 day percentage change and its standard deviation to normalize average return per unit of risk. I calculate this for each month-end; any reading above zero is a bull market and any reading below zero is a bear market for the coming month. Here are the results of applying a monthly market condition analysis to the MSCI ACWI:
Market Performance Using a Monthly Market Condition Analysis
|
|
Total Return |
Standard Deviation |
Max Monthly Gain |
Max Monthly Loss |
|
Bull |
7.53% |
12.96% |
9.52% |
-14.15% |
|
Bear |
-2.08% |
20.03% |
11.48% |
-19.91% |
|
MSCI ACWI |
4.52% |
15.50% |
11.48% |
-19.91% |
Source: Bloomberg, 12/31/89 – 09/30/14.
This hypothetical example is for illustrative purposes only and does not represent the returns of any particular investment. Past performance does not guarantee future results.
As you can see, this method has definitely been able to separate good markets from bad markets and is a way that an investor can determine how to adjust allocations based on market conditions. Let’s now take this market condition analysis and apply it to hedge funds. Below is an analysis that takes the market condition of the MSCI ACWI as discussed above and examines the performance of the HFRI hedge fund indices in the month following each market condition. The results are summarized below:
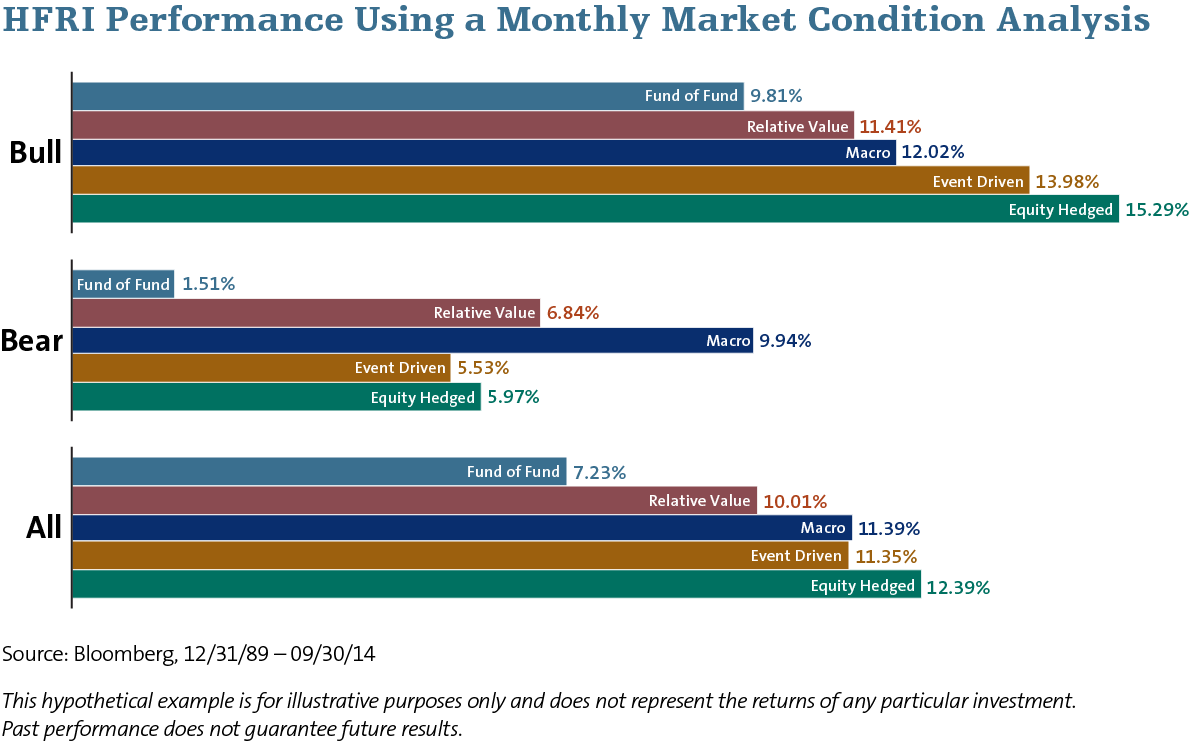
As shown in the table, during bull markets for stocks, equity hedged and event driven strategies perform the best. During bear markets, macro and relative value strategies tend to perform best. This makes sense since relative value strategies tend to use bonds, and managed futures strategies are in the macro category. So, an investor can use this knowledge to guide their allocations based on market conditions.
In Part 2, I will show how an investor can actually execute on this idea.
In part 1 of this series, I introduced a simple way to identify when we are in a bull or bear market. I then took this method and examined how certain types of hedge funds have performed in each of these market conditions. This week, I am going to use this information to propose a simple allocation strategy that an investor could employ in order to determine which alternative strategies (or alternatives) should be used and where to deploy them in the portfolio. First, let’s look at how most investors use alternatives today.
Most common use of alternative investments
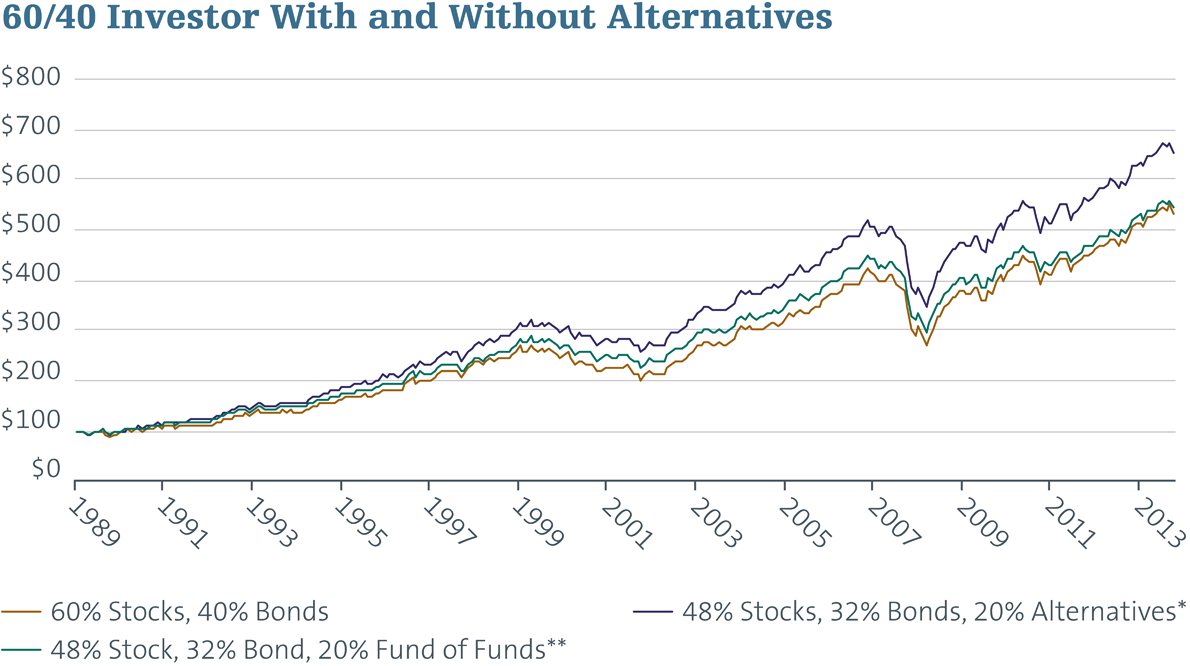
Many investors and their advisors have approached allocating to alternatives as if they were a new asset class. In other words, the allocations to asset classes include stocks, bonds, cash and alternatives. One such allocation might proportionately decrease allocations to stocks and bonds in order to include a broad mix of different types of alternatives. For example, an investor with 60% stocks and 40% bonds might move to a mix of 48% stocks, 32% bonds and 20% alternatives (see chart below). For reference, I also included the use of fund of funds since they represent a professionally managed mix of alternatives.
|
|
Total Return |
Vol. |
Max Monthly Return |
Min Monthly Return |
Sharpe Ratio |
Opportunity Cost |
|
60% Stocks/40% Bonds |
6.99% |
10.19% |
7.50% |
-13.30% |
0.38 |
0.00% |
|
48% Stocks/32% Bonds/20% Alts* |
7.90% |
9.00% |
6.90% |
-11.90% |
0.53 |
-3.21% |
|
48% Stocks/32% Bonds/20% Alts** |
7.09% |
8.84% |
6.60% |
-11.90% |
0.45 |
-4.05% |
Sources: Bloomberg and HFRI, 12/31/89-9/30/14
*The alternatives portion is allocated equally to the following HFRI indices: Equity Hedged, Relative Value, Macro and Event Driven.
**The alternatives portion is allocated to the HFRI Fund of Funds Composite Index.
This hypothetical example is for illustrative purposes only and does not represent the returns of any particular investment. Past performance does not guarantee future results.
As the analysis illustrates, using alternatives as a separate asset class is a pretty good method, although it appears that it is better to just choose a broad basket of equally weighted strategies rather than using a fund of fund strategy. However, in both cases the return was more desirable than the fixed 60% stock/40% bond strategy, and the volatility and capital drawdown were better.
The issue of allocating to alternatives in this way isn’t really the long-term characteristics of this approach, but rather the “opportunity cost” of using alternatives. To analyze this cost I calculated the annualized return of those months where using alternatives underperformed the simple 60/40 mix. On average the equally weighted mix of alternatives missed by 0.27% roughly 47% of the time. So, as an investor, you have to ask yourself if that opportunity cost is worth the additional 0.81% of annualized return. Some investors might just shrug at the benefits of including alternatives, especially when you consider the extra time needed to research, monitor and manage alternatives. This is why I think there is a better approach to managing your alternative allocations.
A dynamic approach to allocating alternative investment strategies
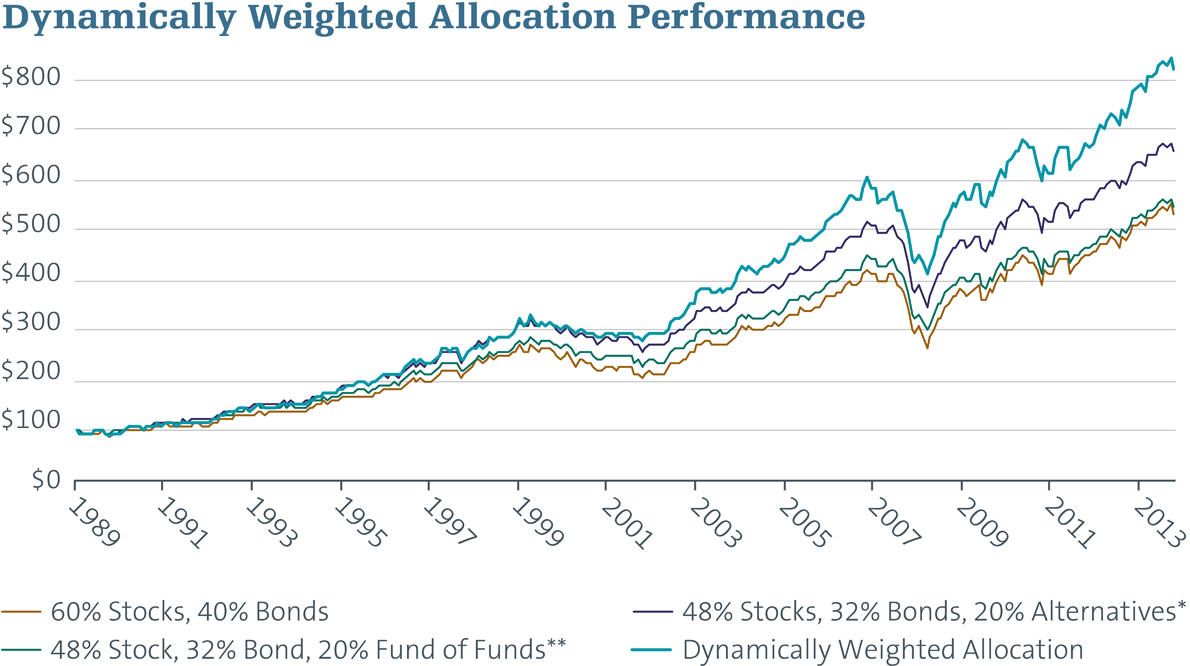
As I discussed last week, I think that investors would benefit from thinking about alternatives not as a separate asset class but as an extension of stocks and bonds. In fact, most alternatives use stocks and bonds but also include various hedging techniques. With that in mind, I looked at allocating to more equity-oriented strategies (HFRI Equity Hedged Index and HFRI Event Driven Index) when the market conditions indicator is bullish, and to more defensive strategies (HFRI Macro Index and HFRI Relative Value Index) when the market conditions indicator is bearish, taking from bonds in a bull market and stocks in a bear market. Specifically, my mix in a bull market is 40% stocks, 20% bonds, 10% equity hedged and 10% event driven. In a bear market, my mix is 20% stocks, 40% bonds, 10% relative value and 10% macro. This is referred to as the dynamically weighted allocation in the chart below.
|
|
Total Return |
Vol. |
Max Monthly Return |
Min Monthly Return |
Sharpe Ratio |
Opportunity Cost |
|
60% Stocks/40% Bonds |
6.99% |
10.19% |
7.50% |
-13.30% |
0.38 |
0.00% |
|
48% Stocks/32% Bonds/20% Alts* |
7.90% |
9.00% |
6.90% |
-11.90% |
0.53 |
-3.21% |
|
48% Stocks/32% Bonds/20% Alts** |
7.09% |
8.84% |
6.60% |
-11.90% |
0.45 |
-4.05% |
|
Dynamically Weighted Allocation |
8.86% |
9.36% |
7.90% |
-10.00% |
0.61 |
-3.95% |
Sources: Bloomberg and HFRI, 12/31/89-9/30/14
*The alternatives portion is allocated equally to the following HFRI indices: Equity Hedged, Relative Value, Macro and Event Driven.
**The alternatives portion is allocated to the HFRI Fund of Funds Composite Index.
This hypothetical example is for illustrative purposes only and does not represent the returns of any particular investment. Past performance does not guarantee future results.
As you can see, the dynamically weighted allocation approach delivers the best results pretty much across the board: highest return, lowest capital drawdown and highest Sharpe Ratio. Additionally, the opportunity cost is fairly comparable (although higher) to the fixed allocation method with an average monthly miss of 0.33%, but less frequent at 41% of the time. This is actually 16 fewer months of underperformance compared to the fixed allocation method. In this case, an investor would realize an increased annual return of 1.87%, which is probably worth the headache of the extra time and effort needed to manage the managers and allocations of the alternative strategies. This method is, of course, not a silver bullet. I would suspect that with some additional effort in refining the market signal and expanding the list to include the substrategies in the HFRI universe, an investor could probably improve returns, volatility and even the opportunity cost. However, I think this is a great starting point in developing your own approach to allocating to alternatives and I hope you find it useful.
RISKS
Investing involves risk, including possible loss of principal. The value of any financial instruments or markets mentioned herein can fall as well as rise. Past performance does not guarantee future results.
This material is distributed for informational purposes only and should not be considered as investment advice, a recommendation of any particular security, strategy or investment product, or as an offer or solicitation with respect to the purchase or sale of any investment. Statistics, prices, estimates, forward-looking statements, and other information contained herein have been obtained from sources believed to be reliable, but no guarantee is given as to their accuracy or completeness. All expressions of opinion are subject to change without notice.
Alternative strategies typically are subject to increased risk and loss of principal. Consequently, investments such as mutual funds which focus on alternative strategies are not suitable for all investors.
Asset allocation does not assure profit or protect against risk.
Nathan J. Rowader is a registered representative of ALPS Distributors, Inc.
One cannot invest directly in an index
Sharpe ratio is a ratio developed by Nobel laureate William F. Sharpe to measure how a fund performs relative to the risk it takes.
MSCI ACWI (All Country World Index) is a free float-adjusted market capitalization index that is designed to measure equity market performance in the global developed and emerging markets. One cannot invest directly in an index.
HFRI Equity Hedge Index maintains positions both long and short in primarily equity and equity derivative securities.
HFRI Event-Driven Index maintains positions in companies currently or prospectively involved in corporate transactions of a wide variety including but not limited to mergers, restructurings, financial distress, tender offers, shareholder buybacks, debt exchanges, security issuance or other capital structure adjustments.
HFRI Fund of Funds Composite Index is an equal-weighted index comprised of fund of funds. The index includes over 600 constituents, both domestic and offshore funds.
HFRI Macro Index maintains positions in a broad range of strategies in which the investment process is predicated on movements in underlying economic variables and the impact these have on equity, fixed income, hard currency and commodity markets.
HFRI Relative Value Index


