Our overarching belief that emerging markets’ macroeconomic fundamentals are much better now than they were during the crisis-prone years of the late 1990s/early 2000s has guided our views on the asset class over the past several years.
First, most emerging-market countries today have floating, rather than fixed, exchange rates. This allows currency moves to release pressure that might develop due to fundamental imbalances. For example, if a country’s terms of trade are deteriorating (i.e., becoming less competitive), currency declines help correct that imbalance. Declines in currency also help fix the current account deficit problem. In the past, most emerging-market countries had fixed-exchange rates, so there was no pressure-release valve leading to larger imbalances in the economy and ultimately larger devaluation events.
|
|||
| Source: IMF. Data as of April 2015. | |||
|
|||
| Source: IMF. Data as of April 2015. |
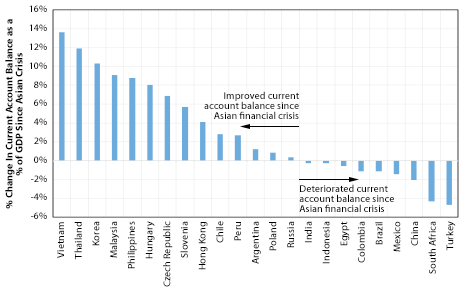
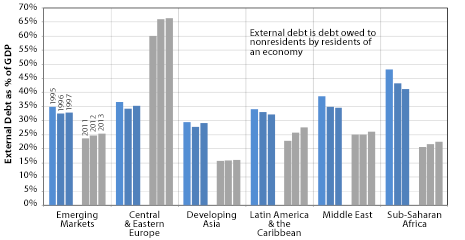
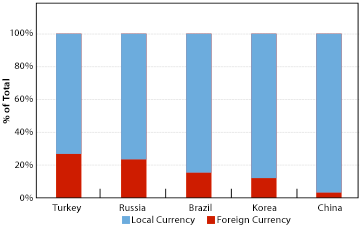
Second, an economy’s dependence on foreign capital is a function of their current account deficit and their external debt burden, especially debt denominated in a foreign currency (typically in U.S. dollars). Today, the current account balance for most emerging-market countries has improved (see “Current Account Balances Have Largely Improved” chart to the right). External debt burdens in most emerging-market countries are lower today than in the mid- to late 1990s (see “External Debt Burdens Across Emerging-Market Regions” chart to the right). Importantly, the risk of a U.S. dollar rise contaminating emerging-markets’ balance sheets is lower today than in the past as the proportion of emerging-markets sovereign debt in U.S. dollars has declined significantly since 2000 (per tradable debt figures from the Ashmore Group). However, there are some countries where debt burdens have risen substantially, such as Korea, Brazil, China, and Turkey, and some of this increase is in the form of dollar-denominated corporate debt (more on this risk factor later in the commentary). But unlike the late 1990s, the vast majority of private-sector debt is in local currencies, not U.S. dollars (see “Foreign Currency Loans” chart below). As a result, these countries’ external liabilities do not shoot up astronomically when their currencies decline versus the U.S. dollar. This is in contrast to the late 1990s, when the rapid rise in dollar liabilities forced emerging-market countries to spend their foreign exchange reserves to stem the currency declines, which made them vulnerable to further currency weakness. It also forced them to raise interest rates sharply (to attract investors via higher yields and to counter inflation resulting from a weak currency) at a time when their economy was already slowing, leading to a much sharper economic downturn and recession. This belief that emerging markets are unlikely to suffer the sort of sustained crises they suffered in the late 1990s is an important factor why, after the recent price declines, we believe emerging-markets stocks have become sufficiently attractive to warrant a modest overweighting in our portfolios. We walk through our thinking and assumptions in detail below.
|
|||
| Source: IMF, Capital Economics. Data as of latest available. |
Quantifying the Potential Impact of a China-Risk Scenario
We first expressed our concern about the risks posed to emerging markets by China’s massive infrastructure spending and credit boom in 2011. This was the main reason why we did not overweight emerging-markets stocks in our conservative models over the past few years even though in some scenarios we believed returns could be attractive in both absolute and relative terms (compared to other equity markets).
As time progressed, this scenario started to gain more importance in our thinking as we started seeing signs of it playing out. We saw economists, buy-side portfolio managers, and sell-side analysts ratcheting down their China growth expectations. Even the Chinese government was guiding growth lower. Finally, we saw the Chinese government taking steps to rein in credit growth and curb speculation in the property market—which we considered an acknowledgement that this had been a problem. In order to quantify what this scenario might mean for emerging-markets stock fundamentals and prospective returns, we developed a specific bearish China-risk model in early 2014. The goal of this model was to help us identify when emerging-markets stocks may have already priced in much of the bad outcomes/news and when they may have become attractive.
At the outset it was not obvious to us how to go about quantifying the China-related risks in a way that relates to our normalized earnings growth and valuation framework, looking out five years. There was a lot of talk about the risk of China’s “hard landing” versus a government-engineered “soft landing,” but the specific characteristics of these landings are open to interpretation. We knew the hard-landing camp was in the minority and whatever growth number they had in mind would be quite below current consensus. So if we started to see consensus GDP growth numbers for China start to fall by a lot, which would under normal circumstances impact asset prices as well, we would know a hard-landing scenario was getting priced in, to some extent at least. We also knew we had no idea how to directly link, say, 4% GDP growth versus 9% GDP growth to fundamentals that matter to us, such as earnings growth five years out. So we did not spend any mental energy trying to figure out China’s GDP growth numbers or what a hard landing equates to in terms of GDP growth. (This shouldn’t be surprising to anyone who understands our investment approach—we are not economists, and we don’t prognosticate macro variables such as GDP growth.)
As is always the case, the bottom line for us when it comes to analyzing equity asset classes, is gauging (1) what the normalized earnings power for emerging-markets stocks might be, (2) where we currently are in relation to that normalized level, and (3) how fast we can expect normalized earnings to grow over our five-year tactical horizon. When assessing these variables, we are learning from history and factoring in, broadly speaking, the various economic outcomes and earnings scenarios we may experience in the future. This analysis gives us an estimate of earnings growth and a normalized earnings level or number five years out. There’s no exact science as to our time frame: we believe it’s a sufficiently long period to look at earnings cycles. We know earnings may normalize sooner or later, but we can’t be confident about exactly when. Once we’ve figured out earnings, we assess what would be a fair price-to-earnings multiple to place on this normalized earnings level, once again informed by history and factoring in the broad macro environment.
Then we ask ourselves whether we’re confident in the probability that this one earnings and valuation scenario will play out. The answer typically is no. This leads us to our scenario analysis approach. We try to come up with other plausible scenarios that help us capture the likely range of outcomes. But we also know that the actual outcome may well vary from the three or four scenarios we come up with. So qualitatively we often think about sub-scenarios, and they sometimes influence our portfolio management decisions. When they become prominent in our minds we share them, as we did with the China-risk scenario we were weighing for a while before making it a formal part of our scenario analysis.
In terms of how we gauged the normalized earnings power five years out for emerging-markets stocks in this bear-case scenario, we first acknowledged that if there’s a good chance our concerns related to China are playing out, then China and the rest of the emerging-market countries, through direct and indirect linkages to China, probably overearned for some period of time. As a result, we realized our previous base case scenario assumptions (before we specifically factored in the China-risk scenario) may have overstated the normalized earnings power of emerging-markets stocks. (Our previous base case return estimate is now the upper end of our base case return range.) So, the two key questions in front of us were: when did this overearning start to happen, and from that point forward what more conservative normalized growth rate should we use instead? While such questions are important because they have a significant impact on our return estimates, we also know that we won’t get it exactly right given the many factors that influence the actual outcome.
To answer the question of when emerging-markets stocks might have started overearning due to unsustainable demand from China, not to mention unsustainable debt-driven demand from the developed world, we decided to analyze the data as far back as the early 2000s, ultimately settling on December 2004 as a starting point. Our qualitative reasoning is listed below:
- When normalizing, it’s important to identify when the mid-cycle for earnings might have been. Taking the trough or the peak as a starting point is likely to yield either overly conservative or overly optimistic results, respectively. In the early 2000s, emerging-market economies and earnings were significantly depressed as they were recovering from the Asian crisis and the Russian ruble devaluation crisis, which was soon followed by the Argentine peso crisis and global slowdown that lasted into 2002. Looking at earnings levels a couple of years later (i.e., 2004) reduces the risk of using trough earnings. Even a couple of years out from these crises, earnings were still quite a ways from their ultimate peak.
|
|||
|
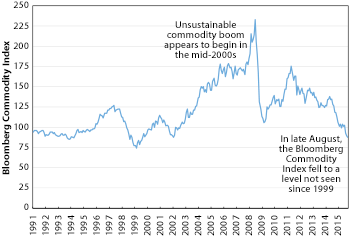
Source: Bloomberg. Data as of 9/30/2015.2. 2. We also had a sense that the commodity boom began to expand more significantly around that time, in good part due to China’s massive growth and/or expectations of such going forward. We can’t really know for certain when the unsustainable parts of the boom started, but from our experience in talking to fund managers, late 2004 seems a reasonable starting point. Also, the Bloomberg Commodity Index (see chart to the right) suggests this to be roughly the case. Some may argue the commodity boom started earlier, and we may not be adequately factoring that in. But, we’d counter that it’s unreasonable to assume all of China’s expenditure in infrastructure and the resulting demand for commodities since the early 2000s has been wasteful. That assumption just doesn’t jibe with what China as an economy has been able to achieve since then and what we hear at the micro level from bottom-up stock pickers, many of whom continue to believe in China’s growth prospects and its significant contribution to global growth, and in turn commodity demand, over the very long term. |
The next question was what reasonable normalized or trend earnings growth rate should we assume for emerging markets starting from December 2004? (For this scenario we basically ignore what happened to earnings thereafter and completely divorced ourselves from the assumptions we made in our previous base case. This was our way of looking at emerging-markets stocks with a totally fresh perspective.) We decided to use 5% as an adequately conservative number for reasons listed below:
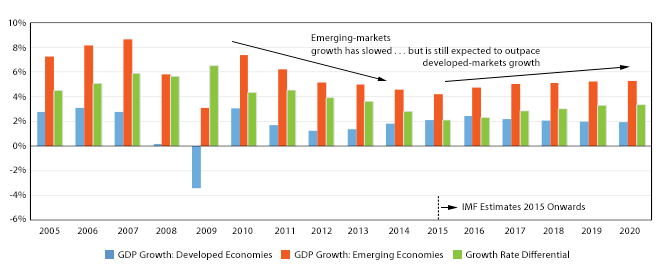
- We use a 6% or so nominal earnings growth rate assumption for much of the developed world in our base case modeling. A 5% nominal growth rate for emerging markets over long periods seems reasonable in relative terms. Even in a slowing global world, where emerging-markets growth has also slowed, most emerging-market countries are still growing faster than the developed world (see chart below). This faster growth acts as a tailwind to sales growth over the long term, although we acknowledge not all of it flows through to the bottom line of emerging-markets stocks due to relatively poor corporate governance, greater shareholder dilution, etc. So, a 5% number passes the initial screen for reasonableness.
|
||
| Source: IMF. Data as of April 2015. |
- To further test the validity of this assumption, we closely examined the available data. There isn’t a long data history for emerging markets, which generally means we are more liberal in discounting what the data tells us, especially if our goal is to come up with an adequately conservative scenario that is also actionable. (It would be easy to come up with a more bearish scenario; so much so that it could lead to inaction, and we’d never get an opportunity to make money for clients.) So what did the data tell us?
- For context, we looked at a relatively longer earnings history of 20 years (this is the history available to us). The data showed emerging-markets stocks have actually compounded trend earnings at a 9%-10% rate in nominal terms over this time frame. We thought almost halving the observed rate did a good job of discounting the overearning that might have taken place. We also thought it properly accounted for the modeling risk stemming from making earnings-growth assumptions based on such short data history (20 years history is short in our opinion).
- According to Capital Economics Group, over the past 20 years, emerging-markets stocks have grown real earnings at a trend rate of over 6%. Emerging-markets inflation over the past 10 years has averaged around 4.5%-5%. This means our nominal earnings growth rate assumption of 5% implicitly assumes emerging-markets real earnings growth of nearly 0% for the past 10 years, significantly lower than observed history. We also assume 5% nominal growth five years into the future. Even if inflation were lower than observed in the past 10 years, it would still imply a relatively conservative real earnings growth number relative to observed history.
The next important assumption in our modeling is what P/E multiple to apply to our estimate of normalized earnings five years out (the product of the two gives us a price level five years out, which gives us the price return we can expect to which we add dividends to arrive at our total return estimate). We decided to stick with the 13x we originally applied in our old base case scenario for the following reasons:
- It is slightly below the average and median P/E observed during the nearly 20-year emerging-markets history available to us.
- It assumes an approximate 25% discount versus U.S. stocks (we apply a 17x P/E multiple to our normalized earnings estimate in our base case scenario for U.S. stocks). Historically, emerging-markets stocks have traded at an average and median discount of about 25%. (During the past two years, emerging-markets stocks have traded at a discount of over 30% versus U.S. stocks, with the recent end-of-August reading showing a discount of nearly 40%, based on Bloomberg data.). This includes the 50%-plus discounts they traded at during the crisis periods of the late 1990s and early 2000s. Because we believe that emerging-markets’ fundamentals are better than they were in the late 1990s and that emerging markets are unlikely to suffer through similar crises and contagion now, we think a 25% historical average/median discount delivers a conservative number to use looking forward.
Based on simple math, we get low double-digit returns in the bearish scenario we laid out above. These returns are comparable to what we expect from U.S. stocks in our optimistic scenario and from European stocks in our base case scenario. This means the risk/reward of adding to emerging-markets stocks is now attractive. (See our updated asset class returns estimates table.)
Accounting for Other Risks
While we believe doing our own independent work is important for long-term success, we are always mindful of our potential blind spots. So in addition to our own modeling work, we utilize other approaches to assess valuations and expected returns. In particular, we dig deeply into views that are contrary to ours to try and understand how we could be wrong. We call this part of our process “collecting the weight of the evidence.” This influences not only whether we make a tactical allocation but also its sizing. In the case of our portfolios’ recent increase in emerging-markets stocks, we saw sufficient validity in bearish arguments and enough short-term downside to implement only a modest overweighting. Below, we lay out the evidence we were able to collect as we dug into several other potential emerging-markets risks.
Aggregate measures of emerging-markets valuations may mask the fact that “quality” or healthier parts of emerging markets may not be cheap. In aggregate, we can say that the international managers we respect with a broad investment opportunity set are not finding emerging markets attractive. That is a concern. It’s somewhat atypical for us to find something cheap on an asset-class perspective, while managers are not finding it interesting enough.
We think this may speak to the divergence that may exist in the emerging-markets universe. Some bears have argued the cheap parts of the emerging markets are a value trap because they are unhealthy and deserve to be this cheap, while the healthier parts are expensive, which would explain why some of our quality-focused managers are not dipping into emerging markets in a material way. The cheap parts are mostly commodity-related, such as energy, materials, and banks—together they comprise about 45% of the emerging-markets index, though this number was higher before the recent declines seen in the energy and material sectors. Aside from China, other emerging-market countries such as Brazil, Turkey, and Russia have also seen rapid credit growth, so these countries may yet witness financial-sector strains due to rising nonperforming loans.
This (or the next) stage of the commodity cycle could be a more significant/long-lasting headwind than anticipated. We saw a major commodity boom that lasted for many years, and now it’s possible we are in the early stages of a long commodity decline. We get mixed opinions from managers—some see attractive opportunities in the commodity-related sectors, while others contend too much supply came on line in the last cycle and weaker producers have not been wrung out of the system yet (as the cost curves have flattened relatively speaking), implying it will be a while before the commodity cycle recovers. However, there are mitigating factors.
- First, valuations for the above-mentioned sectors may be getting cheap. According to data from Lazard and other publicly available sources, in August, price-to-book ratios for the energy, materials, and banking sectors were 0.7x, 1.1x, and 1.1x, respectively. This compares to 0.7x, 0.9x, and 1.4x in December 1998, when emerging markets were reeling with first the Asian crisis and then the Russian ruble devaluation and debt default, and 1.4x, 1.6x, and 1.4x at the end of 2002, just before emerging markets made a huge run. So P/B ratios indicate that valuations for at least these supposedly “unhealthy” sectors are at or close to levels when emerging markets were extremely attractive in the past. So, a lot of the bad news may already be priced into these sectors.
- Second, we’d disagree that a declining commodity cycle by default is bad for emerging markets. Yes, some of the heavy weights in the index, such as Brazil, Russia, and South Africa, suffer deteriorating terms of trade and headwinds to growth along with declining commodity prices, but investors are already seeing that reflected in their exchange rates and equity prices. On the other hand there is a large chunk of emerging-market countries, such as China and India, who are net importers of commodities—their terms of trade and fiscal positions improve when commodities fall. According to J.P. Morgan, based on an analysis of trade data from all 18 available emerging-market countries, 12 out of 18 countries have improved their terms of trade since July 2014.
- Finally, commodity prices have come down significantly, and we see merit in the argument that at low prices we will start seeing a supply response in the form of producers cutting back unprofitable production, weak players going bankrupt, etc. The Bloomberg Commodity Index shows the average commodity price has almost declined to 1999 levels (see chart above).
Despite the mitigating factors, a persistent decline in commodities may signal to investors a poor outlook for global growth. Because emerging markets are more levered to global or external growth than the United States, for example, emerging-markets stocks have historically suffered more during such periods, one possible reason why some investors associate the performance of emerging-markets stocks with changes in commodity prices. We know valuations don’t matter in the short term, so a continued decline in commodity prices would likely mean more short-term downside for emerging-markets stocks.
Emerging-markets corporations may have taken on significant amounts of dollar-denominated debt, exposing them to balance sheet contamination from a further rise in the U.S. dollar. In our “Third Quarter 2013 Investment Commentary,” highlighting some of the key risk factors and/or unknowns, we wrote,
We have witnessed a relatively sharp increase in dollar-denominated debt among emerging-markets corporations. Based on our discussion with emerging-markets fund managers thus far, this does not appear to be a material risk; it’s more a company-specific risk. But we are not confident that is the case, and will keep digging to assess this risk factor further.
Since then we have kept looking and have not found compelling evidence either way. We see data that suggests emerging-markets companies may have taken on significant foreign-currency debt the past few years. On the positive side, emerging-markets currencies have been declining for the past few years, but we have yet to see major credit events among emerging-markets companies. This observation is in favor of the optimists who say most emerging-markets companies with dollar debt have dollar revenues to offset that liability, and most others have learned from past experiences and have done a good job hedging their dollar exposures.
|
|||
| Source: Ned Davis Research/MSCI. Quarterly data as of 6/30/2015. Copyright 2015 Ned Davis Research, Inc. Further distribution prohibited without prior permission. All Rights Reserved. See NDR Disclaimer at www.ndr.com/copyright.html. For data vendor disclaimers refer to www.ndr.com/vendorinfo/. |
|||
|
|||
| Source: JP Morgan. Data as of 9/21/2015. |
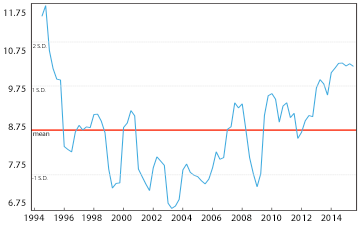
Weighing both sides of the argument, we find we cannot ignore this risk factor. One way to factor in this risk is to look at debt-adjusted valuation metrics such as EV to EBITDA for emerging markets, as shown in the chart to the right. Enterprise value includes market capitalization and debt in the numerator. While the chart data is as of the second quarter, after accounting for price declines and assuming EBITDA did not shrink materially, we'd say emerging-markets stocks are at fair value, at best.
We also looked at other valuation metrics such as the P/B ratio, which we used to look at in the past and we still look at it as part of our weight-of-the-evidence framework. These metrics suggest emerging markets overall are cheap, but not historically cheap, despite the historically attractive valuations in certain sectors.
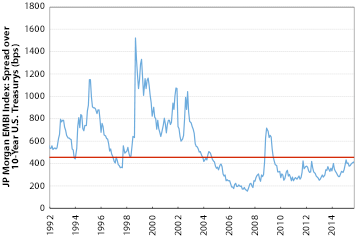
Another factor that gives us pause is emerging-markets sovereign bond spreads, which stand around their historical average as seen by Emerging-Markets Sovereign Bond Spreads Around Historical Average chart to the right. This suggests investors are not too worried about credit strains in emerging markets. While emerging-markets sovereign balance sheets are indeed healthier than in the past, it worries us that the credit market is taking the recent falls in emerging-markets currencies and stock prices in stride when historically it has not. The potential for significant fallout from the credit market still remains—just recently, S&P downgraded Brazil’s credit rating to junk.
Finally, we want to consider the potential impact of currency. In recent months we built a local-currency model for emerging markets wherein we input the same assumptions we describe above. This model suggests returns in the upper single digits—decent but not nearly as attractive as the low double-digit returns we are getting from our dollar-based model. The discrepancy between the two models makes the point that we can expect some gains by being long emerging-markets currencies. It does give us pause though to see that nearly four to five percentage points of return from our primary model may be stemming from currencies, which are notoriously hard to value with confidence in our opinion.
Overall, the weight of the evidence suggests at present that emerging-markets stocks are cheap relative to U.S. stocks and at least as attractive as European stocks. But we think they are not yet absolutely cheap, so in our recent tactical move we only made a modest increase in our emerging-markets stock positions, funded from a portion of our Europe overweight. After our recent tactical move, our portfolios remain overweight to Europe and properly calibrated in terms of the relative attractiveness of both Europe and emerging markets versus U.S. stocks, in our view. In addition, we believe this tactical equity shift improves our portfolios’ long-term return potential while also managing to each portfolio’s risk threshold.
—Rajat Jain, CFA
© Copyright 2002-, Litman Gregory Analytics, LLC