SUMMARY
- To determine whether lower volatility can persist after extraordinarily accommodative monetary conditions cease, we can examine the numerous drivers of interest rate volatility – many of which have undergone regime changes since 2008.
- These drivers of interest rate volatility – reduced liquidity, stricter regulation, growth of hedge fund assets, changing profile of market participants and the New Neutral growth environment – generally point to higher levels of uncertainty going forward. Although regulation has (hopefully) curtailed the likelihood of volatility explosions, the increased rigidity of the market structure as a result means we can expect more frequent gap moves.
The profound impact of six years of unconventional U.S. monetary policy – a policy rate pinned near zero, three rounds of quantitative easing – has left its mark on the economy. But has it fundamentally altered interest rate volatility? In other words, after years of central banks acting to suppress volatility, could interest rates be structurally less volatile going forward – even after monetary policy normalizes in the U.S. and (eventually) around the globe?
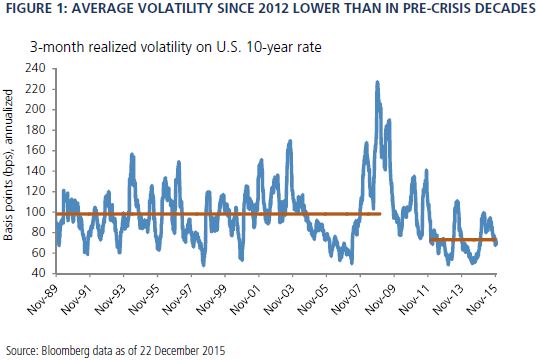
At PIMCO, we are skeptical of this view. It is true that overall U.S. volatility has diminished in recent years: Since January 2012, for example, the average realized three-month volatility on the 10-year swap rate is 74 basis points (bps), compared to an average of 98 bps over the 20 years leading up to December 2008 (when the fed funds rate was lowered to just above zero) – see Figure 1.
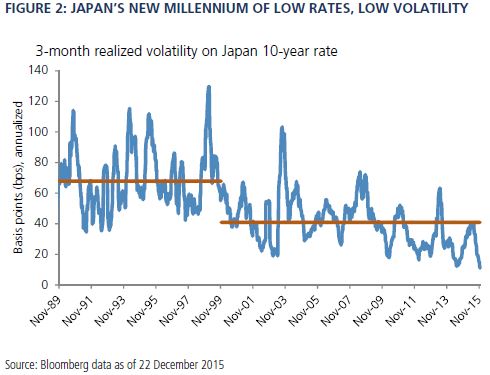
If the Federal Reserve struggles to raise rates further, as currently predicted by the eurodollar options market (although that is not our baseline view), then the outlook for volatility could resemble what happened in Japan (see Figure 2). Japanese interest rates have been hovering near zero for most of the last two decades. The average three-month realized volatility on the Japanese 10-year swap rate was 41 bps over the last 15 years since rates fell to near-zero versus 68 bps during the 10 years prior. With interest rates bounded by zero on the low end (at least until the recent European experience) and anemic economic growth on the high end, volatility tended to be lower as well.
To determine whether lower volatility can persist after extraordinarily accommodative monetary conditions cease, one has to expand the focus and examine the numerous drivers of interest rate volatility – many of which have undergone regime changes since 2008.
Volatility driver #1: Liquidity (or lack thereof)
Foremost in the mind of many market participants is market liquidity, or rather the lack thereof. Although Dodd-Frank regulations have lowered leverage in the financial system, stricter regulation in the U.S. and Europe has resulted in more constrained balance sheets at many traditional liquidity providers, which in turn lead to higher transaction costs. Lower liquidity tends to increase day-to-day market volatility since the same-sized trades now have a bigger impact on market price.
Volatility driver #2: Hedge fund asset growth and strategy
The hedge fund community has around $2.9 trillion in assets under management, and many of them employ risk management frameworks – such as VAR (value-at-risk) and risk parity strategies – that scale up risk under low volatility and scale down under high volatility. During large market moves, these funds would be forced to shed assets into a market that is less able to absorb them, per the reduced liquidity (driver #1, above), which begets even larger market moves, particularly in risky assets. This feedback loop amplifies not only market dislocations but also the “vol of vol” – that is, the peak level of volatility is now higher and the trough level of volatility is now lower.
Therefore, the continuing growth in hedge fund assets likely means lower day-to-day volatility as these trading strategies reduce risk premium under normal market conditions, but a higher likelihood of three-standard-deviation events. However, while we can expect bouts of heightened volatility such as this past August or the October 2014 flash crash to be more frequent, a persistent volatility explosion in the magnitude of the 2008 crisis is less likely. The regulation-driven lower leverage in the financial system discussed above is designed to prevent these three-standard-deviation events from morphing into catastrophic ten-standard-deviation events.
Volatility driver #3: Waning central bank involvement
The convexity profile of market participants has changed. Before the 2008 crisis, the mortgage community provided a structural bid to interest rate volatility to hedge its negatively convex assets (mortgage duration lengthens when rates sell off and contracts when rates rally). This has largely gone by the wayside as 30% of outstanding mortgages are now owned by the Federal Reserve, a non-economic player that doesn’t hedge. Furthermore, government-sponsored enterprises such as Fannie Mae and Freddie Mac, perhaps the most significant convexity hedgers in the market pre-crisis, now have a much smaller footprint. This structural change in ownership of the MBS market has resulted in lower interest rate volatility.
In addition, global central banks now hold large portfolios of government bonds as a result of quantitative easing in developed markets and foreign currency reserve accumulation in emerging markets (EM). This also dampens price movements since reserve managers tend to do very little short-term trading.
But China’s reserve selling this past August suggests the era of continuous EM reserve accumulation may be coming to an end, and the Fed’s holdings of mortgage and government bonds will start to roll off its balance sheet in the first quarter of 2016 (as the debts are retired on schedule). If the Fed gradually normalizes policy as PIMCO expects in the coming years, the dampening effect of central bank policy on volatility, at least in the U.S., should fade over time.
Volatility driver #4: Economic data and conditions
Outside of technical factors in the financial markets, economic outcomes, more specifically, the volatility of economic data such as GDP growth and inflation, are also an important determinant of interest rate volatility. PIMCO’s New Neutral thesis sees economies globally converging to modest trend growth rates. At first glance, this appears to suggest a more stable economic environment with smaller fluctuations. But a lower level of growth also means a higher chance of tipping into a recession, and central banks, which in The New Neutral are constrained to set policy rates at levels well below those that prevailed before the crisis, have a smaller cushion for cutting rates if necessary to stabilize growth. Moreover, societal tensions over income inequality and other issues tend to escalate during times of economic hardship – the mass protests over austerity in Greece are a recent example. Outside of the U.S., slower economic growth may be even more of a concern in countries such as Venezuela and China. Meanwhile, the probability of disruptive changes to the economy is as high as ever – think of Uber upending the taxi industry. Overall, the net effect of the New Neutral growth environment on economic volatility is inconclusive.
All these drivers of interest rate volatility – reduced liquidity, stricter regulation, growth of hedge fund assets, changing profile of market participants and the New Neutral growth environment – generally point to higher levels of uncertainty going forward. Although regulation has (hopefully) curtailed the likelihood of volatility explosions such as what happened during the 2008 financial crisis, the increased rigidity of the market structure as a result means we can expect more frequent gap moves. So despite the relatively tame market environment of recent memory, U.S. interest rates are unlikely to be structurally less volatile going forward.


