FEARS OF ECONOMIC SLOWDOWN IN CHINA HAVE STOKED CONCERNS OF WEAKER GLOBAL GROWTH
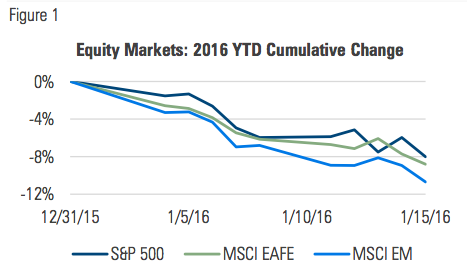
The S&P 500’s 8% decline over the first 10 trading days of 2016 is the worst start to a new year the index has experienced over its long history dating back to 1928. Developed and emerging markets offered no place to hide, with the MSCI EAFE and EM Indexes selling off 8.8% and 10.7%, respectively:
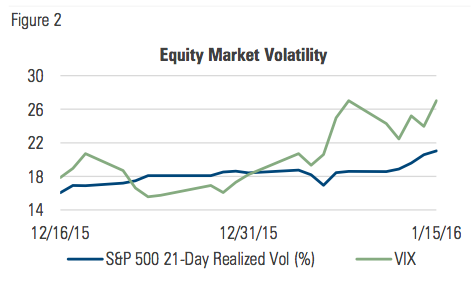
After implied volatility moderated during the second half of December, markets began their descent, implied and realized volatility climbed gradually higher:
MANAGED VOLATILITY PORTFOLIOS
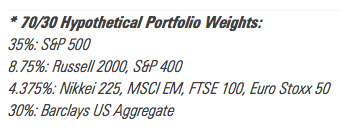
During the first two weeks of January, we estimate that a typical 70/30, globally-diversified multi-asset portfolio* with a 10% volatility target saw its net equity exposure immediately begin to adjust downward as volatility ticked higher.
Its net equity exposure of dropped from 60% at year end to 40% by the end of the first week of 2016 and down to 35% by the end of week two. Over the period, the hedged portfolio exhibited about two-thirds the volatility of its unhedged counterpart.
If the decline continues, the hedge leaves managed volatility portfolios well positioned against it. If volatility modulates and markets reverse course, managed volatility portfolios will reduce their hedge, thereby increasing their exposure to equity markets.
Investors who have watched equity markets fall more than 10% since early December have likely asked themselves some form of this question: “Should I sell before (and in case) it gets worse?” Many investors no doubt answer this question with another question: “But what if I sell only to see the market recover?”
This is the conundrum of investing – precise knowledge of the future is unattainable. Investor anxieties that stem from these questions are addressed by managed volatility portfolios.
MARKET COMMENTARY
Apart from cash and Treasuries, no corner of the market was exempt from the downturn. Everything traded lower:
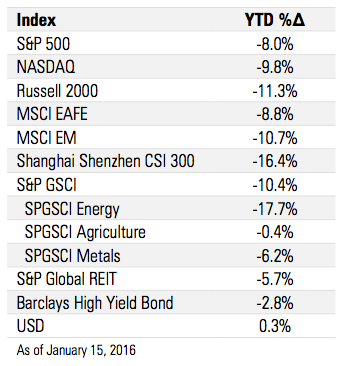
The 10.4% decline in commodities comes after already being down more than 25% in 2015, much of that due to the nearly 40% decline in the price of oil.
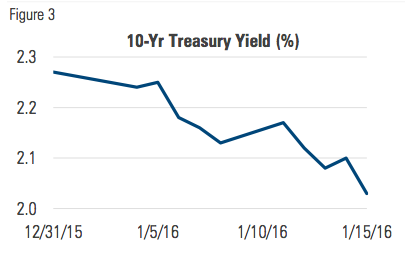
The flight from riskier assets into higher quality pushed rates down sharply, with the yield on the 10-year Treasury falling 24 bps to 2.03%, its lowest level in three months:
IS THIS A CORRECTION OR A BEAR MARKET?
The S&P closed at its all-time high on May 21, 2015. After finishing the year down 4.1% from that high mark, two weeks into 2016 it sits 11.8% below its high:
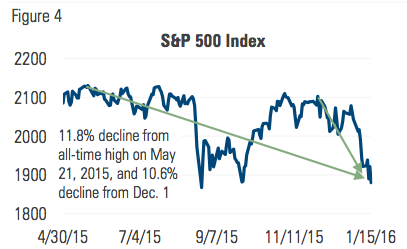
What is a market correction? A market correction is generally considered to be a decline of at least 10% over a relatively short period of time (two months or less). Given that the S&P 500 is also down 10.6% from December 1, this selloff qualifies as a market correction.
How is a market correction different from a bear market? On the other hand, a bear market is considered to be a downturn of at least 20% over a period of more than two months. One of the key distinctions between corrections and bear markets is that a correction is more about the market itself rather than the outlook on which the market’s valuations are based.
Many investors believe corrections to be a healthy event, bringing markets back in line with reality. The selloff associated with a correction generally doesn’t occur because the outlook has changed, but rather merely out of recognition that the market was overvalued.
A bear market is different; it represents a fundamental shift in the outlook for growth and future earnings. As the outlook worsens, a bear market exhibits a sustained decline over a period of months or even years.
There are good reasons to think that this decline is a correction, rather than the beginning of a bear market. Chief among them is that the fundamentals of the U.S economy have not exhibited changes that would warrant an extended market decline:
-
Job creation accelerated in Q4, with an average of 284k jobs created each month. The first jobs data release in the new- year didn’t disappoint with 292k new jobs.
-
After declining in 2014, home prices stabilized and trended higher in 2015.
-
Average wages in the U.S. are 2.5% higher than they were a year ago, while consumer prices are only 0.5% higher. This represents a real increase in buying power.
-
The Fed’s rate hike notwithstanding, monetary policy is still highly accommodative and will be for some time even if the Fed continues to raise the fed funds rate this year.
This is not to say that the U.S economy is without warts. The effect of lower oil prices on the energy sector will have ripple effects throughout the broader economy. One of the strengths and defining characteristics of the U.S. economy, however, is its sector and industry diversification. The consequences of cheaper oil on the energy sector shouldn’t be minimized, but neither should the resiliency, ingenuity and entrepreneurial spirit of the many participants that make up the broader economy.
NORMALIZATION OF MONETARY POLICY IS GOOD, BUT ALSO DIFFICULT
The Fed initiated its first fed funds rate increase in nearly a decade even though inflation remains well below its target of 2%. In light of their price stability mandate, the rate increase in some ways does not appear consistent with what is happening with broad price levels.
However, in addition to the benefits of gradual, predictable increases and trying to stay ahead of any potential spike in inflation, the Fed may also have begun to tighten out of a simple recognition that policy must eventually normalize if the U.S. economy is to move forward on solid footing.
An artificially low fed funds rate of zero acts as a central point of price distortion that ripples throughout the economy. Prices provide critical information about how an economy’s scarce resources can be best allocated. Distorted prices carry misinformation and stand in the way of optimal efficiency.
Moreover, economic participants who operate on the premise that the Fed won’t allow sustained market volatility or declines will take more risk than they would otherwise. This too has a distorting effect on prices and the cost of risk capital.
By beginning to extricate itself from financial markets and normalize monetary policy, the Fed is doing the right thing for the long-term health of the economy. But that doesn’t mean that the normalizing process will be easy. The Fed’s challenge is to return policy to normal as quickly as possible, while causing minimal disruption to economic growth along the way. That process has begun and that is a good thing.

Milliman Financial Risk Management LLC is a global leader in financial risk management to the retirement savings industry. Milliman Financial Risk Management (FRM) provides investment advisory, hedging, and consulting services on $190 billion in global assets (as of July 1, 2015).
Established in 1998, the practice includes over 130 professionals operating from three trading platforms around the world (Chicago, London, and Sydney). Milliman FRM is a subsidiary of Milliman, Inc.
Milliman, Inc. (Milliman) is one of the world’s largest independent actuarial and consulting firms. Founded in Seattle in 1947, Milliman has 55 offices in key locations worldwide that are home to over 2,600 professionals, including more than 1,300 qualified consultants and actuaries.
for more information:
MILLIMAN.COM/FRM