Causal relationships interwoven throughout financial markets collectively form the correlation framework under which investors attempt to understand price movements across disparate asset classes.
Cross-asset correlations are not static. The strength and direction of pairwise correlations, as well as the relationships within broader risk factors, change often (and sometimes rapidly) due to fundamental or technical factors.
Today’s environment of relatively strong cross-asset correlations under activist central banks contains some surprising new causal relationships, which in turn have investment ramifications.
Across global financial markets, different asset classes rise and fall: sometimes in the same direction, sometimes the opposite, sometimes with no discernible connection.
The extent, pace and duration of the movements can vary. Shifts in one asset class may affect another, or the same underlying force may drive them all in the same or different ways.
Understanding the causes and effects of all these asset class correlation patterns is key to understanding true portfolio risk factor exposures and the embedded assumptions that inform investment decisions. (For further reading, PIMCO’s quantitative research and analytics team offers a rigorous look at stock-bond correlation and how it evolves across different time periods and measurement horizons – please see “The Stock-Bond Correlation” by Nic Johnson, Vasant Naik, Niels Pedersen and Steve Sapra.)
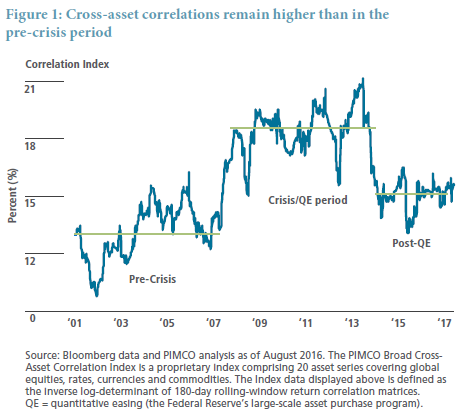
History offers clues into correlation patterns, though it’s important to stay alert to unprecedented trends, causes and effects as well. Looking at the recent past, cross-asset correlations broadly rose in the aftermath of the 2008–2009 financial crisis, driven by global central bank interdependence and investor risk sentiment. However, the correlation framework began to shift in 2013 – prompted, at least in part, by a brief comment from one of the world’s most powerful central bankers.
Federal Reserve Chairman Ben Bernanke’s testimony to Congress on 22 May 2013 was expected to be a sleeper event. But in the Q&A session, he mentioned that he expected to begin tapering the Fed’s purchases of Treasury and mortgage securities later that year. His comment set off one of the most extreme bouts of volatility in financial markets since the global financial crisis. Not only did the U.S. 10-year Treasury yield soar 140 basis points (bps) in the subsequent months, risk assets with no direct relationship to Fed purchases (such as emerging market currencies) were crushed under the forced unwind of carry trades across the market landscape.
The “taper tantrum” and ensuing market effects were a powerful display of the connectivity or correlation of global financial markets. (The saying is true that correlation does not always mean causation – it’s possible that seemingly related movements are just coincidence – but most correlations in markets can be traced to similar underlying forces.) Another common example of a causal relationship is how a currency’s valuation can be driven by the price of the country’s primary export – think of the Norwegian krone and oil, or the Chilean peso and copper. These various causal relationships interwoven throughout financial markets collectively form the correlation framework (we could envision it as a web of thousands of strands) under which investors attempt to understand price movements across disparate asset classes.
Ever-changing correlations
Cross-asset correlations are not static. The strength and direction of pairwise correlations, as well as the relationships within broader risk factors, change often (and sometimes rapidly) due to fundamental or technical factors. Since the financial crisis in 2008, global correlations have been stronger than previous correlations (despite the taper tantrum and other market surprises), and we can make educated assumptions on contributing factors.
First, changes in central bank accommodation have become one of the most important drivers of returns and volatility. Even though monetary policy has always been an important factor in financial markets, the engines of economic growth were less reliant on central banks in the pre-crisis era – think of China’s accession into the World Trade Organization or the technology boom in the U.S., both of which spurred economic growth independently of central bank policy. But today, major developed economies face aging demographics and lower productivity growth and are thus addicted to monetary accommodation in order to sputter along. Consequently, central bank policies affect all asset classes and carry global reverberations. As a result of this, investor sentiment seems increasingly dominated by a smaller number of themes: energy prices, China’s outlook and policies, recession fears. And finally, the presence of algorithmic traders and market-makers has increased, which can cause liquidity and trading decisions to be expressed quickly (in a “flash”) across many asset classes.
PIMCO’s broad cross-asset correlation index (see Figure 1) comprises 20 asset series covering global equities, rates, currencies and commodities. Correlations during the 2008–2013 period were exceptionally strong but decoupled slightly after the taper tantrum in 2013, nevertheless remaining stronger than pre-crisis. Traumatized by the crisis, many investors worry about the fragility of the long and slow economic recovery.
Surprising relationships
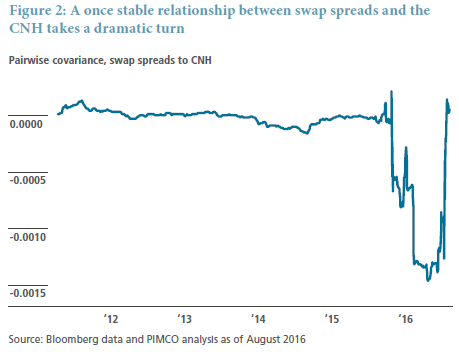
Today’s environment of relatively strong cross-asset correlations under activist central banks contains some surprising new causal relationships, which in turn have investment ramifications. One prominent recent example is China’s currency devaluation in August 2015 and the resultant tightening of U.S. swap spreads.
Swap spreads represent the difference in yield between a U.S. Treasury bond backed by the full faith and credit of the U.S. government and the rate on an equivalent swap that one can enter into with a counterparty, typically a bank.1 In the post-crisis era, the two primary drivers of swap spreads have been corporate issuance over the short term and the U.S. government budget deficit/surplus over the medium term.2China’s unexpected currency devaluation in August 2015 changed this dynamic. After the devaluation, China’s central bank is believed to have sold a large amount of two- to three-year U.S. Treasuries in order to free up foreign reserves to defend the currency and to meet capital outflows. The dealers who bought these bonds were incapable of holding such large positions on their reduced balance sheets under the new Dodd-Frank regulatory regime. Consequently, dealers offloaded these Treasury securities into the market, and the sudden increase in supply drove up bond yields, most notably against swap rates – which, unlike Treasuries, do not require the use of balance sheet. Over the subsequent three months, swap spreads tightened 20 bps as the market digested this flow.
China’s devaluation prompted a dramatic change in how swap spreads trade. Under the new framework, a view on swap spreads entails a view on emerging market central banks, whereas in the traditional framework the main considerations were limited to corporate issuance and the budget deficit. This new causal relationship can be seen in the covariance (a measure of correlation and volatility) between five-year swap spreads and the CNH currency (the Chinese yuan traded offshore), which has returned to normality after Brexit concerns turned investor attention away from China again – see Figure 2.
Heightened cross-asset correlations can have economic implications as well – a key example is the interdependence between global financial conditions and the Federal Reserve’s policy path. With the U.S. unemployment rate currently at 5% and inflation expected to converge toward target over the medium term, some observers would argue that domestic conditions warrant additional hikes in the policy rate. However, this would inevitably lead to a stronger U.S. dollar against the backdrop of negative interest rates in Europe and Japan. Dollar strength versus the euro and yen would also drive up the value of the Chinese yuan, which is linked to the dollar. But unlike the U.S., China’s domestic conditions do not justify a stronger currency and in fact may not be able to cope with the accompanying drag on exports.
The reaction function of the Chinese central bank to an unwelcome currency appreciation could destabilize risk sentiment and potentially bring about disorderly U.S. dollar strength, wider credit spreads and increased likelihood of global deflation. Under such a tightening of financial conditions, the U.S. private sector would face higher borrowing costs and decreased export competitiveness, hindering the tenuous economic recovery upon which the Fed’s decision to raise rates was based. Consequently, the Fed would like to see stable financial conditions before implementing rate hikes, but those very same rate hikes could subsequently destabilize financial conditions. The correlation web is complicated and consequential for the global economy.
Investment implications
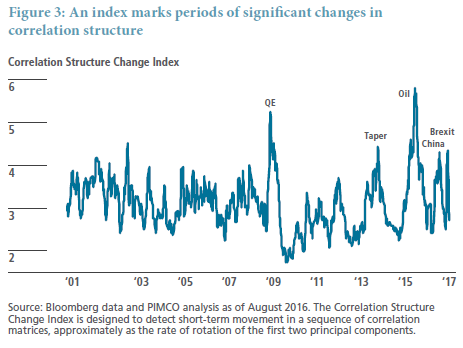
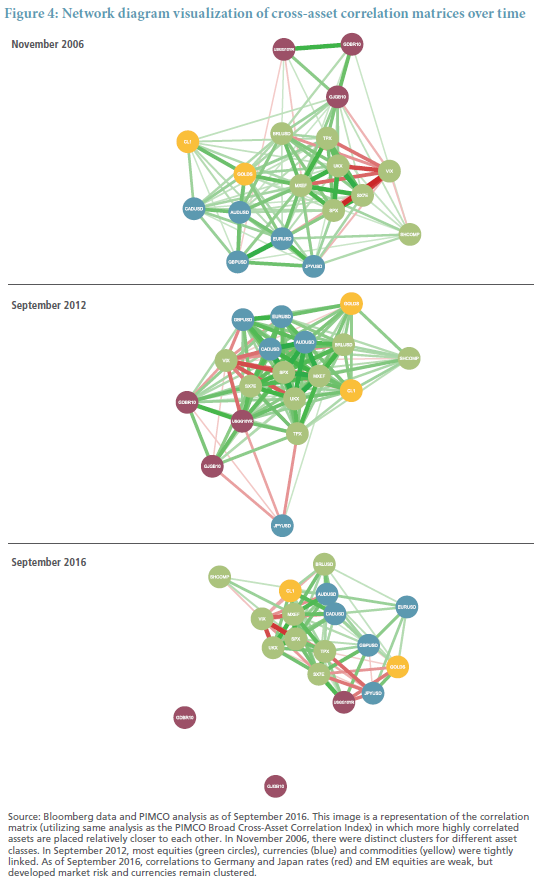
An environment of stronger global correlations makes it more challenging to construct a truly diversified and resilient portfolio, because assets that were previously unrelated can now represent exposure to the same risk factors. Rather than thinking of portfolios in terms of exposures to individual assets or traditional risk factors, it can be helpful to consider exposures to the principal components of the changing correlation matrix. To do this, investors need analytical techniques for exploring and visualizing changes to the correlation structure. Examples of such tools include correlation indexes like the one shown in Figure 1, but also indicators of the directionality and momentum of the correlation structure, such as a correlation change tracker (see Figure 3) or network visualizations of the correlation matrix for key assets (see Figure 4). These tools can make changes readily apparent, at least after the fact: Asset classes that formed distinct clusters pre-crisis have now become more strongly intertwined, with equities and currencies tracking more closely, and oil and China moving closer to the center.
Though the past is not always a reliable indicator of future developments, insights gained from analyzing past market movements can inform expectations of potential future changes resulting from upcoming events, and – importantly – reduce reliance on stable cross-asset regimes. An understanding of the technical or fundamental factors that can cause correlations between particular assets to change can inform portfolio construction in a way that is more resilient to plausible changes in correlation strength or structure. In a high-correlation world, being cognizant of the changing market structure becomes increasingly advantageous.
DISCLOSURES
Past performance is not a guarantee or a reliable indicator of future results. All investments contain risk and may lose value. It is not possible to invest directly in anunmanaged index. Correlation is a statistical measure of how two data points move in relation to each other. The correlation of various indexes or securities against one another or against inflation is based upon data over a certain time period. These correlations may vary substantially in the future or over different time periods that can result in greater volatility.Diversification does not ensure against loss. Investors should consult their investment professional prior to making an investment decision.
This material contains the opinions of the manager and such opinions are subject to change without notice. This material has been distributed for informational purposes only and should not be considered as investment advice or a recommendation of any particular security, strategy or investment product. Information contained herein has been obtained from sources believed to be reliable, but not guaranteed. No part of this material may be reproduced in any form, or referred to in any other publication, without express written permission. PIMCO is a trademark of Allianz Asset Management of America L.P. in the United States and throughout the world.