Analysis reveals that mid-cap stocks provide a differentiated investment opportunity
Key Takeaways
- Since 1995 mid-cap stocks have outperformed large- and small-cap stocks[1]
- Investors that are under-allocated to the mid cap asset class are potentially accepting greater risk AND missing out on available return, as we review later in this paper
- Mid-cap companies often exhibit the nimbleness and growth potential of small caps with the stability of large caps while accepting, but potentially, reducing the risks of both
|
Did You Know?
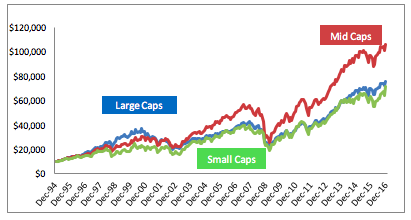
Since 1995, mid-cap stocks, defined by the Russell Midcap Index, have outperformed large-cap stocks (Russell 1000) and small-cap stocks (Russell 2000) by over 40%.
|
|
Stellar Performance
Since 1995 mid-cap stocks have outperformed large- and small-cap stocks by a meaningful 40% margin. Perhaps more impressive is the consistency that mid cap has shown relative to their more widely used peers. Looking at monthly rolling five year average returns since December of 1999, mid cap has outperformed both large cap and small cap in a remarkable 154 of 205 periods, or 75% of the time! The data also shows that over these same 205 periods, mid cap has outpaced large cap 82% of the time and small cap 93% of the time.
Recent Performance of Mid-Cap Stocks
(versus other Equity Asset Classes)

Source: Russell Index Calculator and Baird Equity Asset Management
|
Did You Know?
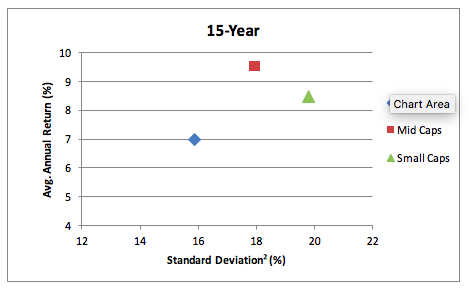
Over the past fifteen years, mid cap returns have provided a better risk / return profile versus large cap and small cap.
|
|
Underappreciated Asset Class
Most asset allocation models and investors tend to migrate to small and large cap asset classes believing this adequately covers mid cap exposure. In our view, the data below suggests these investors are missing available returns and accepting greater risk. Consider the chart below which illustrates strong relative mid-cap returns and a middling standard deviation[2], which results in a Sharpe Ratio[3] of 0.46. This is a positive risk-to-return metric compared to 0.36 for large cap and 0.36 for small cap over the past fifteen years, according to PSN. This simply reflects that larger cap returns are much weaker relative to their risk level, while smaller caps have posted returns that are relatively weaker, yet have more volatility versus mid caps.
Performance and Risk Metrics of Mid-Cap Stocks
(versus other Equity Asset Classes)
Source: PSN and Baird Equity Asset Management
We believe advisors making asset allocation decisions can use the above data as a source of positive differentiation with clients, creating a strong value add that will improve business prospects. As indicated earlier, most advisors recommend small and large cap solutions but under allocate to mid cap, which may result in a missed opportunity to provide a more compelling risk-adjusted portfolio than their competitors.
Fundamental Factors Driving the Outperformance
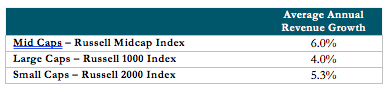
Growth is the largest determinant of long-term returns, as evidenced in the table below—mid caps have outpaced large caps and small caps over the past 22 years in revenue growth.
Source: Bloomberg and Baird Equity Asset Management. Data as of 12/31/2016.
With respect to outpacing large caps, we believe one key reason this occurs is mathematics—it is simply easier to grow from a smaller base than a larger one. Also consider that mid-cap companies tend to have greater exposure to developing opportunities or markets with lower penetration. In most cases, mid-market companies are more nimble relative to large companies that may not be able to effectively participate in these areas.
Mid-cap companies have general growth advantages over smaller cap companies as well. They are typically more mature and, therefore offer better cash flow and more stable balance sheets than smaller caps. Mid cap also tend to have more experienced management teams and better established brands, products and relationships. And, given their relative size, maturity and financial capability they are in a better position to participate globally, which will be important in capturing growth over the next several years.
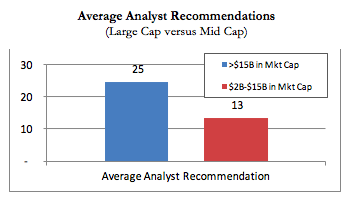
A second key factor is lack of analyst coverage, which results in the market taking longer to appreciate the value of mid-cap companies. We reviewed the constituents of the Russell 3000 Index, which contains a sizable number of large-, mid- and small-cap companies. Large-cap companies today (greater than $15B in market cap) have 25 analyst recommendations on average resulting in strong market efficiency, where company information is reflected quickly into its share price. By contrast, those companies in the true mid cap range ($2B-$15B), have 13 analyst recommendations on average which results in slower dissemination of market information.
Average Analyst Recommendations
(Large Cap versus Mid Cap)
Source: Bloomberg and Baird Equity Asset Management
Mid Caps Offer a Value-Added Solution
This review illustrates how mid caps can offer a high quality yet overlooked solution in the market that can benefit the end clients of advisors. Advisors tend to under-allocate to mid caps, typically choosing to rely on large caps and small caps to provide exposure to a wider range of equity market capitalization. However, data shows that mid caps provide historically better risk-adjusted returns for a wide variety of time horizons and can act as a source of value added differentiation for advisors willing to break from the masses.
The Russell Midcap Index measures the performance of the 800 smallest companies, by market capitalization, in the Russell 1000 Index. The Russell 1000 Index measures the performance of the 1,000 largest companies in the Russell 3000 Index. The Russell 2000 Index consists of the smallest 2000 companies in the Russell 3000 Index. It is not possible to invest directly in an index. The Russell Indices are a trademark of the Frank Russell Company. Russell is a trademark of the Frank Russell Company.
Past performance is not indicative of future results. All investments carry some level of risk including loss of principal. Investments in mid-capitalization companies often are more volatile and face greater risks than larger, more established companies. Foreign investments involve risks such as currency rate fluctuations, different and sometimes less strict financial reporting standards and regulation, and the potential for political and economic instability. For more information and complete discussion of risks associated with a specific equity investment strategy, please visit BairdEquityAssetManagement.com.
Investors should consider the investment objectives, risks, charges and expenses of the fund carefully before investing. This and other information can be found in the prospectus or summary prospectus. A prospectus or summary prospectus may be obtained from your financial advisor and should be read carefully before investing. For more information including performance to the most recent month end, visit Bairdfunds.com.
©2017 Robert W. Baird & Co. Incorporated. Member SIPC.
[1] Mid-cap, large-cap and small-cap stocks as defined by the Russell Midcap Index, Russell 1000 Index and Russell 2000 Index, respectively. All data is as of 12/31/2016.
[2] Standard Deviation is a statistical measure of the extent to which returns of an asset vary from its average.
[3] Sharpe ratio measures risk adjusted return and is defined as excess portfolio return over a unit of risk (standard deviation).
Read more commentaries by Robert W. Baird & Co.