A Statistical Take On The Fourth Quarter
Membership required
Membership is now required to use this feature. To learn more:
View Membership BenefitsWe just completed a simple study for those market bulls who might find themselves temporarily lacking in confidence (assuming such an animal isn’t extinct by now). We found that when the market is making new highs during what has statistically been its worst month, more upside is usually in store for the fourth quarter. Since 1928, there have been 29 times (prior to 2017) that the S&P 500 made a 12-month high in the month of September; in 24 of those cases, the market continued to rise during the fourth quarter. Overall, for all periods (including the five down quarters) following a September high, the market gained 3.7% on average.
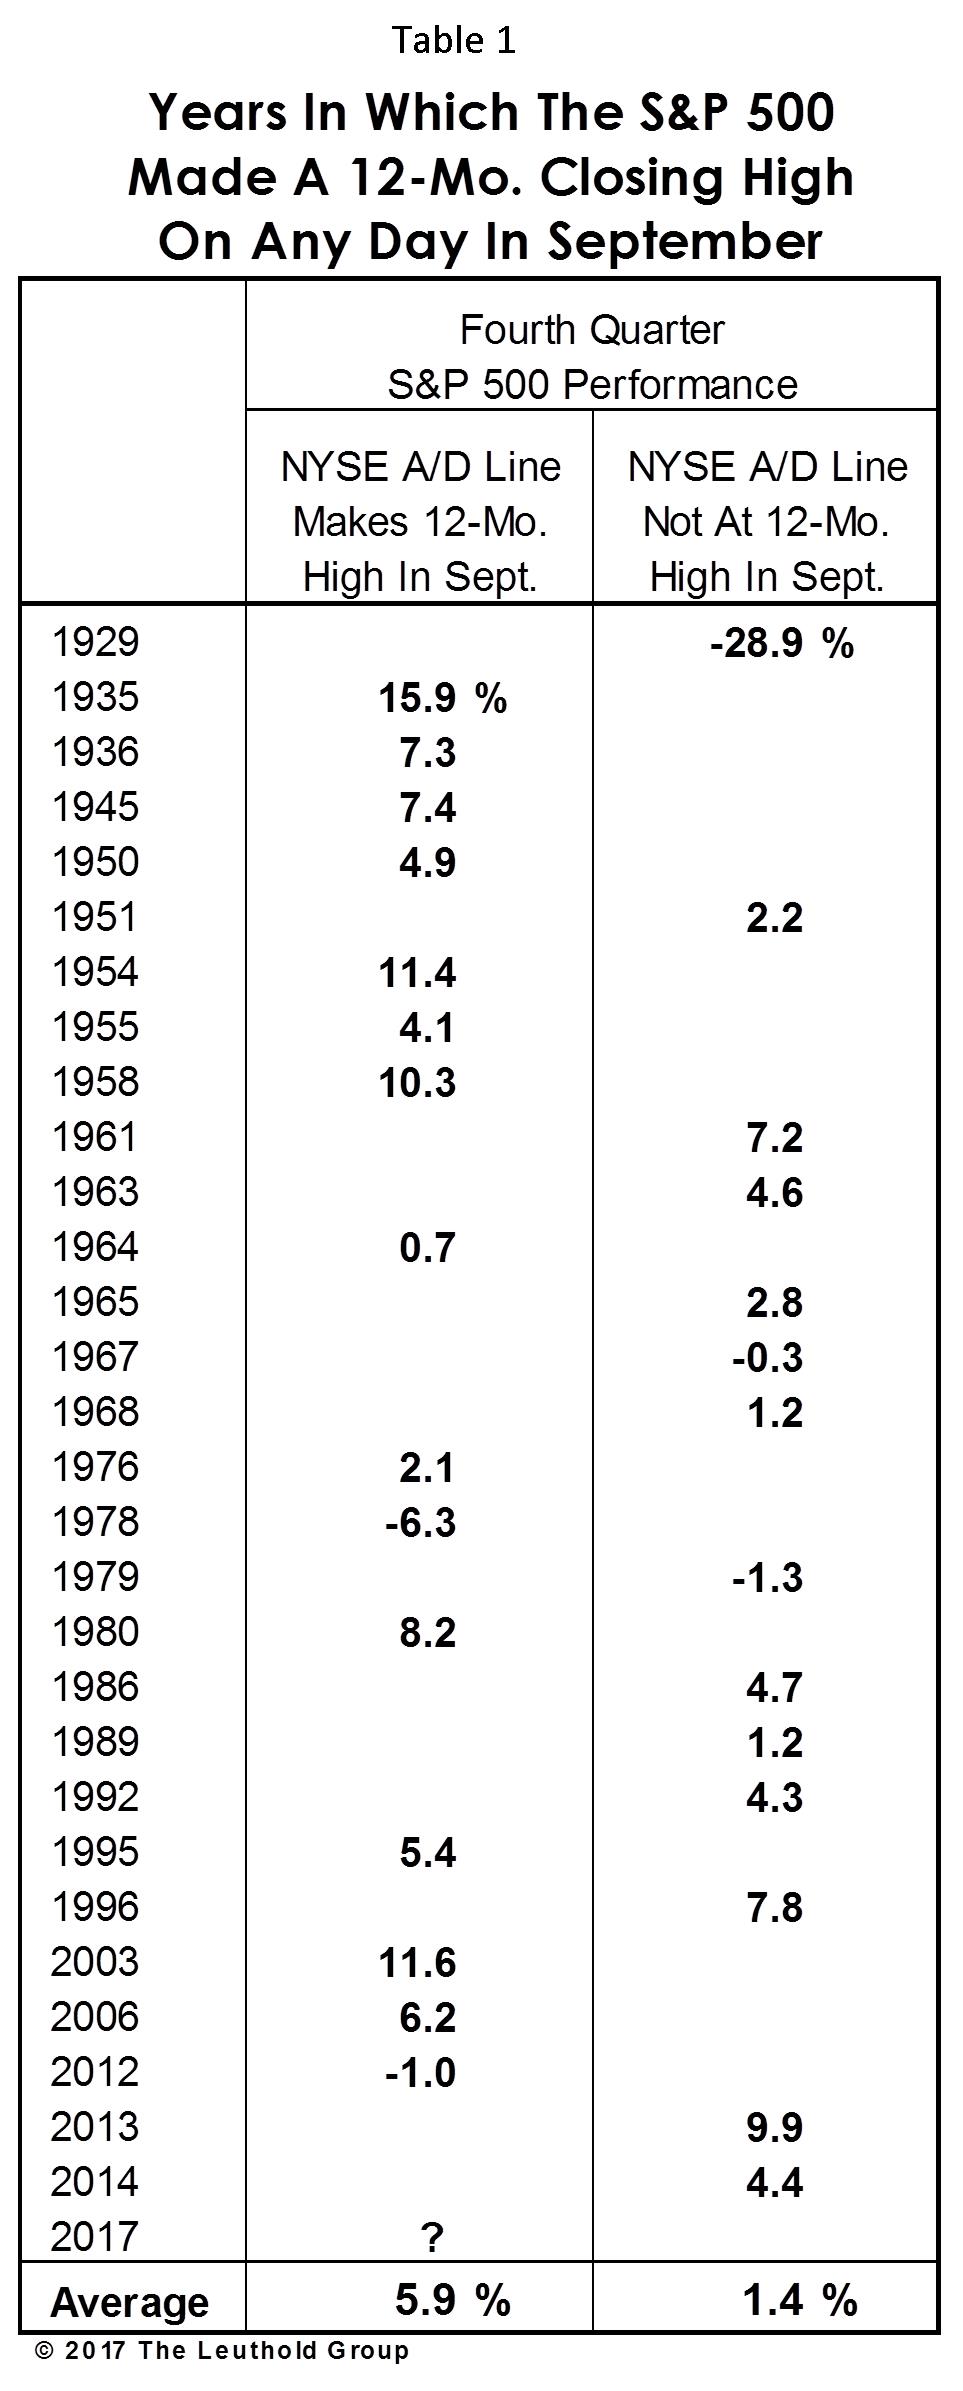
We applied a few of our favorite tools in an effort to discern whether some September highs (like this week’s) might be “better” than others. First, from a technical point of view, this month’s S&P 500 highs have been repeatedly confirmed by new 12-month highs in the NYSE A/D Line. Historically, we found that when new September highs occurred in both the S&P 500 and the NYSE A/D Line (Table 1, left column), the subsequent fourth quarter gain was 5.9% on average—much better than the average 1.4% gain that occurred when an S&P September high was not confirmed by the A/D Line (Table 1, right column).
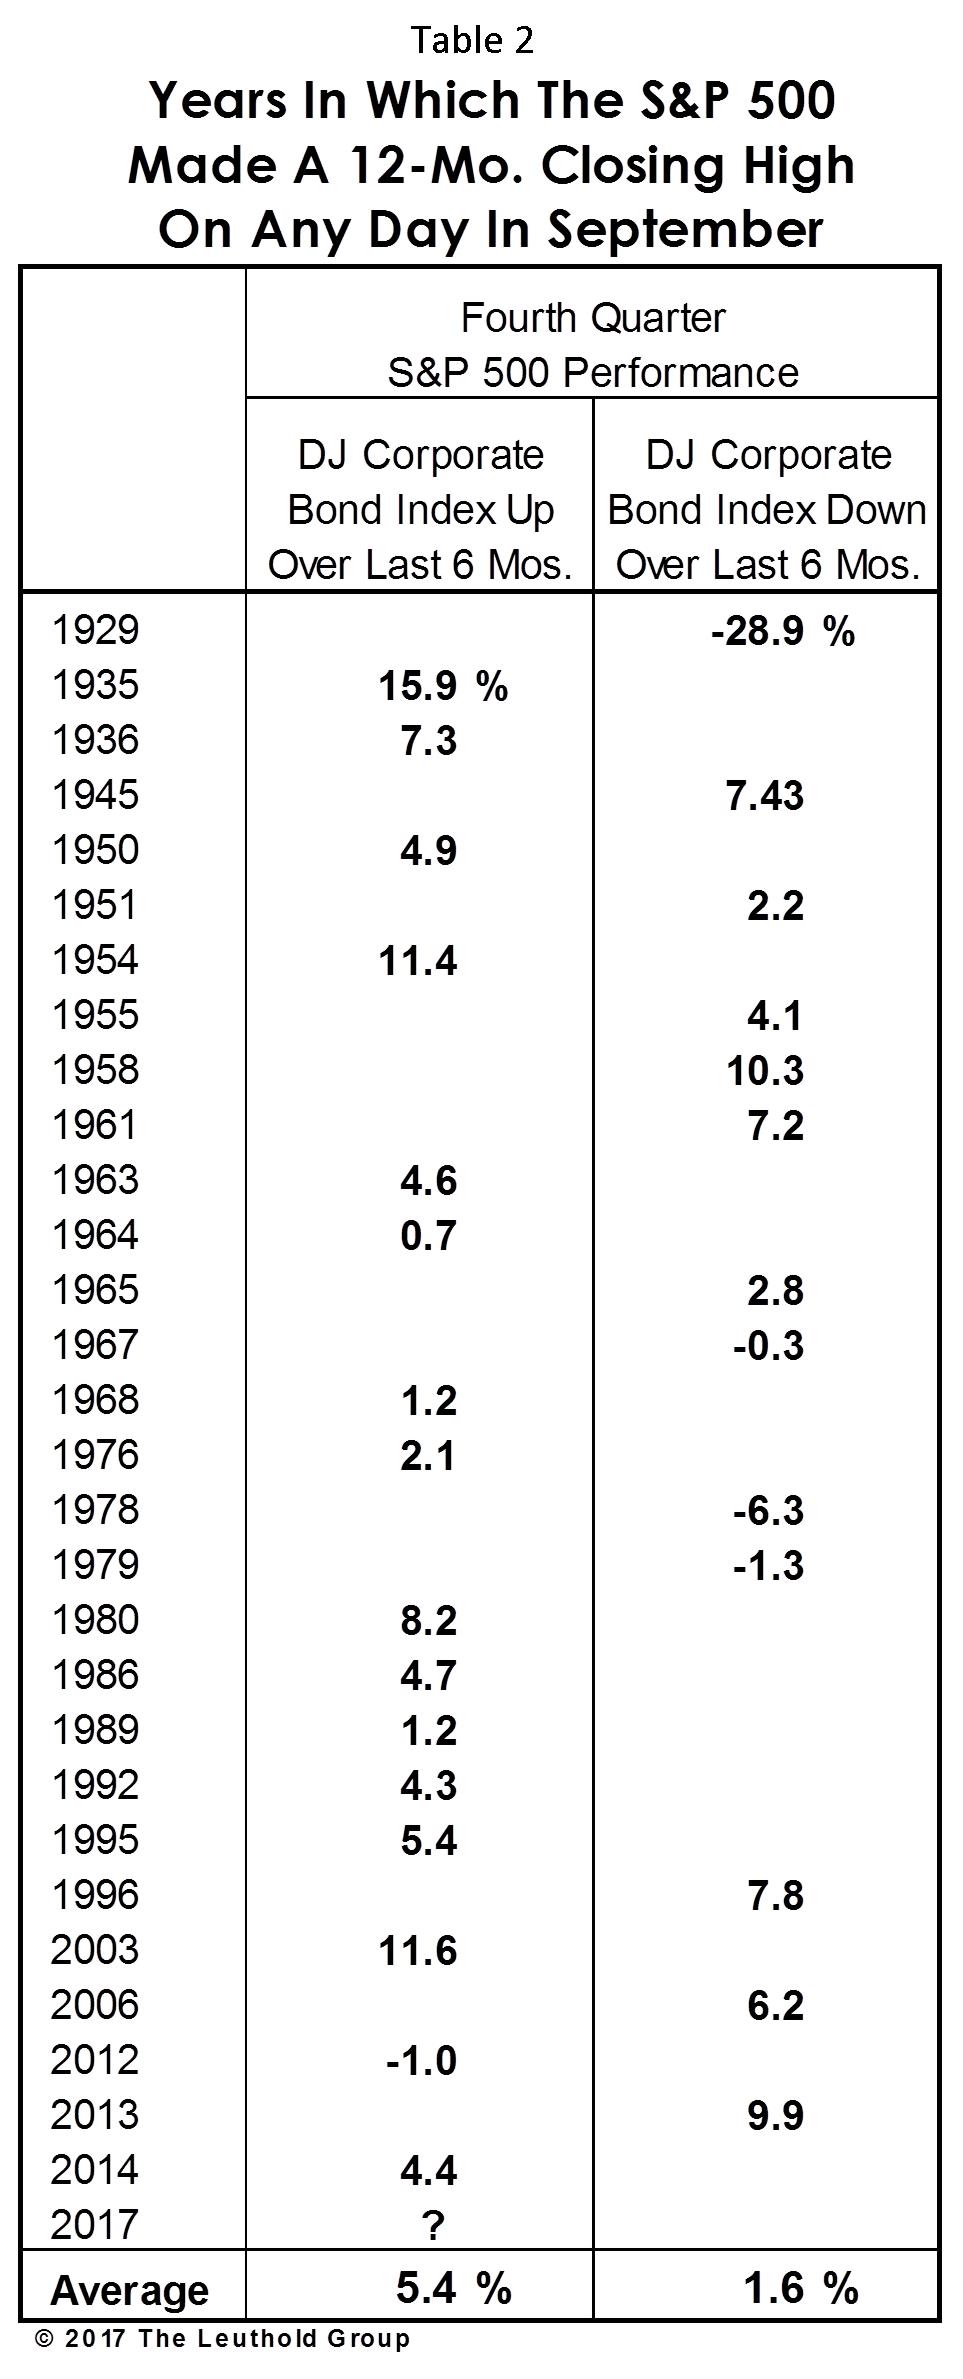
Second, we evaluated the monetary conditions surrounding a September high in stocks using the six-month change in the Dow Jones Corporate Bond Index as a proxy. When rising bond prices accompanied the new September high in stocks (Table 2, left column), the average S&P 500 fourth quarter gain was 5.4%—well above the 1.6% gain achieved when Corporate bond prices (six-month basis) were on the decline (Table 2, right column). Based on this measure, the current monetary environment remains decisively bullish, despite the Fed’s new pledge to begin to unwind assets accumulated during its QE program.
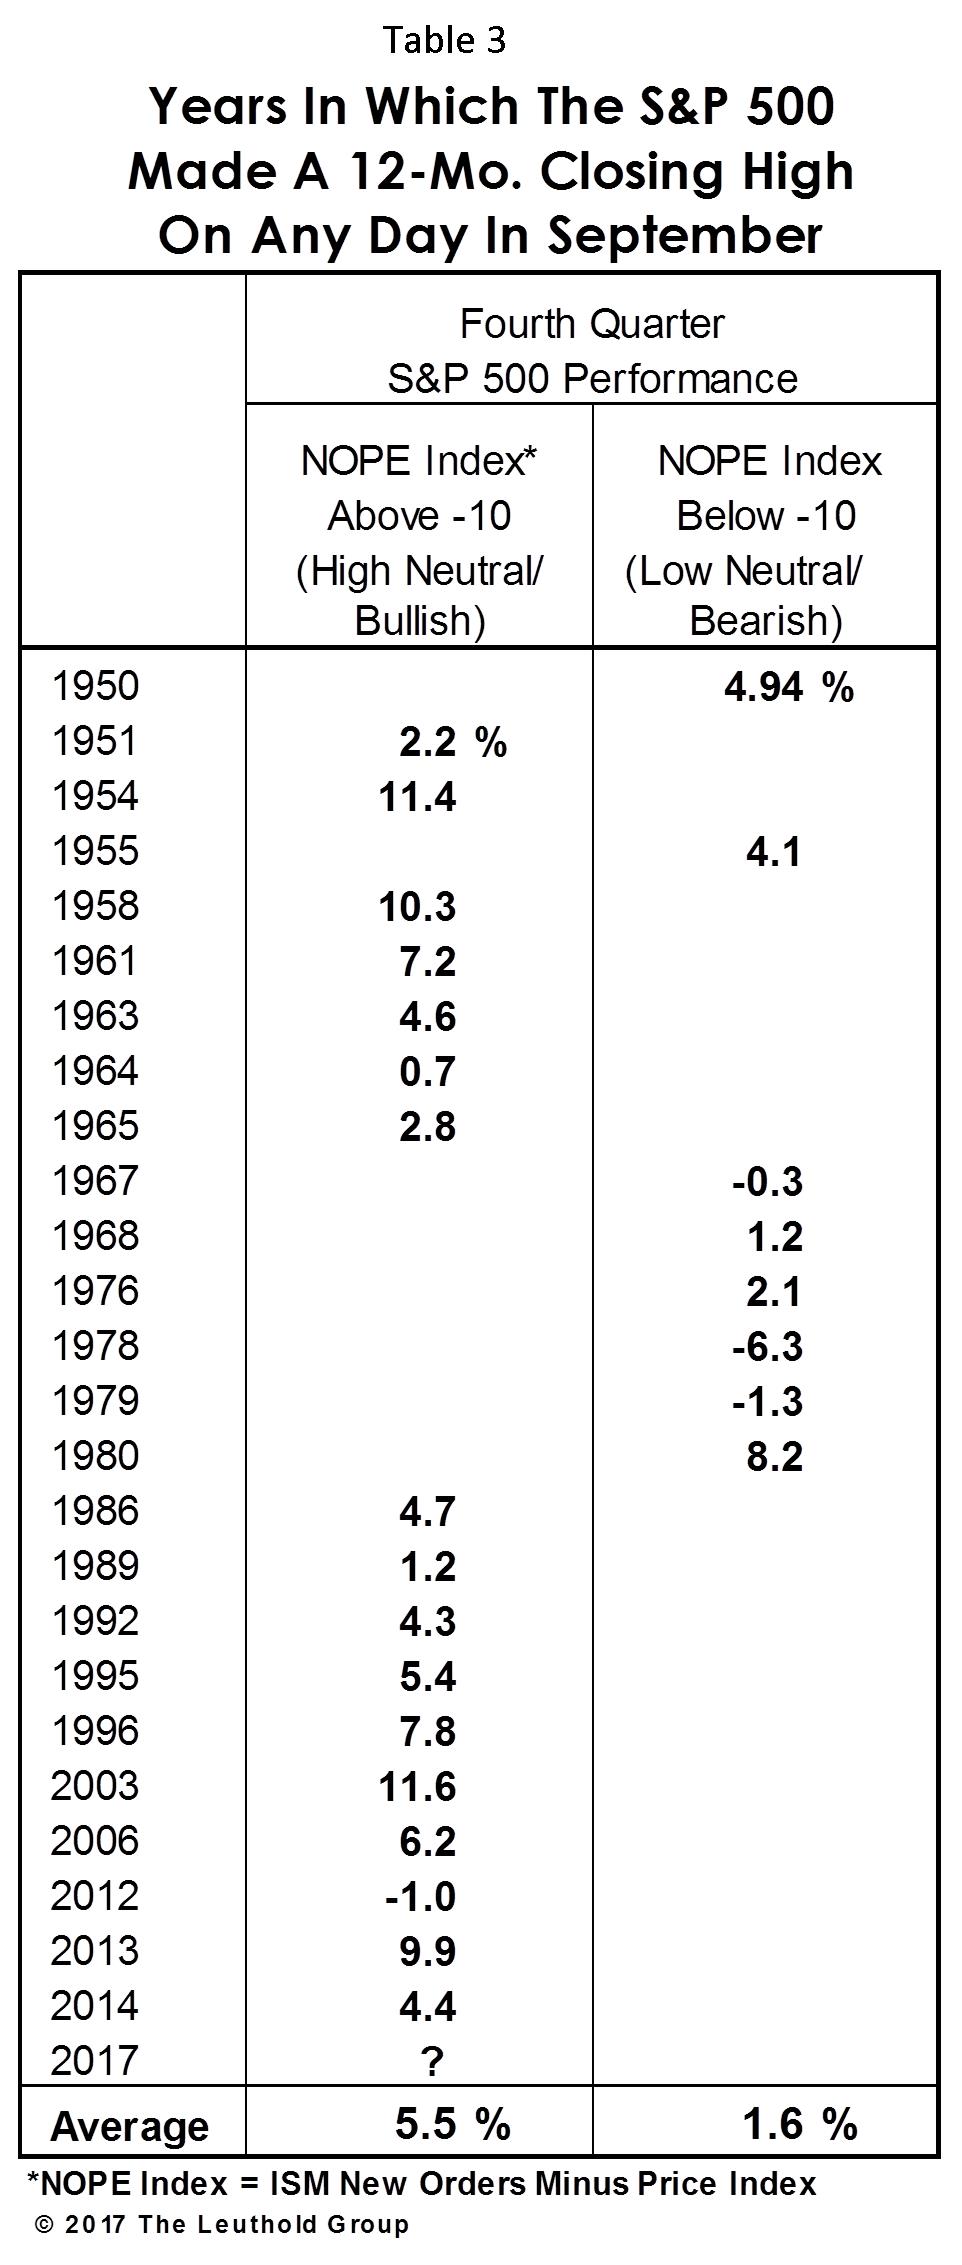
Finally, we considered an economic measure that’s shown a high degree of correlation with the stock market’s short term outlook—the NOPE Index (the spread between ISM New Orders and the Price Index). Interestingly, the “explanatory” power of this economic indicator was almost identical to the technical and monetary tools we examined in Tables 1 & 2. When a September S&P 500 new high coincided with a NOPE Index that was on either a high neutral or bullish reading (Table 3, left column), the average fourth quarter market gain was 5.5%—versus a 1.6% gain when the NOPE Index was low neutral or bearish (Table 3, right column). Just as with the A/D Line and Corporate Bond Index, the current NOPE Index reading is supportive of a fourth quarter rally.
Technicians are fond of saying that the most bullish thing a market can do is to make a new high. This simple study takes a more nuanced view, finding that the sustainability of a new high is related to its underlying technical, monetary, and economic underpinnings. On that score, this market—as overvalued as it may be—is currently “thrice-blessed,” and we expect even higher highs in the fourth quarter.
Membership required
Membership is now required to use this feature. To learn more:
View Membership BenefitsSponsored Content
Upcoming Virtual Events View All


