Chart of the week
Yield Curve Slope (bps): 30-Year Yield Minus 2-Year Yield.
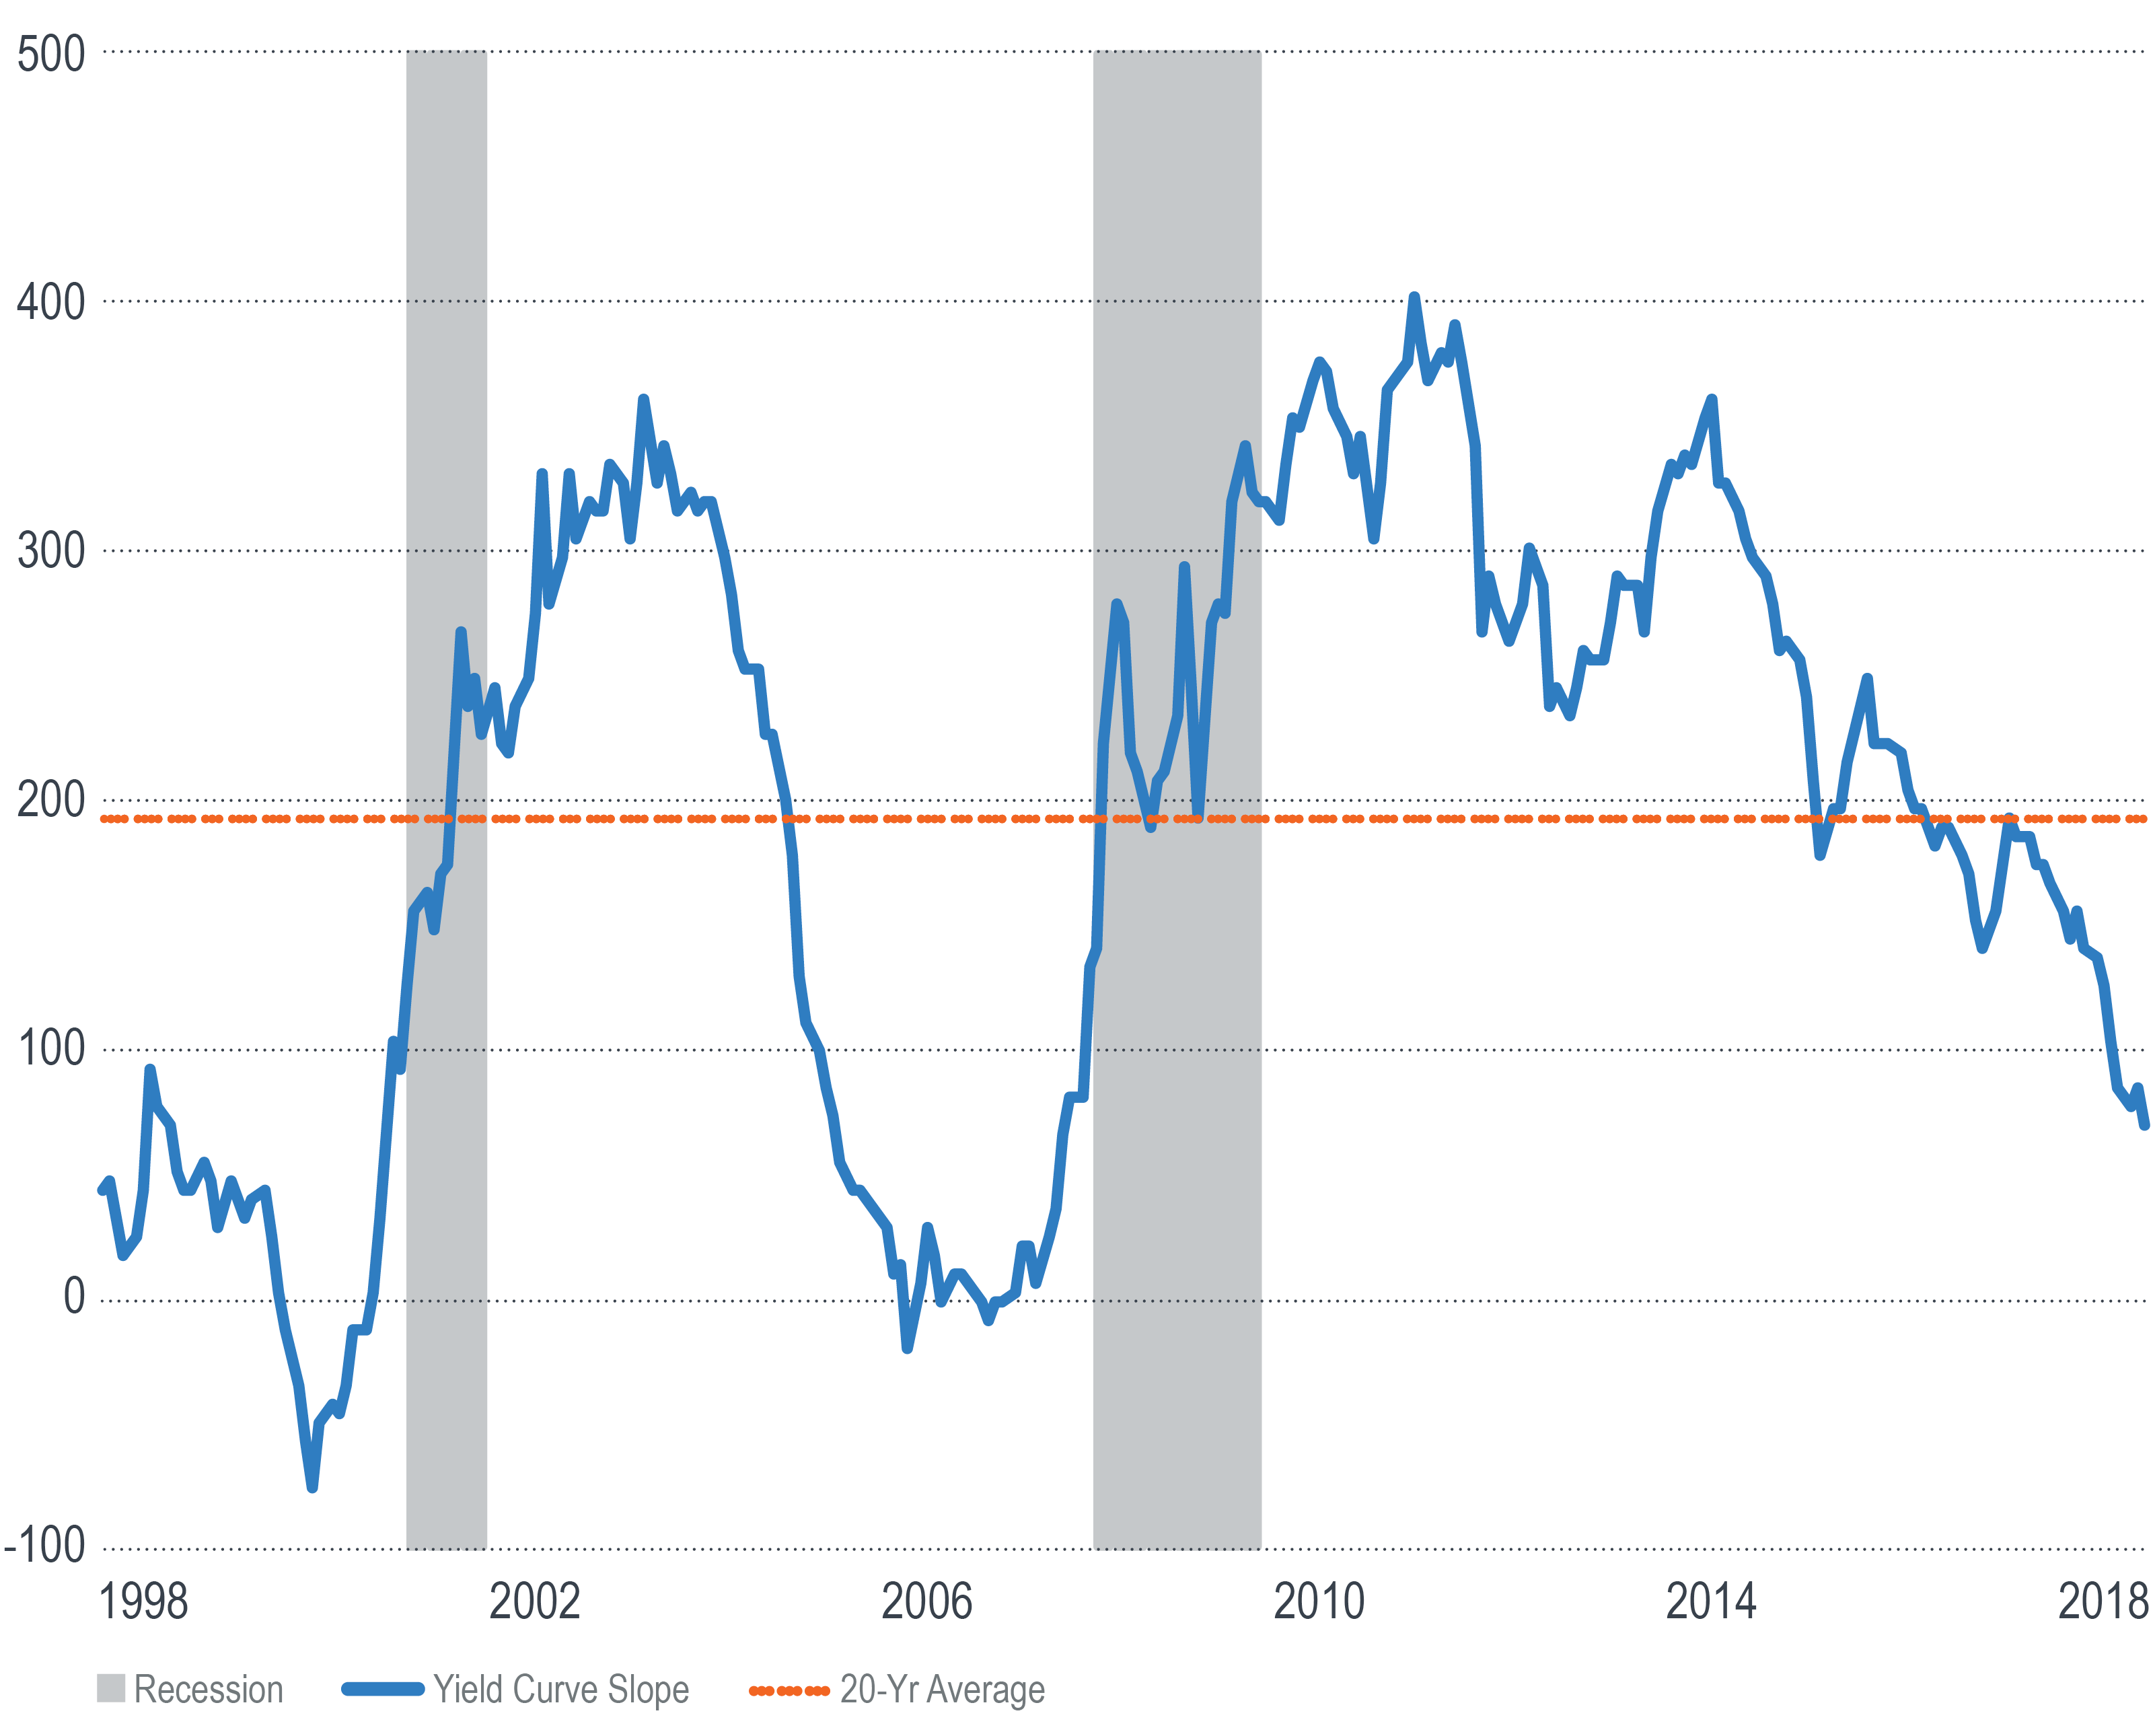
This chart depicts the slope of the US Treasury yield curve, measured as the difference between the 30-year and 2-year yields. The first quarter of 2018 ended with the curve at its flattest slope in more than a decade, and well below its 20-year average.
Over the past year, the 2-year yield has risen 100 basis points to 2.27%, while the 30-year yield fell by five basis points to 2.97%.
Its proximity on the curve to the overnight fed funds rate makes the increase of the 2-year yield easy to understand. At the other end of the curve, however, the stubbornness of the 30-year yield to move higher is more puzzling, especially given the combination of the Fed’s balance sheet normalization and the Treasury’s higher rate of issuance.
A flatter yield curve is often associated with a weaker economic outlook. It’s perhaps no coincidence that the curve slope is trending lower just as equity market volatility is pushing higher. To the extent this yield curve flatness represents more heightened volatility ahead, investors may do well to take extra care in managing portfolio risks.
Unless otherwise noted, data is sourced from Bloomberg.
Recipients must make their own independent decisions regarding any strategies or securities or financial instruments mentioned herein.
The products or services described or referenced herein may not be suitable or appropriate for the recipient. Many of the products and services described or referenced herein involve significant risks, and the recipient should not make any decision or enter into any transaction unless the recipient has fully understood all such risks and has independently determined that such decisions or transactions are appropriate for the recipient.
The results shown are historical, for informational purposes only, and do not guarantee future results.
Any discussion of risks contained herein with respect to any product or service should not be considered a disclosure of all risks or a complete discussion of the risks involved.
The recipient should not construe any of the material contained herein as investment, hedging, trading, legal, regulatory, tax, accounting or other advice. The recipient should not act on any information in this document without consulting its investment, hedging, trading, legal, regulatory, tax, accounting and other advisors.
The materials in this document represent the opinion of the authors and are not representative of the views of Milliman, Inc. Milliman does not certify the information, nor does it guarantee the accuracy and completeness of such information. Use of such information is voluntary and should not be relied upon unless an independent review of its accuracy and completeness has been performed. Materials may not be reproduced without the express consent of Milliman.
Data included in this document has been sourced from providers that Milliman FRM believes to be reliable from information available publicly or with consent of the provider of the source material. To the fullest extent permitted by law, no representation or warranty, express or implied is made by Milliman FRM as to the accuracy or completeness of the source data or any other information in this document.
For financial professional use only.


