Geopolitical developments, including a historic walk across a line, continued to make headlines in April. In a tit-for-tat sequence, the U.S. and China announced a series of retaliations that many feared could descend into a trade war: China’s Ministry of Commerce responded to previously announced levies on imports of steel and aluminum as well as Section 301 tariffs from the U.S. with additional duties on American products. President Donald Trump then rattled markets by calling for additional tariffs on Chinese goods worth $100 billion, and China later imposed an antidumping deposit on U.S.-grown sorghum. Trade tensions subsided, however, following reports that U.S. Treasury Secretary Steven Mnuchin would travel to Beijing to discuss the dispute. In a sign of moderating tensions on the Korean peninsula, Kim Jong-un became the first North Korean leader to cross into the South Korea-controlled side of the border to attend a summit hosted by President Moon Jae-in. The one-day summit concluded in a joint statement calling for a peace treaty and continued dialogue on denuclearization, setting the stage for upcoming U.S.-North Korea discussions. In Syria, conflict continued to escalate: The U.S., U.K. and France fired a barrage of missiles at military targets inside the country following an alleged chemical weapons attack by the Assad regime. The U.S. also followed with stiff sanctions against Russia for “malign activity,” including its support of President Bashar al-Assad and involvement in the civil war.
Central bank rhetoric appeared to diverge as economic data were more mixed. According to minutes from the Federal Reserve’s March meeting, several officials cited a stronger economic outlook and greater confidence in inflation meeting the 2% target as justification for a slightly steeper interest rate path. Signs of rising inflation were supported by a Labor Department report showing that private-sector wages and salaries increased 2.9% from a year earlier. However, first quarter real GDP growth slowed to an annualized 2.3%, below the nearly 3% recent trend but better than consensus expectations. In contrast to the Fed’s upbeat tone, the Bank of Canada, European Central Bank and Bank of England (BOE) all stressed caution in their economic outlooks, focusing on downside risks as growth slowed, particularly in Europe. BOE Governor Mark Carney’s cautious comments poured cold water on expectations for a May rate hike, causing the British pound to weaken. The IMF also provided mixed guidance on global growth, forecasting a cyclical upswing in 2018−2019 but citing growing downside risks due to trade tensions, tightening financial conditions and geopolitical pressures.
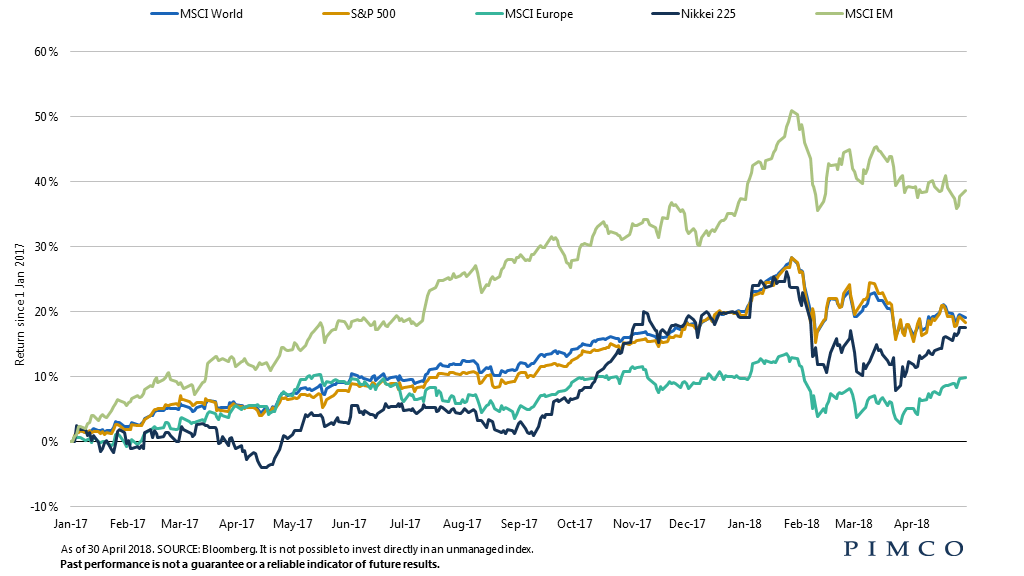
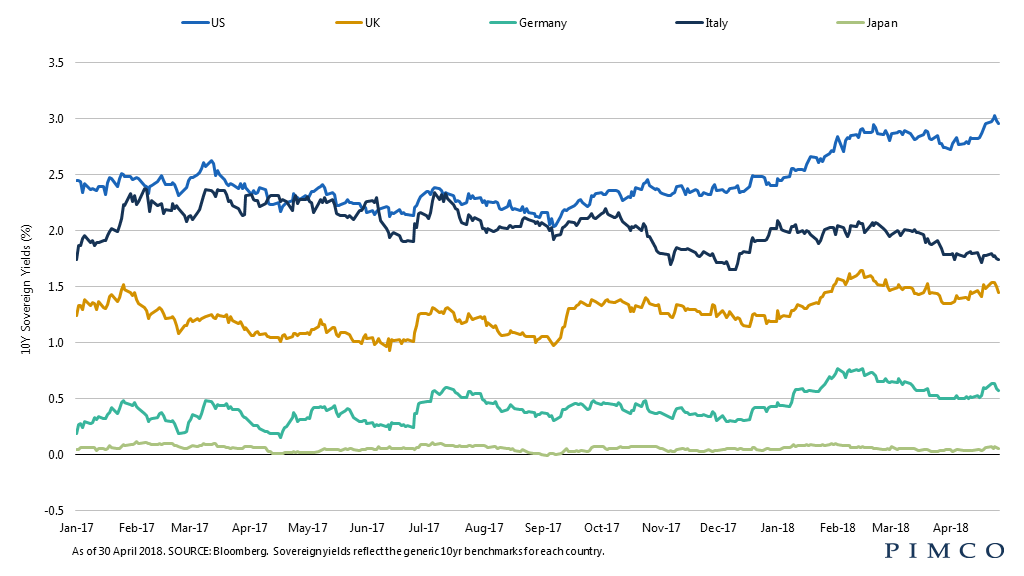
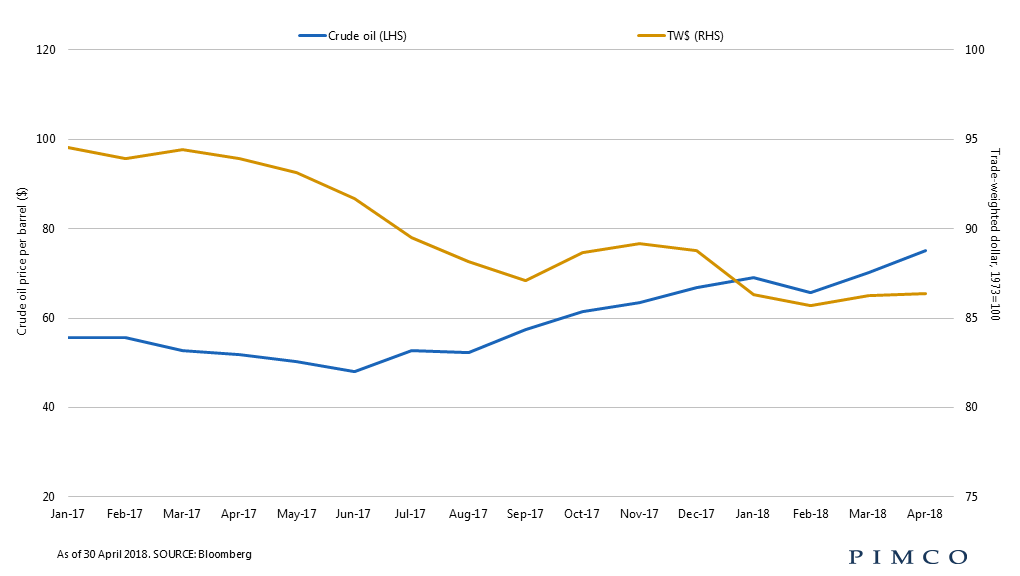
The U.S. 10-year Treasury yield briefly crossed the 3% mark in April. The yield last crossed the 3% threshold in early 2014, then more than halved to 1.4% in mid-2016, only to double by 2018. Solid growth trends and rising inflation contributed to the 21-basis-point climb in the U.S. 10-year yield over the month. In contrast, rate moves in Germany, Japan and the U.K. were relatively subdued. In commodity markets, crude oil added inflationary pressure, with the price for Brent rising 7% on the month and ending above $75 a barrel. The U.S. dollar gained against most developed and emerging market counterparts. A 9% drop in the Russian ruble in response to U.S. trade sanctions led the decline in emerging market currencies; the Brazilian real also fell nearly 6%. Developed market equity indexes ended in slightly positive territory, as investors shrugged off trade jitters in early April. Notably, the energy sector1 returned over 9% on the month alongside resurgent crude oil prices.
Taking the Long View The 10-year U.S. Treasury yield garnered much attention in April when it flirted with the headline-grabbing 3% threshold. While round numbers can be of psychological importance to investors, the more tangible consideration is what rising rates mean for fixed income portfolios. While increases in rates can be painful in the short term – since bond prices move inversely to yields – they have proven to be beneficial to fixed income portfolios over a longer period. Looking at the Bloomberg Barclays U.S. Aggregate Bond Index, a proxy for core bonds, the chart shows historical average annual returns over three years based on the starting yield of the index. Today’s starting yield is 3.3%; the chart shows that when the starting yield was in the 3%–4% range, bonds have historically returned over 4.5% − more than a full percentage point higher than when yields were in the 2.5%–3.0% range. For investors, then, higher rates should be welcome in the long run.
Market snapshot
EQUITIES
Developed market stocks2 rose 1.1% over the month as strong fundamentals reemerged and Q1 earnings generally surprised to the upside. Stocks in the U.S.3 increased 0.4% on strong earnings and improving economic growth, shaking off concerns over possible tariffs and rising interest rates. European equities4rose 4.6%, spurred by solid earnings and marginally dovish indications from the European Central Bank (ECB), while stocks in Japan5 gained 4.7% as broader “risk-on” sentiment recovered thanks to a decrease in geopolitical tensions.
Overall, emerging markets6 stocks lost 0.4% in April, unable to recover from concerns over trade tensions and appreciation of the U.S. dollar, but performance differed widely among countries. In Brazil7, stocks gained 0.9% on the back of continued equity inflows to Latin America, while Chinese8 equities fell 2.7% largely due to trade tension concerns. Indian9 stocks soared 6.6% on positive global earnings and growth optimism, and despite a new round of U.S. sanctions and a single-day drawdown of about 8%, Russian10equities rose 1.6% over the month, supported by the continued rise in energy prices.
DEVELOPED MARKET DEBT
In the U.S., yields continued to climb higher as trade tensions subsided and expectations of higher inflation persisted. Minutes from the recent Federal Reserve meeting indicating confidence in the economic outlook and inflation returning to target, further supported the move higher in yields. The U.S. 10-year Treasury yield briefly surpassed 3% for the first time since January 2014 and ended the month 21 basis points (bps) higher at 2.95%. The rise in U.S. rates was accompanied by similar but slightly more muted moves in other developed markets. In Germany, 10-year bund yields rose 6 bps over the month, despite a cautious tone from ECB President Mario Draghi as the policy rate was left unchanged. In the U.K., weak inflation and growth data along with dovish comments from Bank of England (BOE) Governor Mark Carney lowered market expectations of a May rate hike. Still, the U.K. 10-year rate ended the month 7 bps higher at 1.42%.
INFLATION-LINKED DEBT
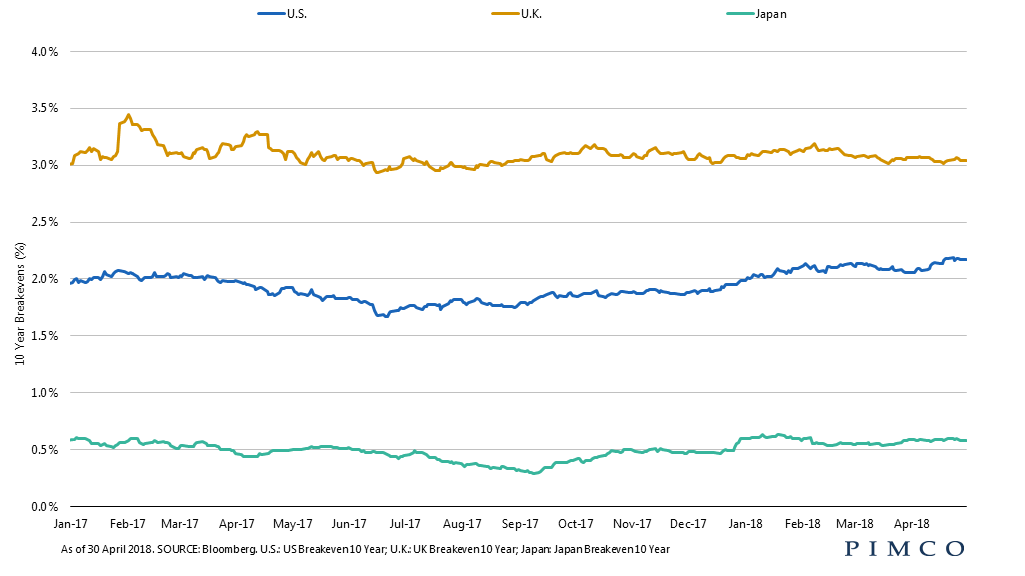
Global inflation-linked bonds (ILBs) posted negative returns but outperformed comparable nominal bonds in April. The Bloomberg Barclays U.S. TIPS (Treasury Inflation-Protected Securities) Index returned -0.06% for the month. Real yields moved higher and the yield curve flattened, as economic data remained firm and Fed officials signaled an optimistic outlook for both growth and prices. U.S. breakeven inflation rates (BEI) gained thanks to rising commodity prices, led by a jump in crude oil, despite the headwinds from a stronger U.S. dollar. In the U.K., index-linked gilts posted losses. U.K. rates rose in anticipation of a May rate hike by the BOE but then fell on softer-than-expected economic data. U.K. breakeven rates ended the month largely unchanged as weak inflation prints offset gains from higher commodity prices.
CREDIT
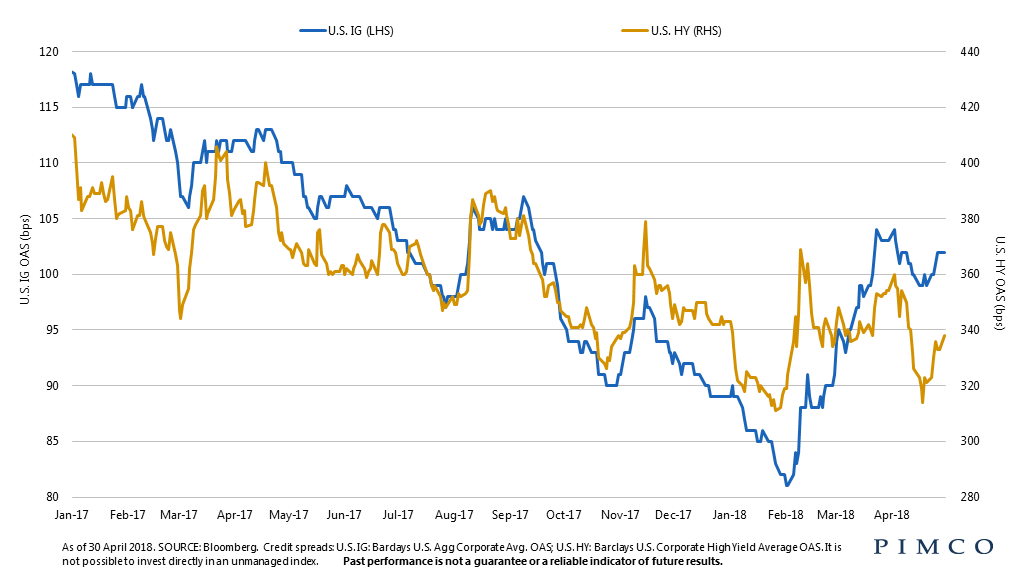
Global investment grade (IG) credit11 spreads were relatively flat, tightening 1 bp in April, and the sector outperformed like-duration global government bonds by 0.14%. Strong global economic growth, stabilization in equity markets and continued demand for high quality credit at higher yields supported spreads during the month.
With global speculative grade yields12 declining 7 bps to 5.6% and government yields rising, spreads compressed month-over-month by close to 25 bps, touching down at 339 bps. The total return for the sector in April was 0.7%, bringing year-to-date returns back into positive territory; the lowest quality triple-C cohort, where rate sensitivity is lowest, led once again.
EMERGING MARKET DEBT
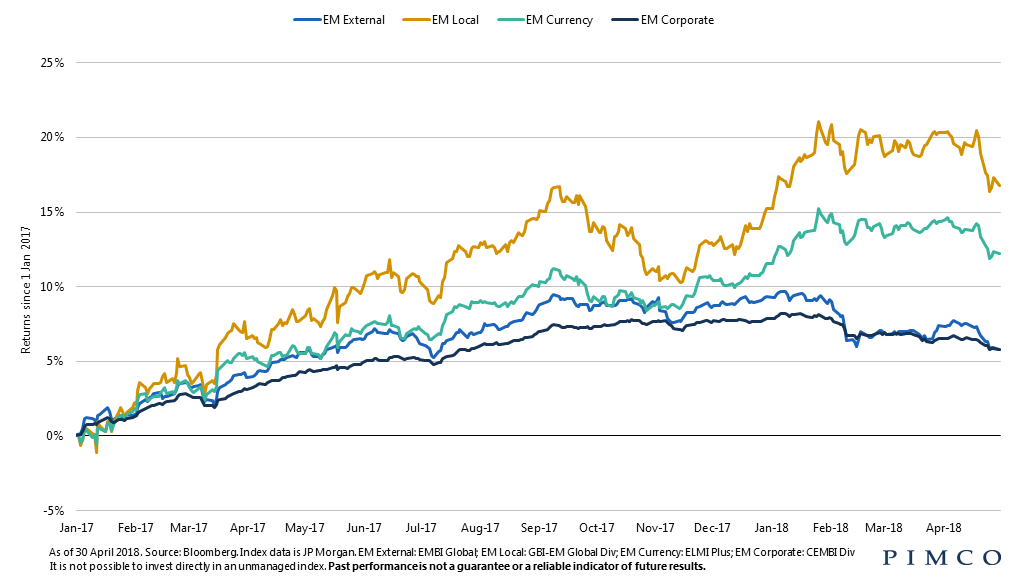
Emerging market (EM) debt returns backed up in April, with all sub-sectors posting negative returns. Higher index yields and EM currency depreciation drove the negative local debt performance, as the U.S. dollar strengthened amid higher U.S. rates. On the external debt side, spread widening and a move higher in underlying U.S. Treasury yields drove returns lower. Russia was a notable underperformer in both external and local debt after the U.S. announced a new round of sanctions targeting prominent Russian government officials and oligarchs. Argentina also lagged the local debt index noticeably, as the peso continued to depreciate amid persistent inflation, despite the central bank’s efforts to arrest its slide.
MORTGAGE-BACKED SECURITIES
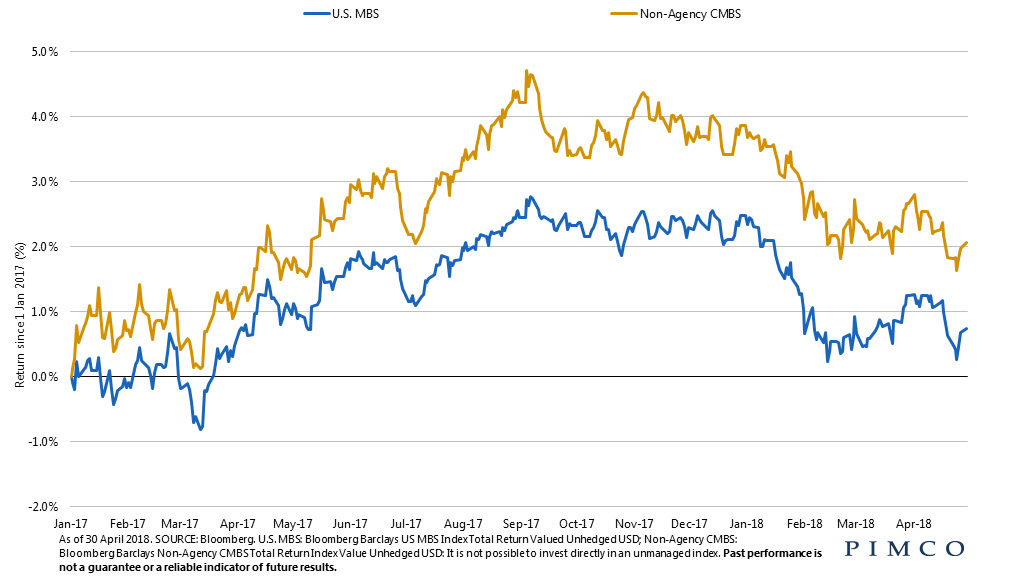
Agency MBS13 returned -0.50% and outperformed like-duration Treasuries by 18 bps during the month. Spreads tightened despite a sharp rise in rates. Lower coupon MBS outperformed higher coupons, while Ginnie Mae MBS modestly outperformed conventional MBS. Ginnie Mae MBS benefitted from improved yield within the sector as well as the announcement that lenders who have been churning borrowers (specifically, through unneeded refinancings on VA loans) will no longer be allowed to issue into comingled Ginnie Mae pools. Gross MBS issuance increased 10% in April, and prepayment speeds increased 16%. Non-agency residential MBS outperformed like-duration Treasuries during the month, while non-agency commercial MBS14 returned -0.60%, outperforming like-duration Treasuries by 24 bps.
MUNICIPAL BONDS
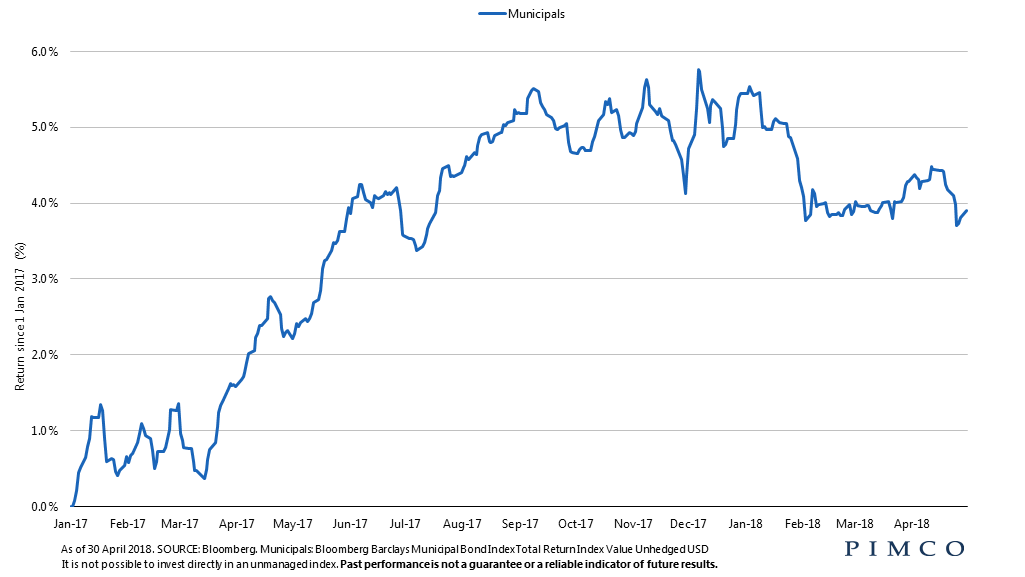
The Bloomberg Barclays Municipal Bond Index returned -0.36% in April, bringing year-to-date returns to -1.46%. Short and intermediate maturities outperformed long maturities as the muni yield curve steepened; lower credit quality munis outperformed as the Bloomberg Barclays High Yield Municipal Bond Index returned 0.45%, bringing year-to-date returns to 1.03%. April supply increased modestly to $30 billion but was still down year-over-year. The light supply was expected after the surge in muni issuance in late 2017 (leading up to U.S. tax reform and the subsequent prohibition of advance refundings). Muni fund flows were negative, but April is a historically weak technical period as investors often sell munis to pay their tax bills.
CURRENCIES
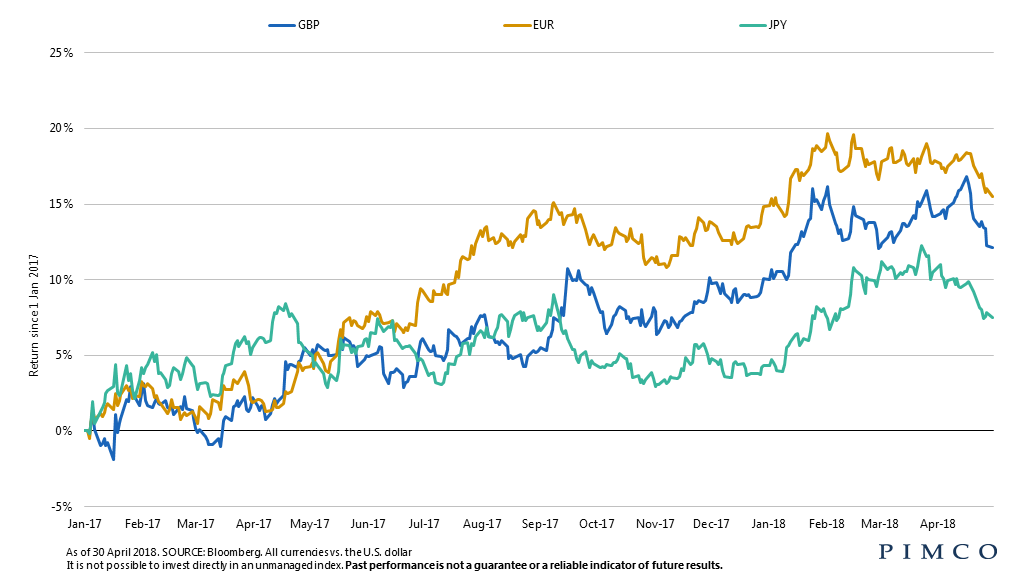
Global currencies broadly weakened against the U.S. dollar, which enjoyed a strong performance due to rising Treasury yields. In the U.K., underwhelming GDP growth hinted at a slowdown in economic activity, wiping away the likelihood of a rate hike and pressuring sterling lower. The euro fared similarly as economic data continued to disappoint, and the currency returned nearly all of its 2018 gains. The Canadian dollar registered the strongest performance among G10 currencies on rising optimism surrounding NAFTA re-negotiations. The strengthening dollar, along with political uncertainty, also weighed on emerging market currencies. The Brazilian real sank as polls failed to offer much clarity on the upcoming presidential election. Meanwhile, the Russian ruble tumbled nearly 9% on the heels of newly imposed U.S. sanctions.
COMMODITIES
Commodities posted strong returns in April. In energy, crude oil continued its upward trajectory, surpassing $75 per barrel for the first time since 2014, as geopolitical turmoil in the Middle East and Venezuela motivated buyers. Natural gas pared its losses when inventory draws proved larger than expected, and ended the month flat. Within agriculture, wheat saw strong support on concerns over dry weather, while corn traded higher on delayed planting. China’s threatened tariffs weighed on soybeans, and sugar posted losses amid heavy producer selling. Base metals were broadly higher over the month. Aluminum hit a six-year high, trading through $2,600 per ton as U.S. sanctions on Russia stoked fears of a supply shortage. Gold fell modestly on a stronger U.S. dollar and higher real yields, while platinum dropped due to oversupply concerns.
Outlook**
Based on PIMCO’s cyclical outlook from March 2018.
PIMCO expects world GDP growth to remain above-trend at 3.0%‒3.5% in 2018, in a “Goldilocks” environment of synchronized global growth and low but gently rising inflation. Still-favorable financial conditions and fiscal support suggest that the Goldilocks environment will continue in 2018. Compared with our December forecast, we now see marginally higher 2018 GDP growth in the U.S., eurozone, U.K. and China, while we lowered our estimates for Mexico and India. The causes of the stronger expansion are more uncertain ‒ favorable shorter-term financial conditions versus a possible longer-term increase in productivity ‒ and these could affect its durability beyond 2018. Our inflation forecasts for 2018 have also risen slightly since our December forecast in response to a higher oil price trajectory.
In the U.S., we look for above-consensus growth of 2.25%–2.75% in 2018. Household and corporate tax cuts should boost growth by 0.3 percentage points in 2018, with another 0.3 percentage points coming from higher federal government spending resulting from the two-year budget deal. With unemployment likely to drop below 4%, we expect some upward pressure on wages and consumer prices, and core inflation to rise above 2% over the course of 2018. Under new leadership, the Federal Reserve is expected to continue tightening gradually; we expect three rate hikes this year, with a fourth likely if economic and financial conditions remain favorable.
For the eurozone, we expect growth will be in a range of 2.25%‒2.75% this year, about the same pace as 2017. The expansion is now broad-based across the region, with growth momentum strong and financial conditions favorable. Core inflation, though, is expected to remain very low, creeping only marginally above 1% this year due to low wage pressures and the appreciation of the euro in 2017. We expect the European Central Bank to end its bond purchase program in September or, after a short taper, by December, though maturing bonds will be reinvested for some time. We do not foresee the first rate increase until mid-2019.
In the U.K., we expect above-consensus growth in the range of 1.5%–2.0% in 2018. Our base case is for a relatively smooth separation from the European Union, which would contribute to business confidence and investment picking up. After seven years of austerity, we also see some scope for stronger government spending. Inflation should fall back toward the 2% target by year-end, with the effect of sterling’s depreciation in 2017 fading. The Bank of England will likely follow a very gradual path higher.
Japan’s GDP growth is expected to remain firm at 1.0%–1.5% in 2018. Fiscal policy should remain supportive ahead of the planned value-added tax hike in 2019. With unemployment below 3% and job growth accelerating, wage growth should pick up further, helping core inflation rise over the year to slightly below 1%. With the appreciating yen providing disinflationary headwinds and the newly appointed deputy governors tilting the Bank of Japan (BOJ) leadership somewhat more dovish, the BOJ may not tweak its yield curve control policy until 2019.
In China, we expect a controlled deceleration in growth to 6.0%–7.0% this year, from 6.8% in 2017. The authorities’ focus is likely to be on controlling financial excesses, particularly in the shadow banking system, and on some fiscal consolidation, chiefly by local governments. We expect inflation to accelerate to 2.5% on stronger core inflation and higher oil prices, inducing the People’s Bank of China to tighten policy by raising official interest rates, versus the consensus expectation of no hikes. We are broadly neutral on the yuan and expect the authorities to control capital flows tightly to keep exchange rate volatility low.
In Brazil, Russia, India and Mexico, we expect growth to collectively rise to 4% in 2018, slightly above consensus, with modest upside risk from the growth rebound in India. Emerging markets are catching up to the recovery in developed markets, with improving fundamentals and greater differentiation among countries. This recovery is likely to be shallower and slower than others, however; EM potential growth has fallen, and key political events are likely to keep investors cautious. We expect inflation to stabilize around 4.1%, also above consensus as most of the decline in EM inflation thus far appears cyclical rather than structural.
** Note that all GDP and inflation forecasts will be subject to revision when conclusions from PIMCO’s May secular forum are published later this month.
DISCLOSURES
Past performance is not a guarantee or a reliable indicator of future results. All investments contain risk and may lose value. Investing in the bond market is subject to risks, including market, interest rate, issuer, credit, inflation risk and liquidity risk. The value of most bonds and bond strategies is impacted by changes in interest rates. Bonds and bond strategies with longer durations tend to be more sensitive and volatile than those with shorter durations; bond prices generally fall as interest rates rise, and the current low interest rate environment increases this risk. Current reductions in bond counterparty capacity may contribute to decreased market liquidity and increased price volatility. Bond investments may be worth more or less than the original cost when redeemed. Investing in foreign denominatedand/or -domiciled securities may involve heightened risk due to currency fluctuations, and economic and political risks, which may be enhanced in emerging markets. Currency rates may fluctuate significantly over short periods of time and may reduce the returns of a portfolio. Mortgage- and asset-backed securities may be sensitive to changes in interest rates, subject to early repayment risk, and while generally supported by a government, government-agency or private guarantor, there is no assurance that the guarantor will meet its obligations. Sovereign securities are generally backed by the issuing government. Obligations of U.S. government agencies and authorities are supported by varying degrees, but are generally not backed by the full faith of the U.S. government. Portfolios that invest in such securities are not guaranteed and will fluctuate in value. Income from municipal bonds may be subject to state and local taxes and at times the alternative minimum tax; a strategy concentrating in a single or limited number of states is subject to greater risk of adverse economic conditions and regulatory changes. Inflation-linked bonds (ILBs) issued by a government are fixed income securities whose principal value is periodically adjusted according to the rate of inflation; ILBs decline in value when real interest rates rise. Treasury Inflation- Protected Securities (TIPS) are ILBs issued by the U.S. government. Income from municipal bonds may be subject to state and local taxes and at times the alternative minimum tax. Corporate debt securities are subject to the risk of the issuer’s inability to meet principal and interest payments on the obligation and may also be subject to price volatility due to factors such as interest rate sensitivity, market perception of the creditworthiness of the issuer and general market liquidity. Equities may decline in value due to both real and perceived general market, economic and industry conditions. Commodities contain heightened risk, including market, political, regulatory and natural conditions, and may not be suitable for all investors. It is not possible to invest directly in an unmanaged index.
PIMCO does not provide legal or tax advice. Please consult your tax and/or legal counsel for specific tax or legal questions and concerns. The discussion herein is general in nature and is provided for informational purposes only. There is no guarantee as to its accuracy or completeness. Any tax statements contained herein are not intended or written to be used, and cannot be relied upon or used for the purpose of avoiding penalties imposed by the Internal Revenue Service or state and local tax authorities. Individuals should consult their own legal and tax counsel as to matters discussed herein and before entering into any estate planning, trust, investment, retirement, or insurance arrangement.
This material contains the opinions of the manager and such opinions are subject to change without notice. This material has been distributed for informational purposes only. Forecasts, estimates and certain information contained herein are based upon proprietary research and should not be considered as investment advice or a recommendation of any particular security, strategy or investment product. Information contained herein has been obtained from sources believed to be reliable, but not guaranteed. No part of this material may be reproduced in any form, or referred to in any other publication, without express written permission. PIMCO is a trademark of Allianz Asset Management of America L.P. in the United States and throughout the world.