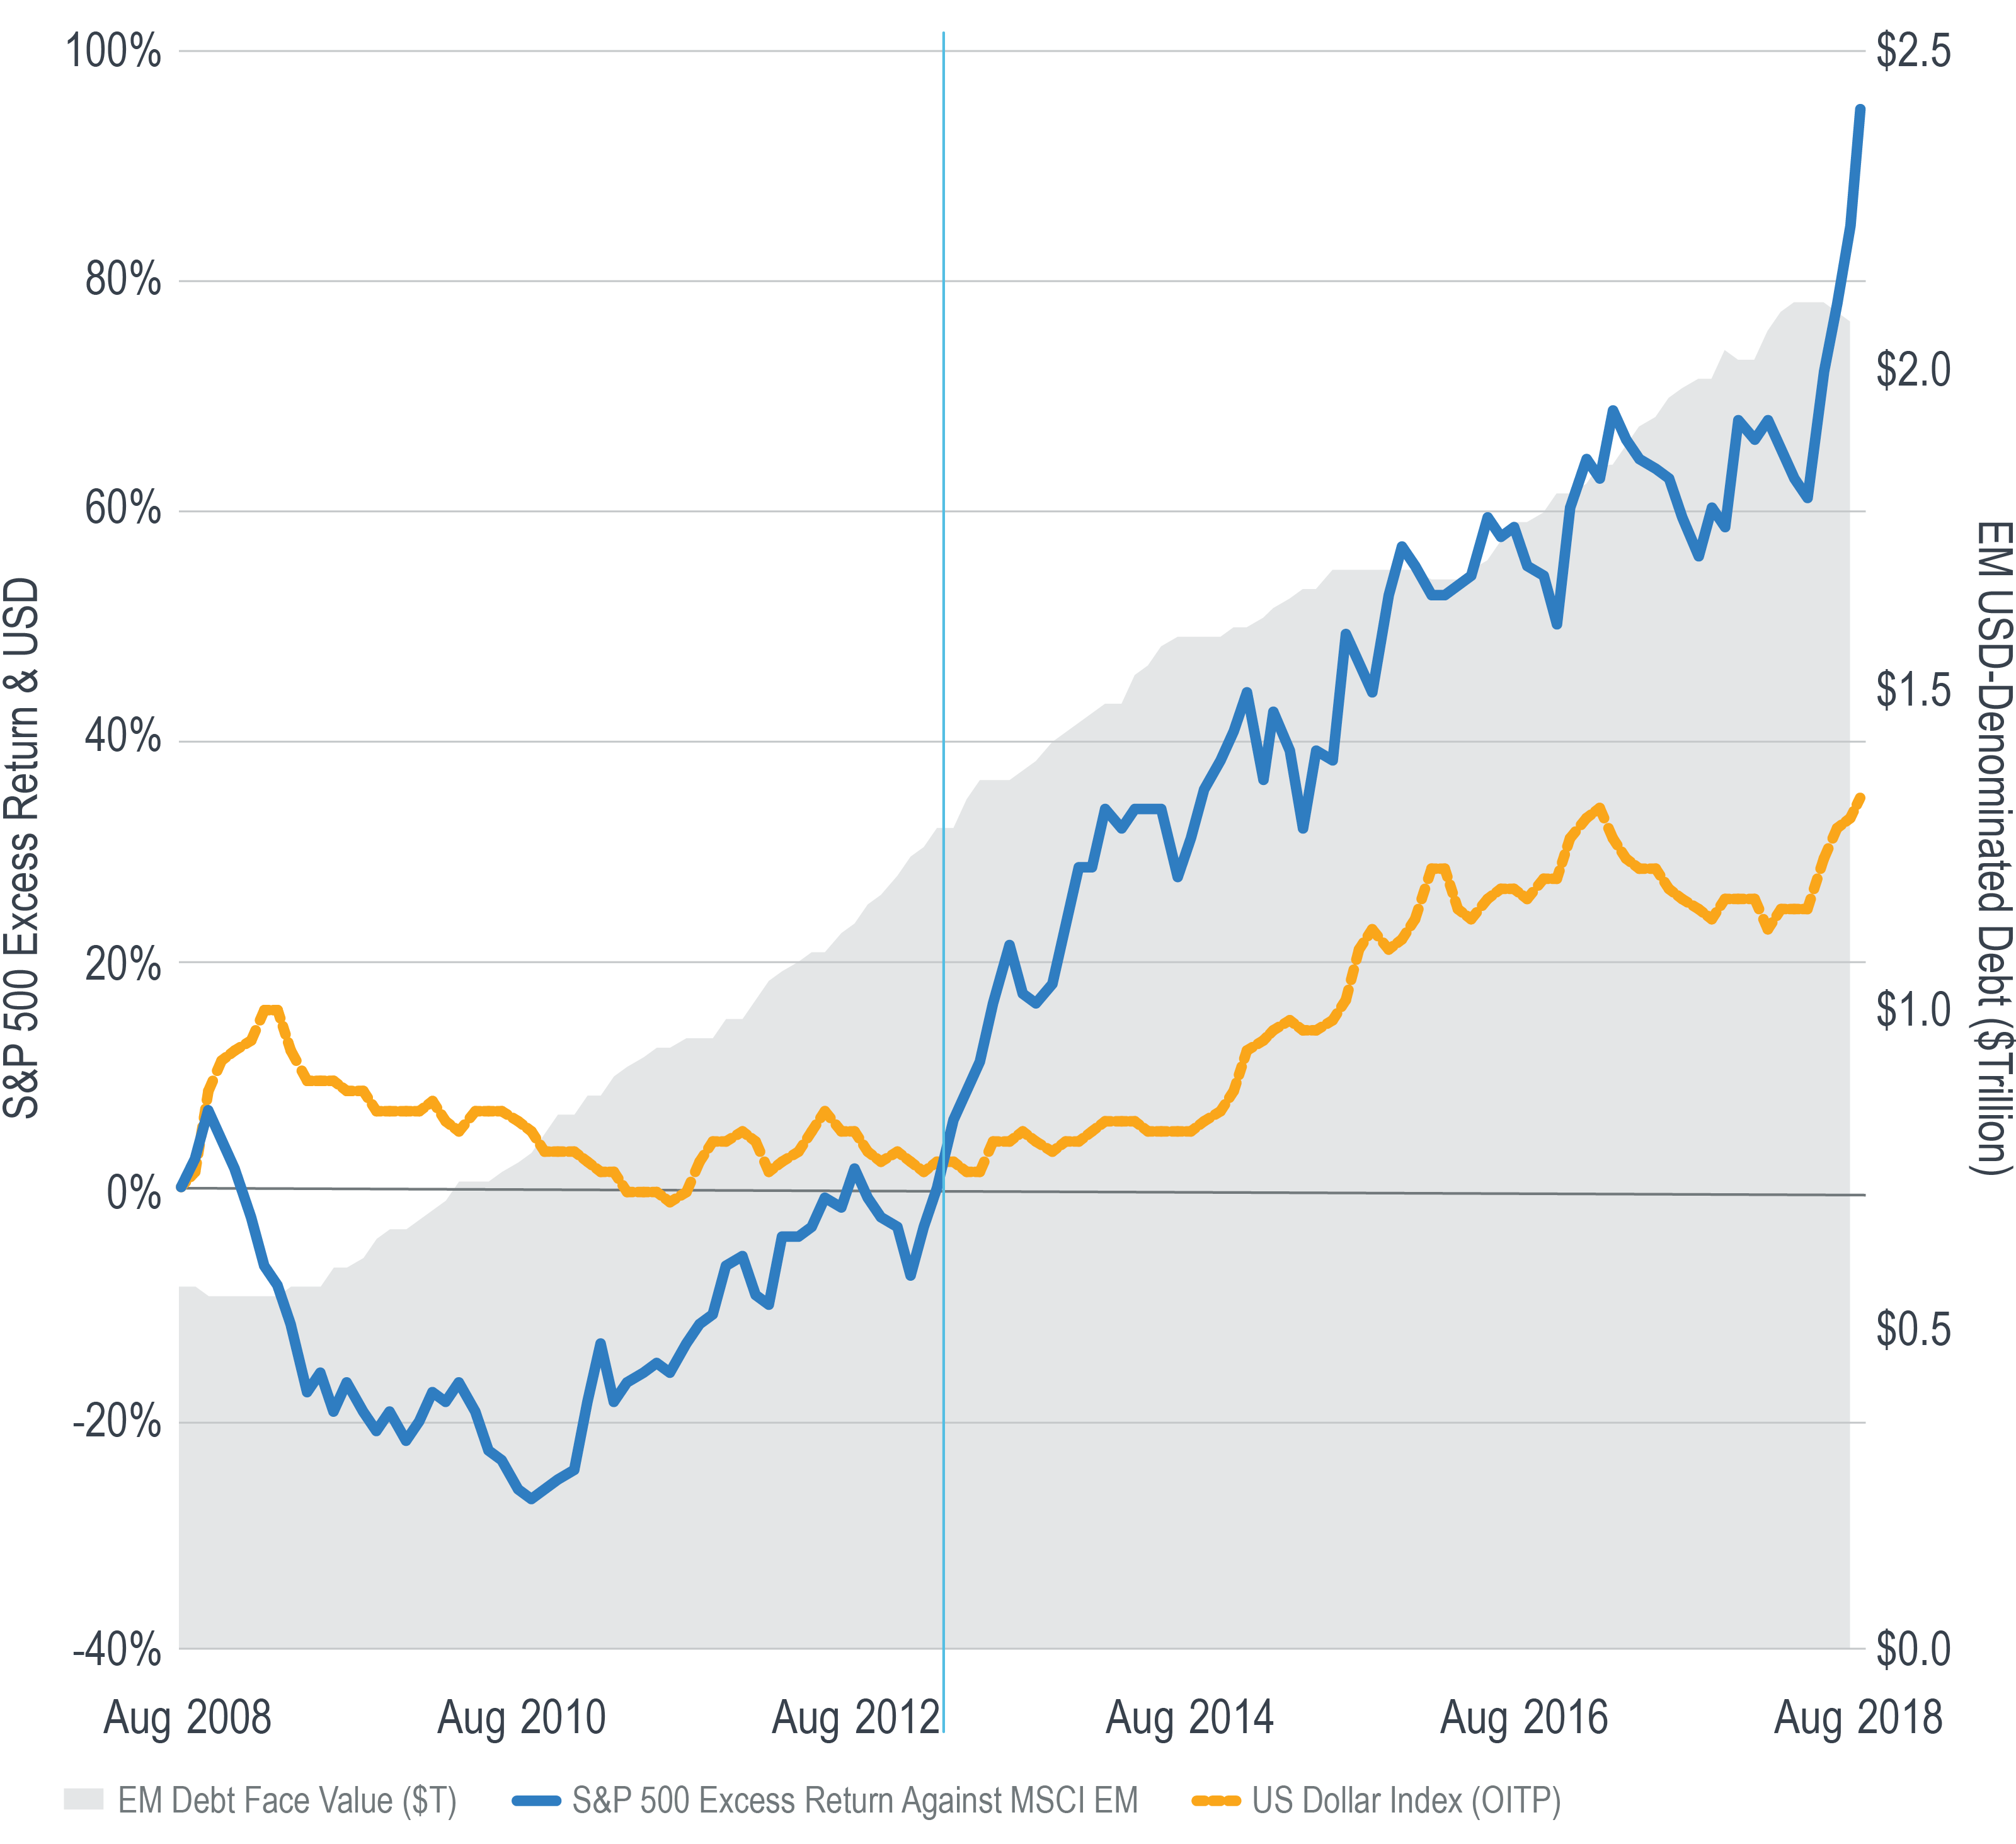
Over the last 10 years, the amount of corporate and sovereign emerging market (“EM”) debt denominated in USD has increased 270% to more than $2 trillion.1
The US Dollar Index of Other Important Trading Partners (OITP) measures the value of the US dollar relative to a trade-weighted basket of EM currencies. This index has been trending steadily higher for the last five years.
It is arguably no coincidence that shortly before the dollar began its upward trend in May 2013, the cumulative excess return of the S&P 500 against the MSCI EM Index turned positive. It has been widening ever since and has accelerated since the end of April 2018.
Worth noting is that this excess return is measured against the local currency version of the MSCI Index – the excess return is not a direct result of currency depreciation.
There may, however, be an indirect currency effect via the debt.
By virtue of the dollar moving higher against EM currencies, the cost of servicing this $2 trillion of bonds has increased. Since the end of April 2018, the US Dollar Index (OITP) has risen 7.4%. This increased cost puts pressure on EM issuers, making it increasingly more difficult for them to both service their existing debt, and by extension, tap into the credit markets that have fueled much of their growth in recent years.
Meanwhile, the S&P 500 has outperformed the MSCI EM Local Index by 14.5% over the same period, with much less volatility. To the extent the dollar continues to rise against EM currencies, EM stocks may be expected to exhibit increasingly higher volatility relative to US equities.
1As measured by the face value of the bonds in the ICE BofAML US Emerging Markets External Debt Sovereign & Corporate Plus Index.
Unless otherwise noted, data is sourced from Bloomberg.
Recipients must make their own independent decisions regarding any strategies or securities or financial instruments mentioned herein.
The products or services described or referenced herein may not be suitable or appropriate for the recipient. Many of the products and services described or referenced herein involve significant risks, and the recipient should not make any decision or enter into any transaction unless the recipient has fully understood all such risks and has independently determined that such decisions or transactions are appropriate for the recipient.
The results shown are historical, for informational purposes only, and do not guarantee future results.
Any discussion of risks contained herein with respect to any product or service should not be considered a disclosure of all risks or a complete discussion of the risks involved.
The recipient should not construe any of the material contained herein as investment, hedging, trading, legal, regulatory, tax, accounting or other advice. The recipient should not act on any information in this document without consulting its investment, hedging, trading, legal, regulatory, tax, accounting and other advisors.
The materials in this document represent the opinion of the authors and are not representative of the views of Milliman, Inc. Milliman does not certify the information, nor does it guarantee the accuracy and completeness of such information. Use of such information is voluntary and should not be relied upon unless an independent review of its accuracy and completeness has been performed. Materials may not be reproduced without the express consent of Milliman.
Data included in this document has been sourced from providers that Milliman FRM believes to be reliable from information available publicly or with consent of the provider of the source material. To the fullest extent permitted by law, no representation or warranty, express or implied is made by Milliman FRM as to the accuracy or completeness of the source data or any other information in this document.