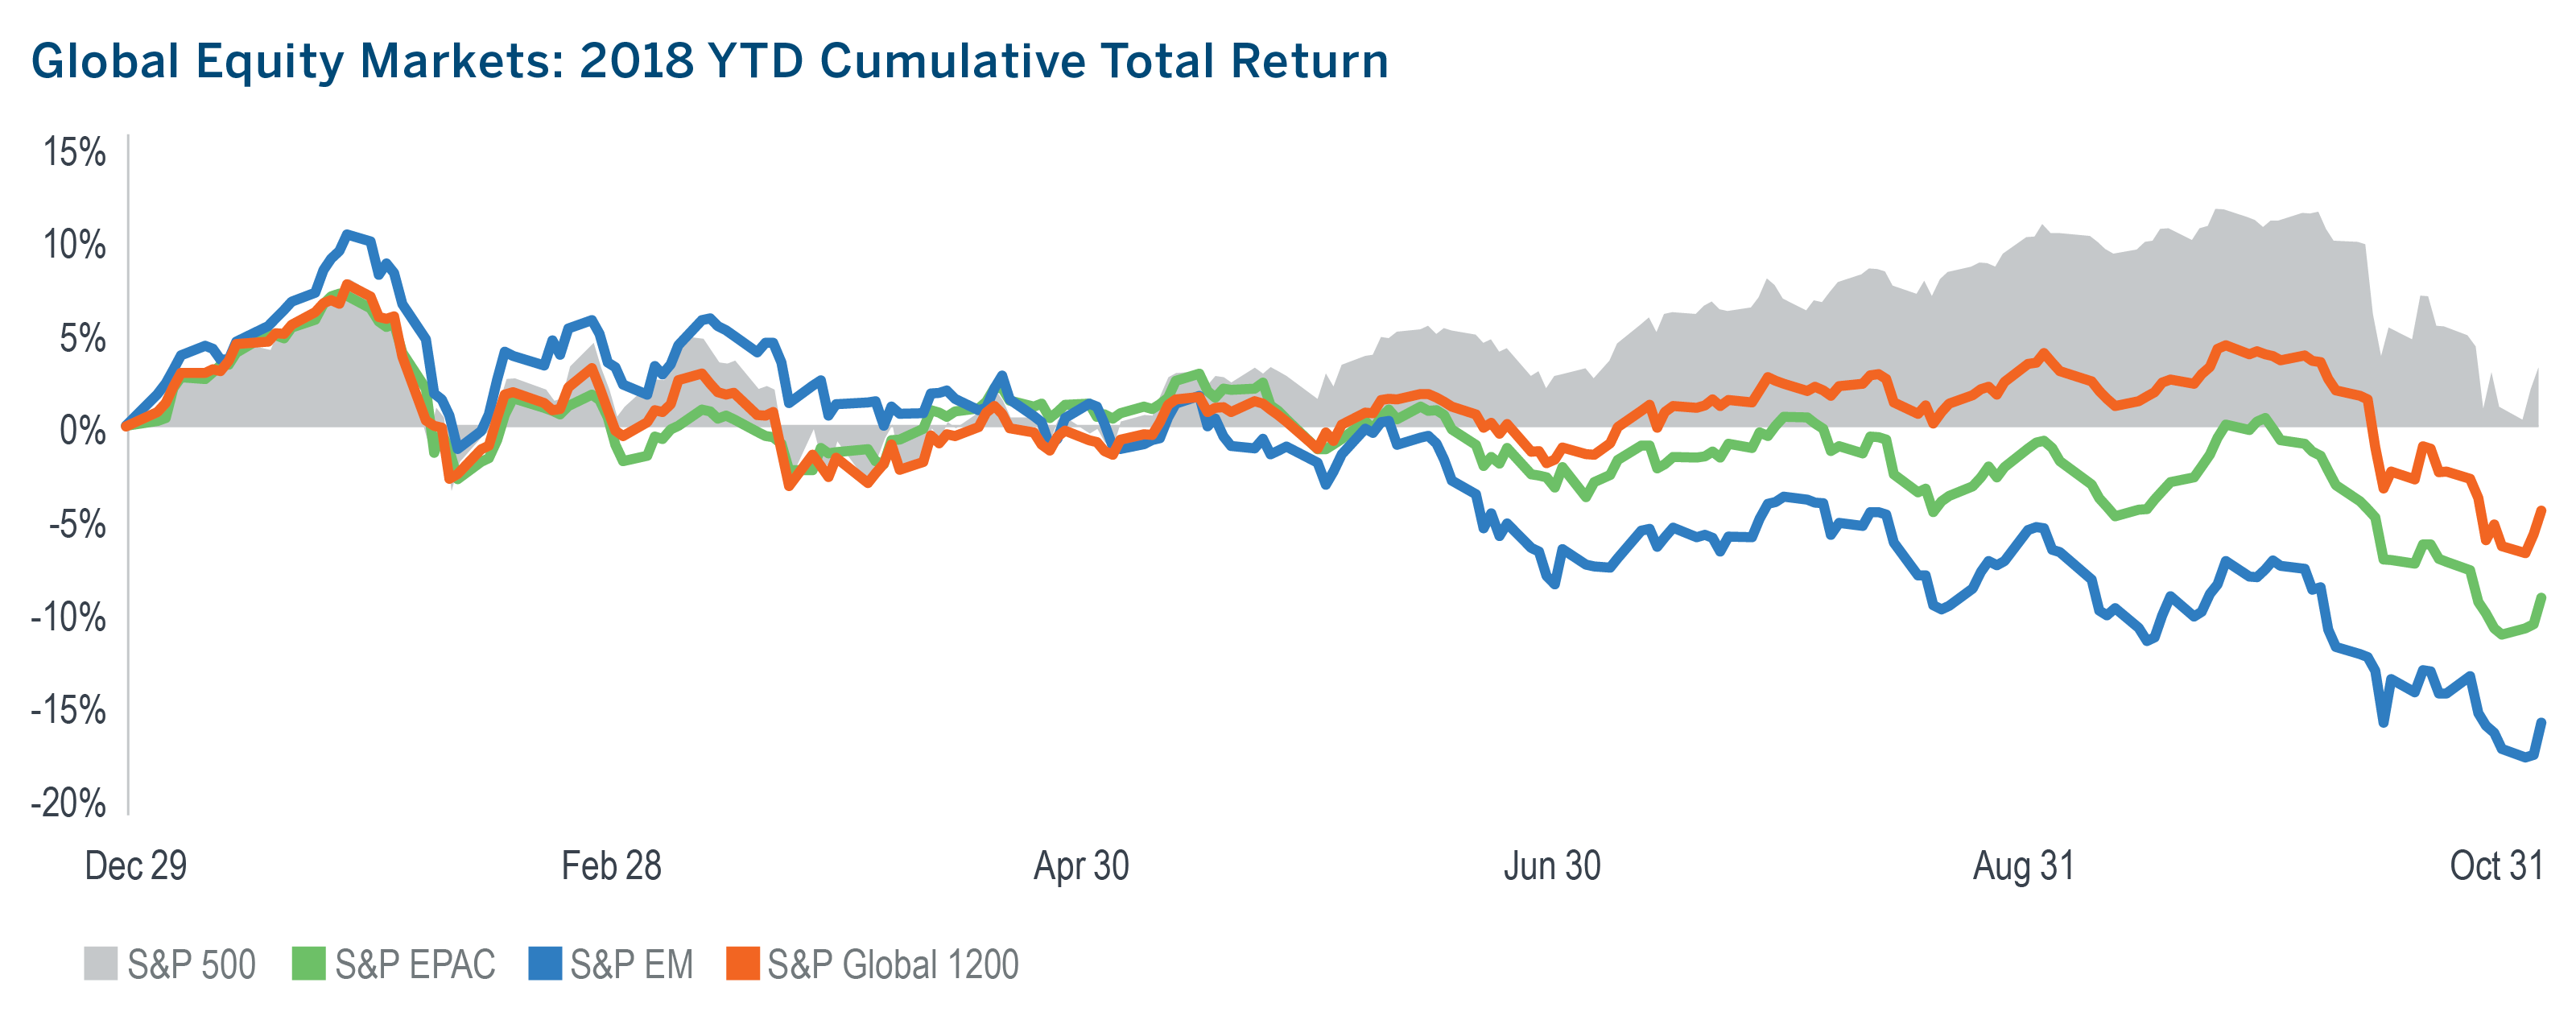
S&P 500 Posts Deepest Monthly Loss In Seven Years
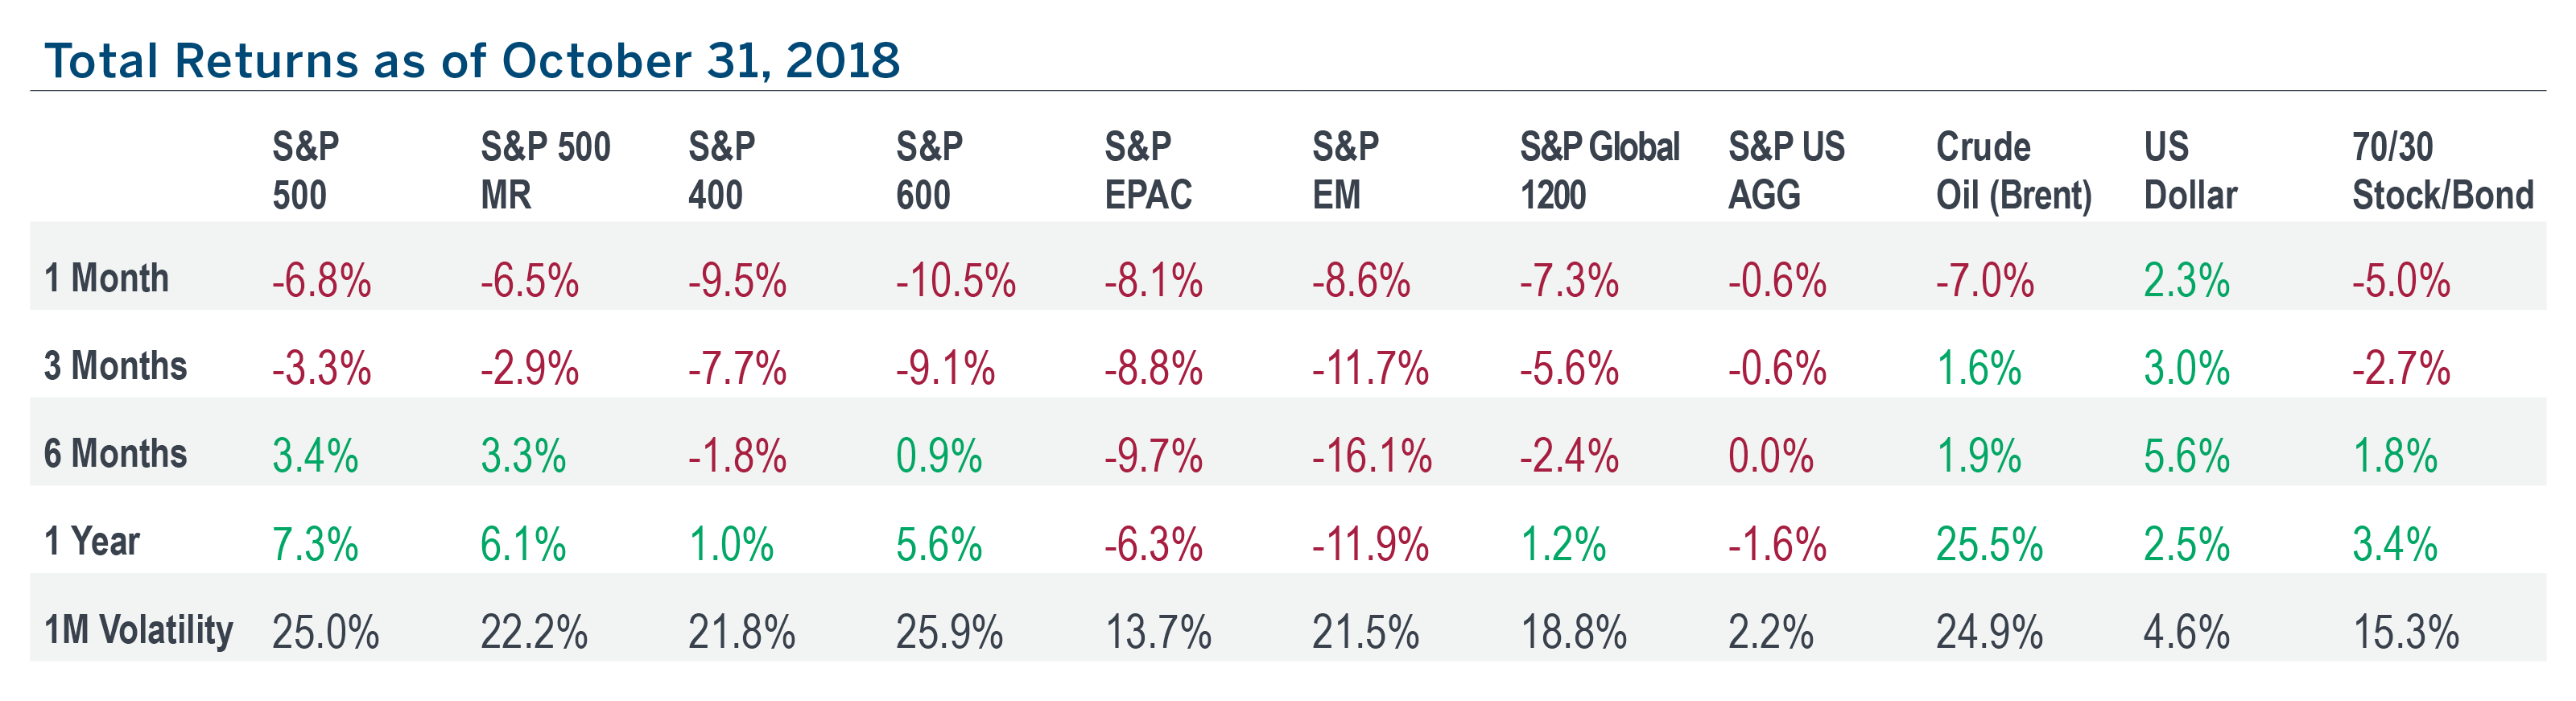
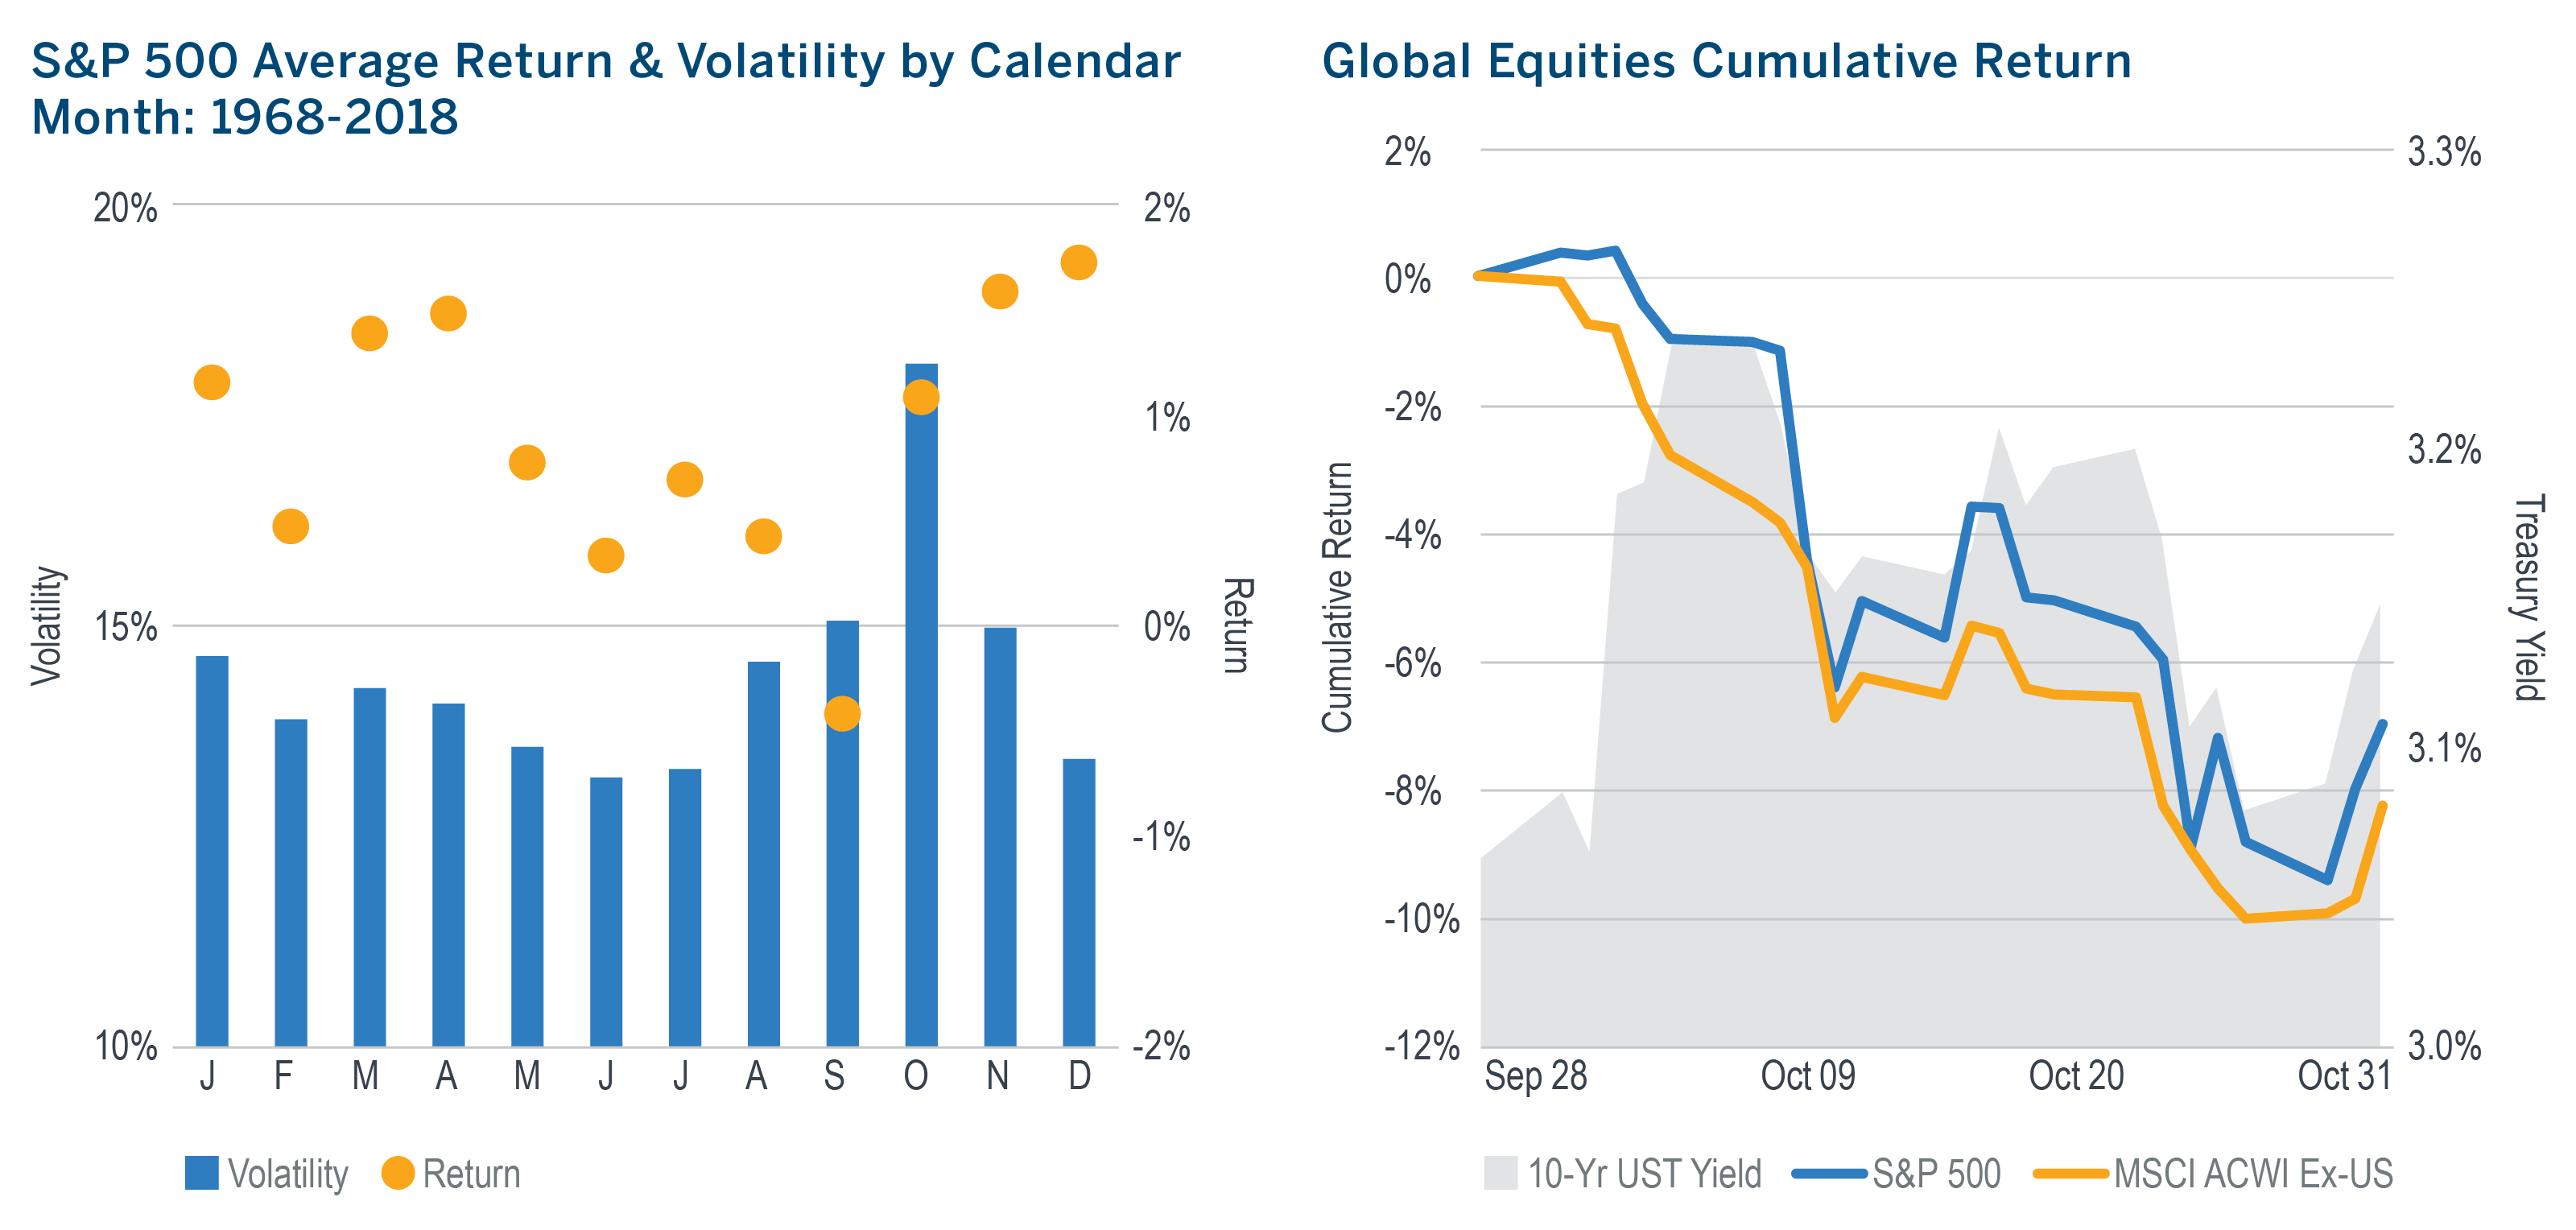
- With a -6.8% return in October, the S&P 500 locked in its first calendar-month loss since March and its largest since September 2011.
- The decline wiped out nearly 3/4 of the YTD return it had earned through the end of September.
- No other segment of the equity market offered any haven; mid- and small-cap stocks were down 9.5% and 10.5%, while developed and emerging market equities fell 8.1% and 8.6%, respectively.
- EM equities are down 22.7% from their 2018 peak in January and down 15.1% YTD, erasing more than half of their 37.7% return in 2017.
- Consumer staples and utilities were the only positive sectors in October, while industrials, energy and consumer discretionary endured the biggest losses.
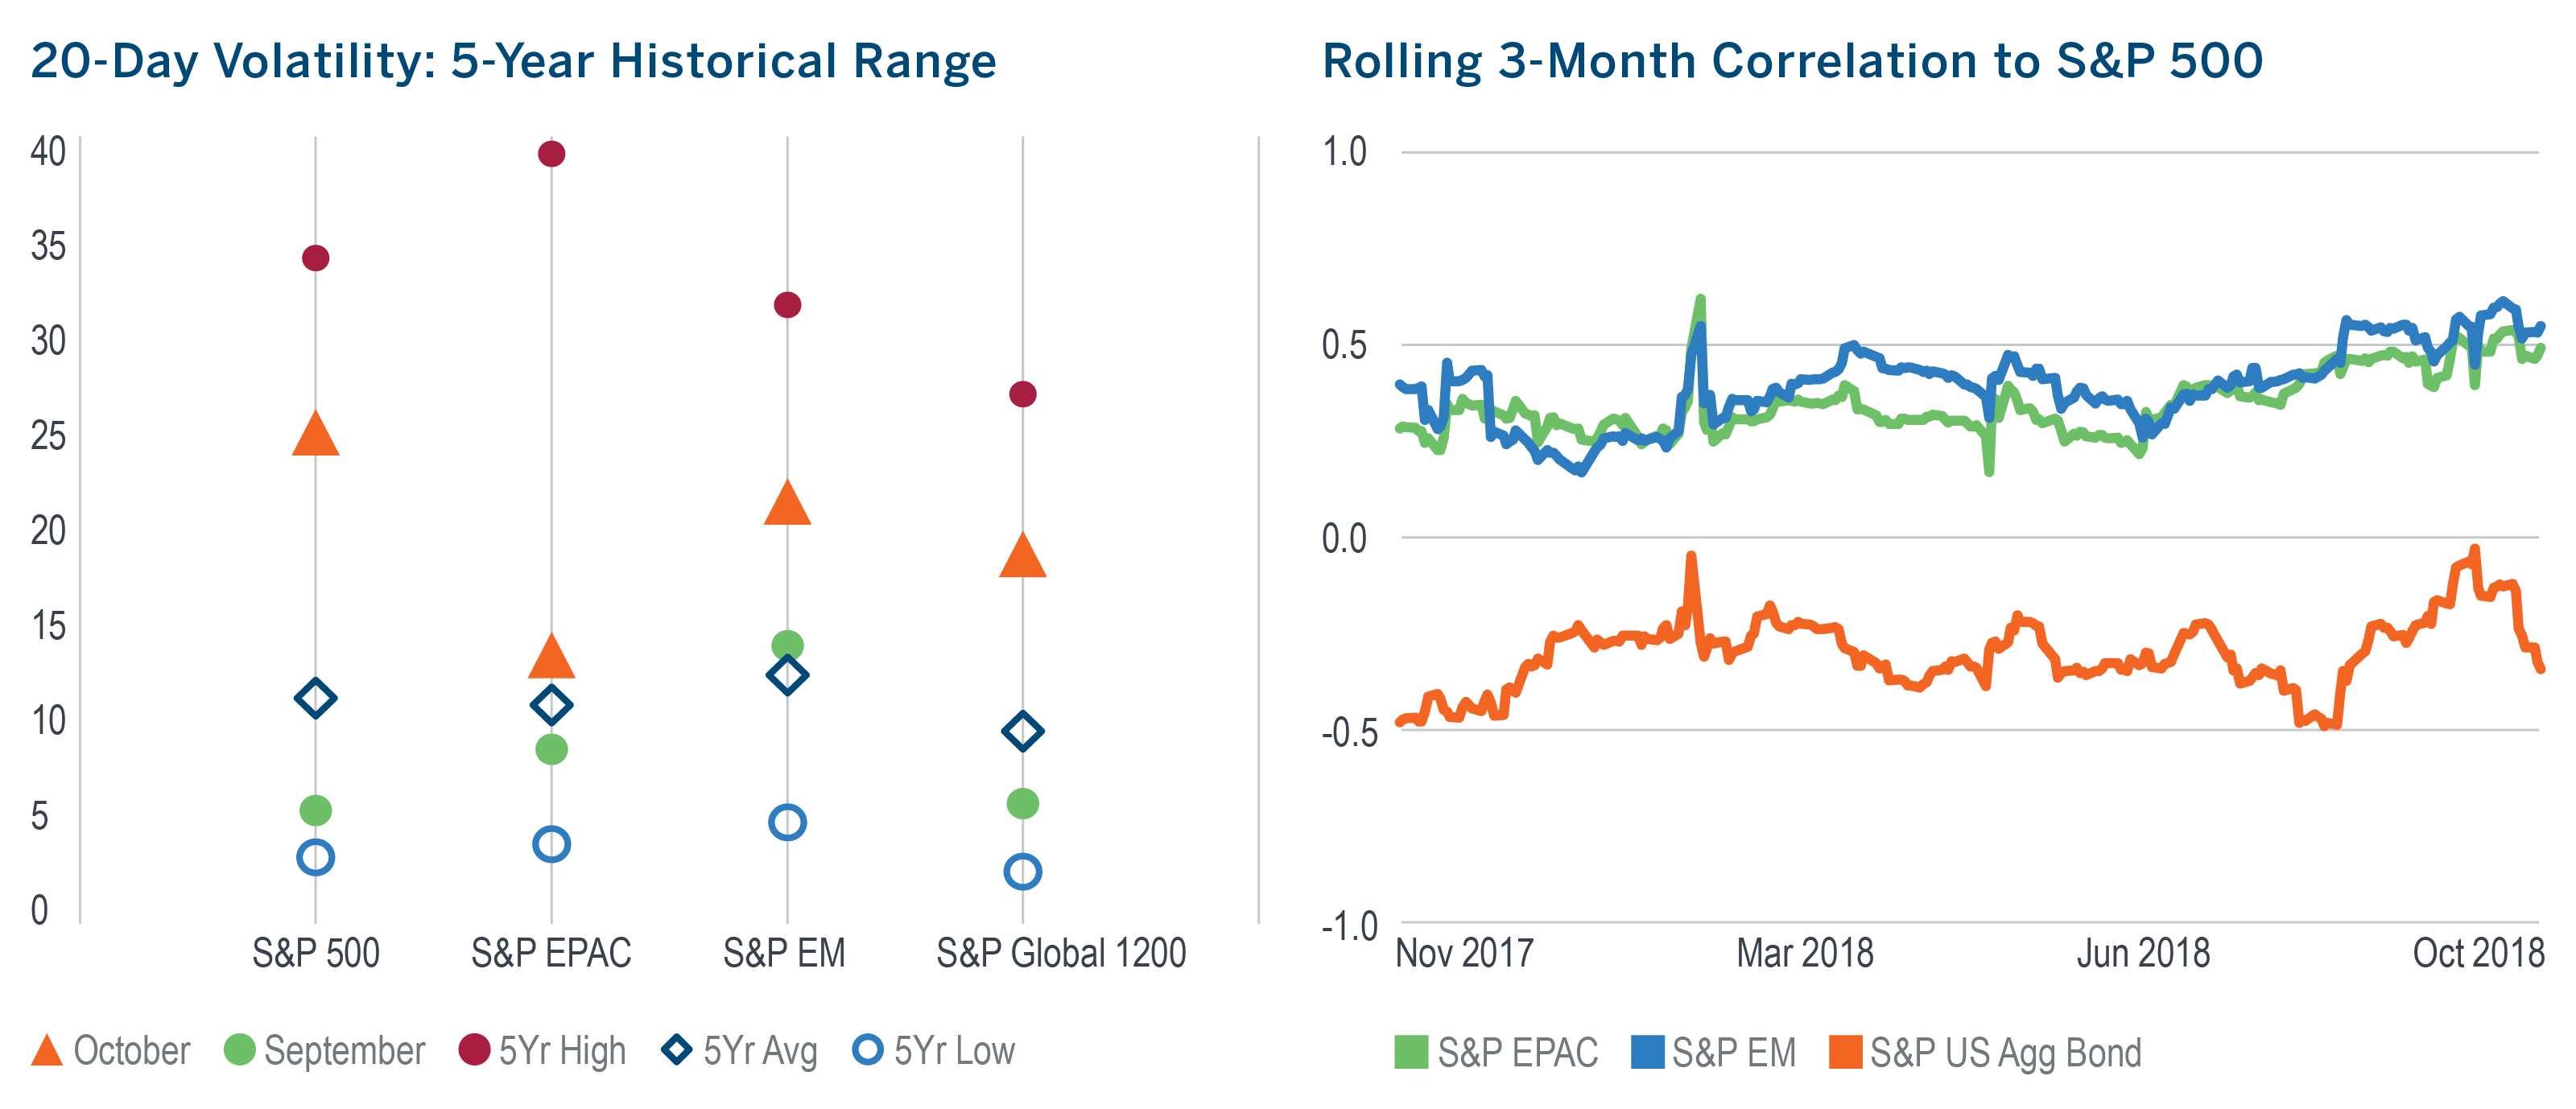
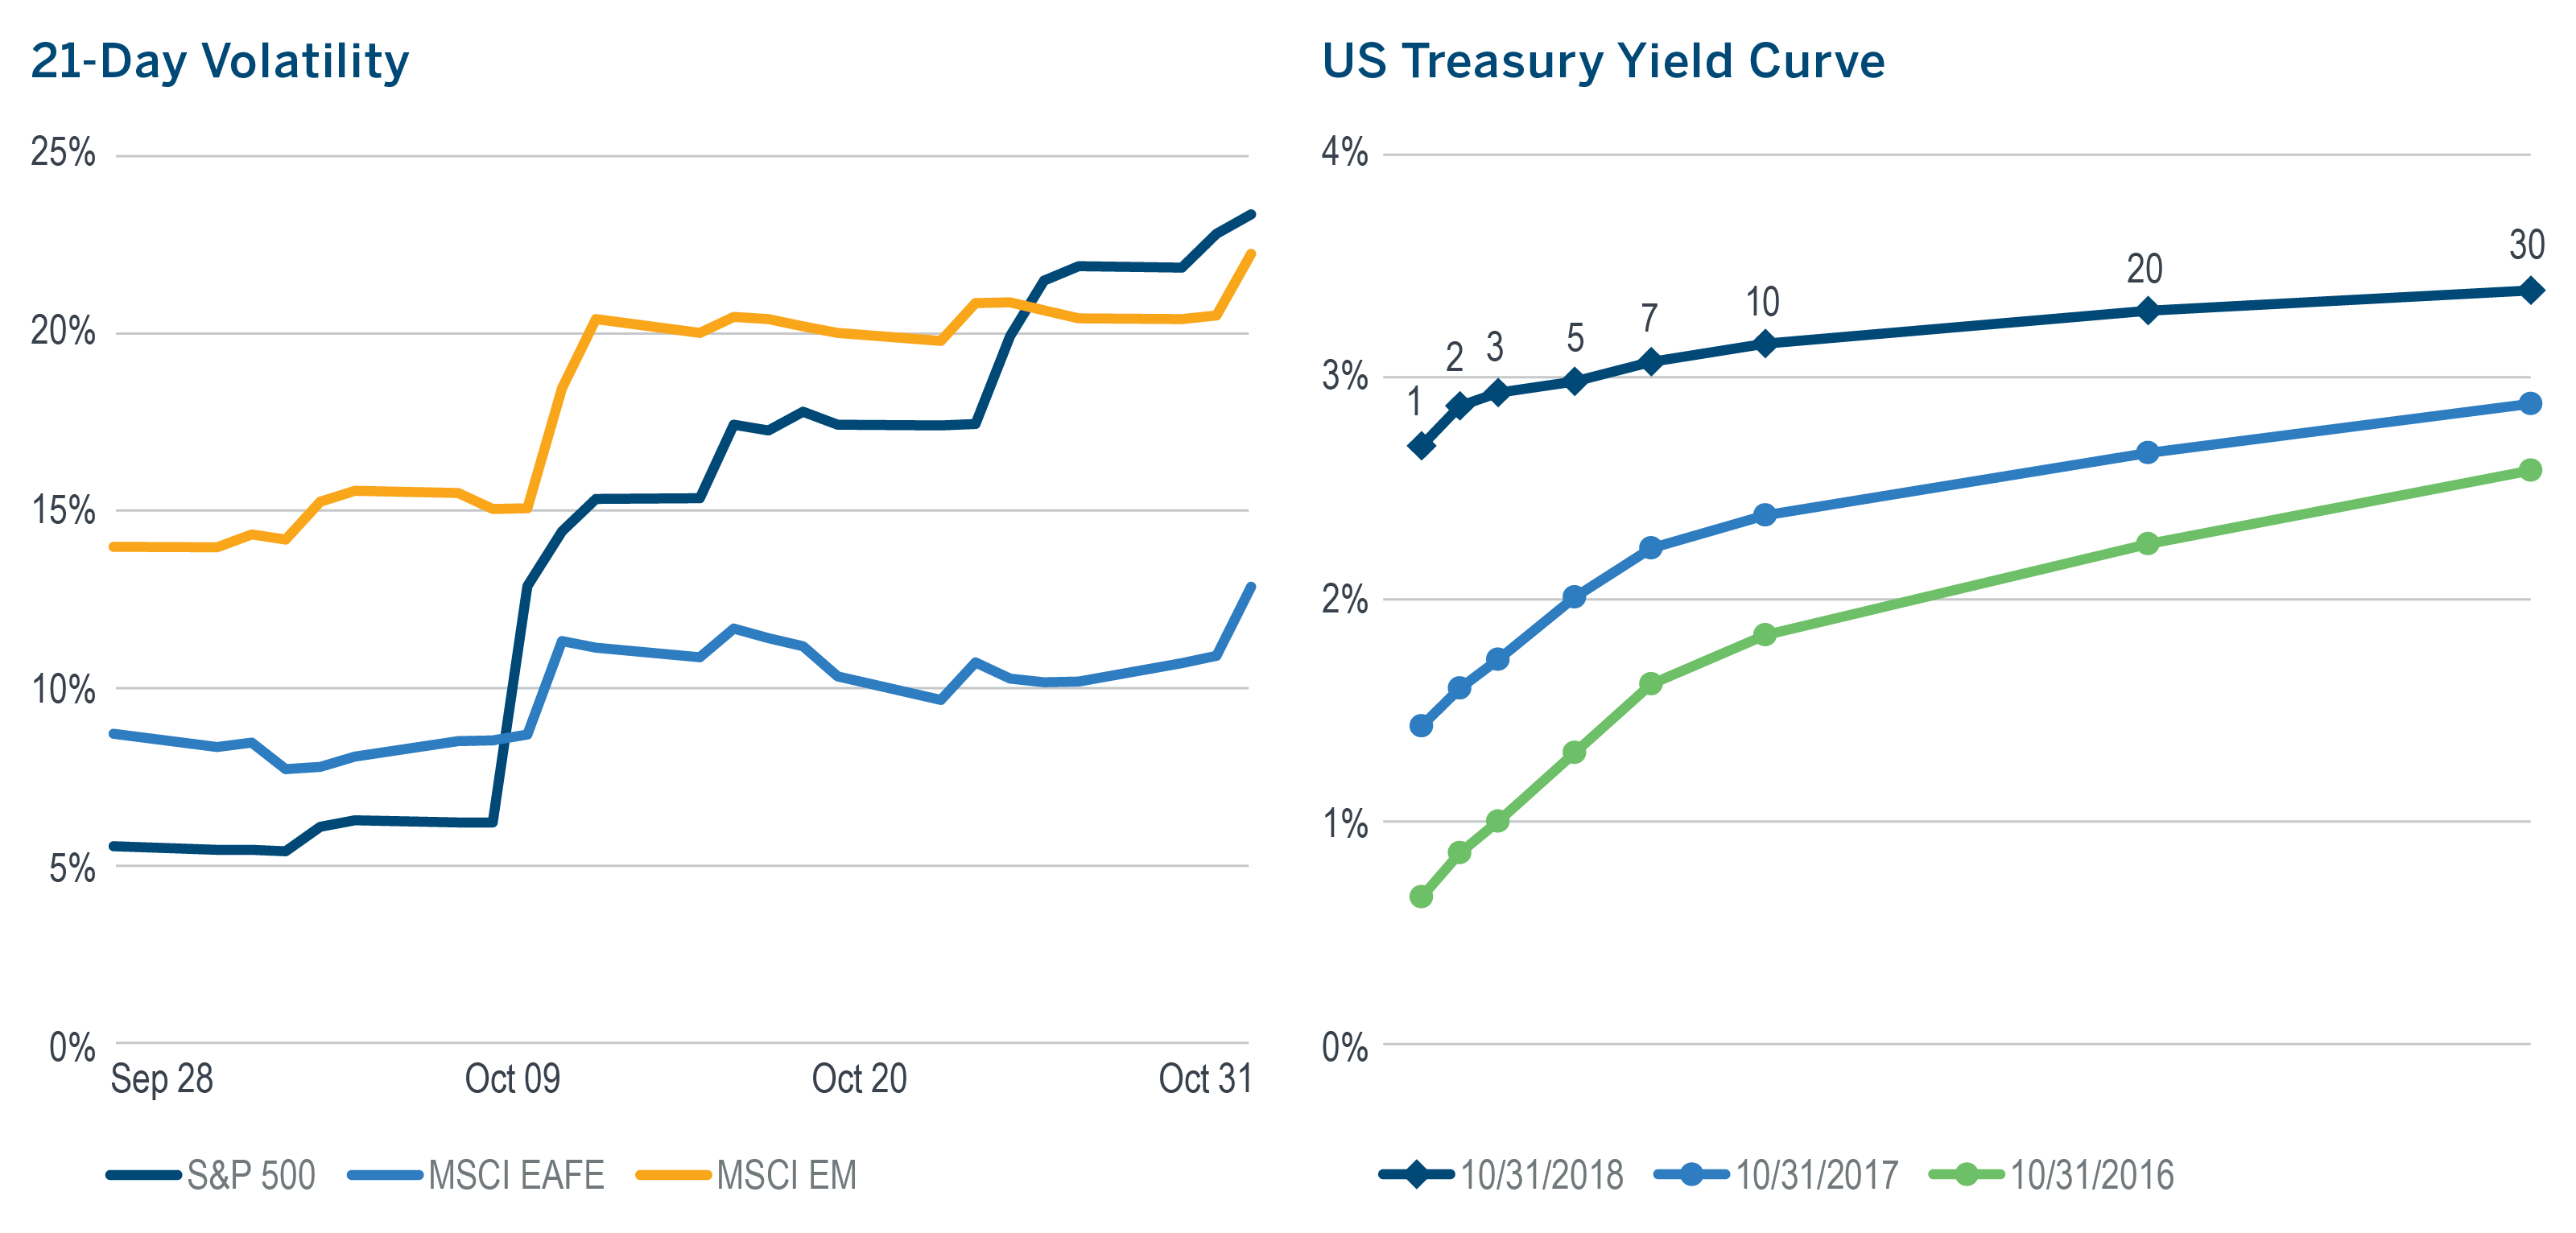
- The volatility of the S&P 500 in October was more than 4x what it was in September and more than 2x its five year average.
- As is often the case amidst market turmoil, the correlation of the S&P 500 with other segments of the equity market trended higher, while moving sharply lower against the US aggregate bond market, higher interest rates notwithstanding.
Managed Risk Investing
- The volatility of the S&P 500 climbed above the 18% volatility threshold of the S&P 500 Managed Risk Index. As a result, the index reduced its equity allocation from 100% at the beginning of the month to 66% by month end.
- By virtue of its hedging, the Managed Risk Index outperformed the S&P 500 by 32 basis points while reducing max drawdown by 111 bps.
- The return of the US aggregate bond market was also negative, but much less so than stocks, so a 70/30 blend* of the two outperformed the Managed Risk Index for the third time in the last 24 months.
- Over the last 10 years, the Managed Risk Index has exhibited marginally higher average monthly volatility than a 70/30 blend*, while generating an average excess monthly return of 11 bps, equal to an annualized excess return of 1.42% per year.
- The price of Brent crude oil continued to climb, reaching $85.44, its highest price in four years, before falling back to $76.
- Year-over-year CPI declined for the second straight month, falling from 2.9% in July to 2.3% in September. Meanwhile YoY PCE and 5-yr inflation expectations continued to hover around 2%.
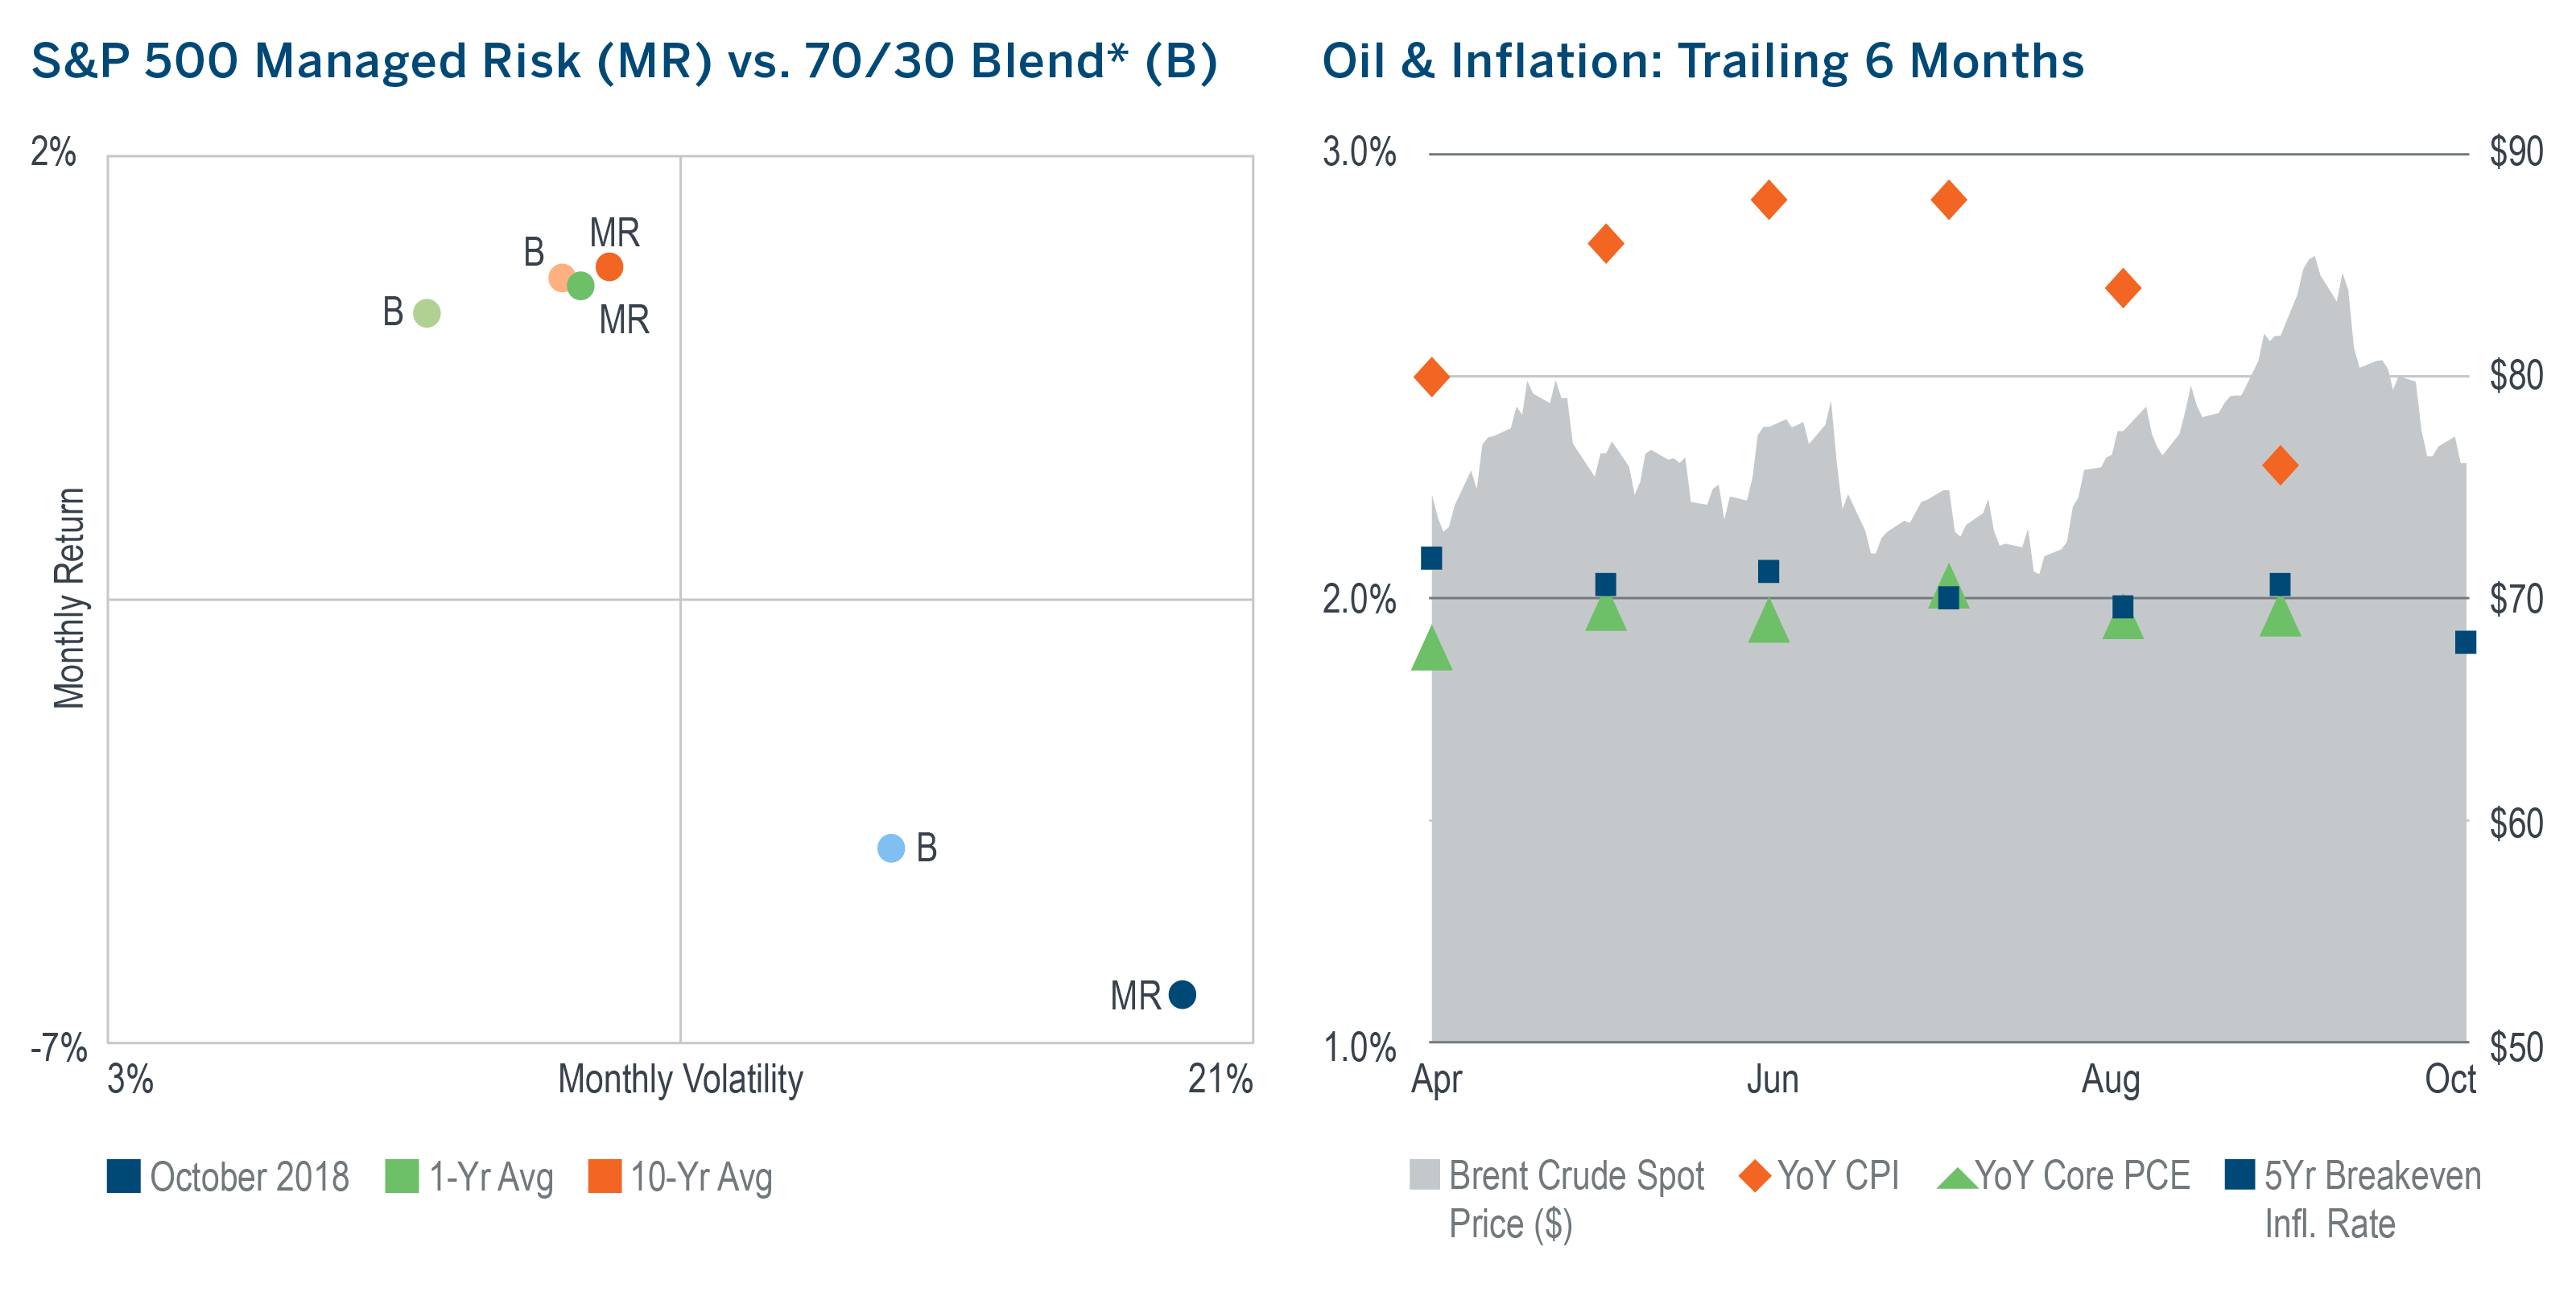
*As measured by the S&P 500 Index and the S&P US Aggregate Bond Index.
October Delivered On Its Reputation For Higher Equity Market Volatility
- Over the last 50 years, October has easily been the most volatile calendar month for the S&P 500, exhibiting average volatility of 18.3%.
- In 2018, October lived up to its reputation for higher volatility, although did not quite match the elevated choppiness exhibited during February earlier this year.
- Not only was there a high level of variability in the closing prices, but also in the intraday swings. During the four preceding months, the average intraday move of the index was just 0.63%. In October, it more than doubled, jumping to 1.69%.
- The selloff in equities and the accompanying rise in volatility appear to have been related, at least in part, to ongoing trade concerns as well as a sharp rise in interest rates.
- From the beginning of September through October 5, the yield on the 10-yr US Treasury rose from 2.86% to 3.24%, with a particularly sharp move in early October.
- The increase in volatility was not limited to the US, as stock markets in both developed and emerging countries became increasingly unsettled.
- Past is of course not prologue, but on average, investors who were in the market (i.e. S&P 500) heading into the last two months of the year were rewarded with the year’s two best monthly returns on both an absolute and risk-adjusted basis.
Download pdf here
Recipients must make their own independent decisions regarding any strategies or securities or financial instruments mentioned herein.
The products or services described or referenced herein may not be suitable or appropriate for the recipient. Many of the products and services described or referenced herein involve significant risks, and the recipient should not make any decision or enter into any transaction unless the recipient has fully understood all such risks and has independently determined that such decisions or transactions are appropriate for the recipient.
Past performance is not indicative of future results. Index performance information is for illustrative purposes only, does not represent the performance of any actual investment or portfolio, and should not be viewed as a recommendation to buy/sell. It is not possible to invest directly in an index. Any hypothetical, backtested data illustrated herein is for illustrative purposes only, and is not representative of any investment or product.
Any discussion of risks contained herein with respect to any product or service should not be considered a disclosure of all risks or a complete discussion of the risks involved.
The recipient should not construe any of the material contained herein as investment, hedging, trading, legal, regulatory, tax, accounting or other advice. The recipient should not act on any information in this document without consulting its investment, hedging, trading, legal, regulatory, tax, accounting and other advisors.
The materials in this document represent the opinion of the authors and are not representative of the views of Milliman, Inc. Milliman does not certify the information, nor does it guarantee the accuracy and completeness of such information. Use of such information is voluntary and should not be relied upon unless an independent review of its accuracy and completeness has been performed. Materials may not be reproduced without the express consent of Milliman.
MIL_COM_1 10/18_10/19 © 2018 Milliman Financial Risk Management LLC
Unless otherwise noted, data is sourced from Bloomberg.
Copyright ® 2011 – 2017 Milliman Financial Risk Management LLC.