Has recession already been averted?
As of July 19, 2019, less than two weeks before the Fed’s July meeting, a Fed rate cut is a virtual certainty.
The question now is not whether the Fed will cut, but rather how much. As of the 19th, the futures market showed a 63% probability of a 25-basis point cut and a 37% probability of a 50-basis point cut.
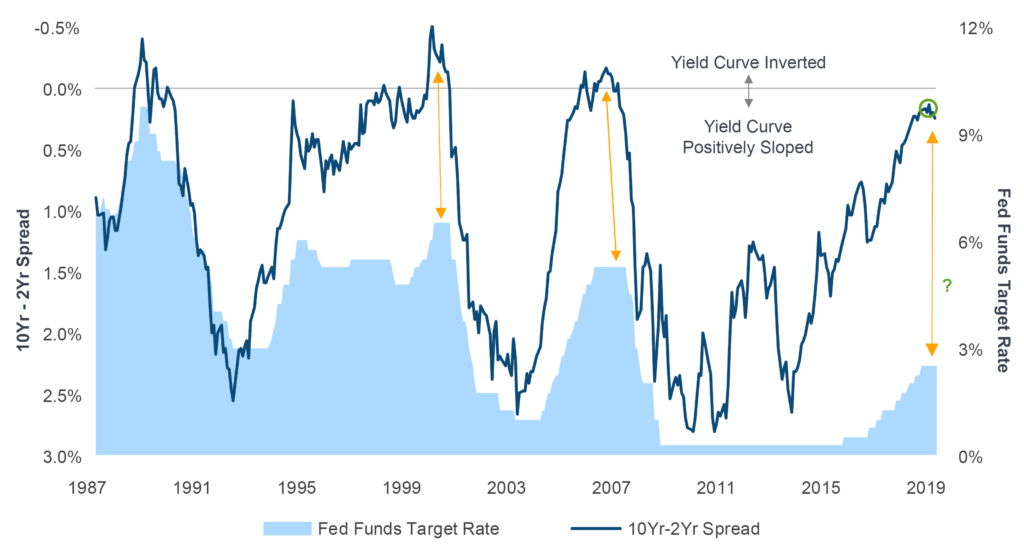
The beginning of the Fed’s last three rate-cutting cycles were all marked by inversion of the yield curve, i.e., the yield on the 10-yr Treasury falling below the yield on the 2-yr Treasury. In the chart, this is indicated by the dark blue line crossing above the gray line. Moreover, the last three curve inversions were also associated with the onset of recessions.
In late 2018, the slope of the yield curve reached its flattest point since 2007 (highlighted by the green circle), but avoided inversion, and has been steepening ever since on the back of dovish forward guidance from the Fed. Might this mean that recession has been averted?
The potential for recession is nothing to take lightly, but perhaps the most important difference between the beginning of previous rate cut cycles and today is the stance of Fed policy. In all three previous cases, the Fed Funds Target Rate was much higher and the Fed’s balance sheet was much smaller.
On the whole, policy was much tighter than it is now, leaving the Fed a lot more policy fire power to work with.
With that in mind, market participants will likely keep a watchful eye to see if and how the difference between today’s policy and that of previous years will affect its efficacy in averting a recession.
Unless otherwise noted, data is sourced from Bloomberg.
Recipients must make their own independent decisions regarding any strategies or securities or financial instruments mentioned herein.
The products or services described or referenced herein may not be suitable or appropriate for the recipient. Many of the products and services described or referenced herein involve significant risks, and the recipient should not make any decision or enter into any transaction unless the recipient has fully understood all such risks and has independently determined that such decisions or transactions are appropriate for the recipient.
The results shown are historical, for informational purposes only, and do not guarantee future results.
Any discussion of risks contained herein with respect to any product or service should not be considered a disclosure of all risks or a complete discussion of the risks involved.
The recipient should not construe any of the material contained herein as investment, hedging, trading, legal, regulatory, tax, accounting or other advice. The recipient should not act on any information in this document without consulting its investment, hedging, trading, legal, regulatory, tax, accounting and other advisors.
The materials in this document represent the opinion of the authors and are not representative of the views of Milliman, Inc. Milliman does not certify the information, nor does it guarantee the accuracy and completeness of such information. Use of such information is voluntary and should not be relied upon unless an independent review of its accuracy and completeness has been performed. Materials may not be reproduced without the express consent of Milliman.
Data included in this document has been sourced from providers that Milliman FRM believes to be reliable from information available publicly or with consent of the provider of the source material. To the fullest extent permitted by law, no representation or warranty, express or implied is made by Milliman FRM as to the accuracy or completeness of the source data or any other information in this document.


