Monthly municipal bond issuance in November approached $45 billion, marking the second-largest figure this year.
November marked the 12th straight month of net inflows into municipal mutual funds, with inflows accelerating to a record weekly pace of $2.36 billion at month-end.
The Bloomberg Barclays Municipal Bond and High Yield Municipal Bond indices returned 0.25% and 0.39% in November, respectively, marking the 10th month of positive returns this calendar year for both indices.
Month in review
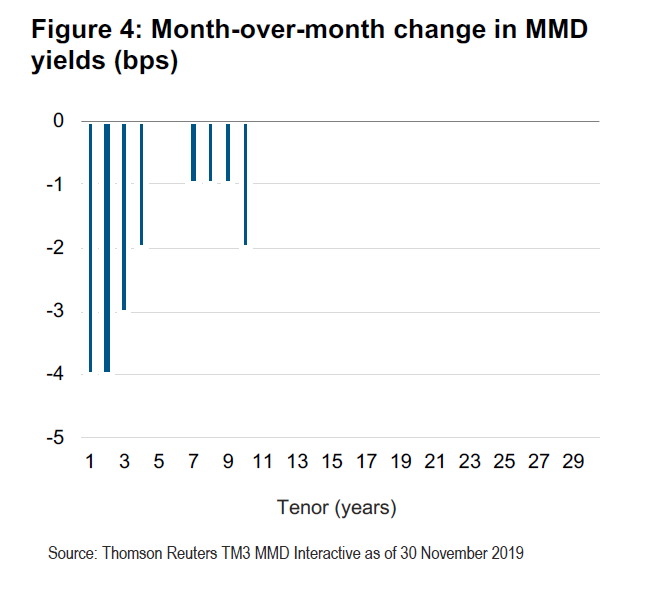
Monthly municipal bond issuance in November approached $45 billion, marking the second-largest figure this year. This pushed 2019 year-to-date issuance to nearly $378 billion, surpassing 2018’s total issuance figure of $339 billion by $39 billion.1 The short end of the AAA municipal yield curve declined slightly over the month, with yields on bonds 10 years and under falling by up to four basis points (bps), while yields beyond 10 years remained unchanged.2
Following October’s rate cut, Federal Reserve Chair Jerome Powell reaffirmed the Fed’s previously communicated intention to leave rates unchanged in the near term. “If the outlook changes materially, policy will change as well,” Powell stated on November 25, following his remarks that “monetary policy is now well positioned to support a strong labor market and return inflation decisively to [the Fed’s 2% target].”3
The Bloomberg Barclays Municipal Bond and High Yield Municipal Bond indices returned 0.25% and 0.39% in November, respectively, marking the 10th month of positive returns this calendar year for both indices (each only experienced negative returns in September).4
Muni/Treasury ratios dipped at multiple tenors in November. The two-year ratio declined to 66% from 73%, while the 10-year ratio declined to 83% from 88%.5
November’s primary market issuance of $44.7 billion – including $11.3 billion in taxable municipal issuance – accounted for an 18.5% decrease from October 2019, but a 60.4% increase compared to November 2018.6, 7
Secondary market monthly trade volume sank in November, with par traded totaling $214 billion and quantity of trades totaling just 608,000. Both represented the lowest such figures in 2019.8
Muni technicals in focus: strong but abnormal supply
The Bloomberg Barclays Municipal Bond Index delivered a gain of 0.25% in November, as rates held virtually steady across the municipal yield curve (see Figure 4).9 November marked the 12th straight month of net inflows into municipal mutual funds, with inflows accelerating to a record weekly pace of $2.36 billion at month-end.10
The recent spike in municipal primary market supply was sustained in November, with $44.7 billion in new issuance following October’s near-record level of $54.8 billion.11 However, we expect the positive net supply over the past three months (see Figure 2) to turn negative as we move into early 2020. Interestingly, a few nontraditional structures continue to power the fourth-quarter boom in new issuance. First, elevated levels of taxable issuance persist, incentivized by low absolute rates and the inability of municipalities to advance refund on a tax-exempt basis. Year-to-date taxable issuance of $58.3 billion already dwarfs the 2018 year-end figure of $25.0 billion.12 Analysts expect taxable issuance could approach $100 billion in 2020 if rates remain anchored.13 Second, municipalities continue to address the ban on tax-exempt advance refundings by leveraging “forward deliveries,” in which fixed rates are locked in immediately but newly issued bonds are delivered to investors months, or even potentially upward of a year, later.14
We do not anticipate an immediate credit impact from the outcome of the November 2019 elections, given few major shifts in partisan control and a relatively light ballot cycle for referenda. In Kentucky and Virginia, Democrats took control of the gubernatorial seat and both chambers of the legislature, respectively.15 While this may lead to a shift in fiscal policy in these states, we don’t expect these results to affect overall credit quality at this time. In terms of ballot initiatives, anti-tax sentiment at the state level was underscored, continuing to hamper some states’ fiscal flexibility. In Colorado, voters struck down Proposition CC, which would have removed budget constraints from the Taxpayer Bill of Rights (TABOR) and enabled the state greater flexibility in growing its rainy day reserves.16 In Texas, voters placed additional constraints on enacting an income tax, obstructing the potential for new state revenue sources, by approving Proposition 4.17 We will closely monitor any potential material changes in credit profiles as a result of recent election or ballot outcomes.
1 The Bond Buyer: Primary Market Statistics – A Decade of Bond Finance, 29 November 2019 2 Thomson Reuters TM3 MMD Interactive Data, 29 November 2019 3 Nick Timiraos, “Powell Says Fed’s Rate Cuts Reflect More Bearish View of Economy,” The Wall Street Journal, 26 November 2019 4 Bloomberg Barclays, 29 November 2019 5 Thomson Reuters TM3 MMD Interactive Data, 29 November 2019 6 The Bond Buyer: Primary Market Statistics – A Decade of Bond Finance, 29 November 2019 7 The Bond Buyer: Long-Term Bond Sales, 29 November 2019 8 The Bond Buyer: Secondary Market Statistics, 29 November 2019 9 Bloomberg Barclays, 29 November 2019 10 Bloomberg Brief: Muni, Bloomberg, 2 December 2019 11 The Bond Buyer, A Decade of Municipal Bond Finance, 3 December 2019 12 Bloomberg, 3 December 2019 13 Peter De Groot et al., “JPMorgan 2020 Municipal Market Outlook: White Knuckle Finish,” 26 November 2019; Mikhail Foux et al., “Barclays Muni 2020 Supply Outlook,” 20 November 2019 14 Danielle Moran and Fola Akinnibi, “The Bond Is in the Mail: Muni Market’s New Way Around Trump Ban,” Bloomberg, 26 November 2019 15 Jonathan Martin, “Democrats Win Control in Virginia and Claim Narrow Victory in Kentucky Governor’s Race,” The New York Times, 7 November 2019 16 Comprehensive Annual Financial Report (CAFR), Colorado Office of the State Controller, 16 July 2019 17 2019 November 5th Constitutional Amend. Election Results, Texas Secretary of State, 6 November 2019
DISCLOSURES
A word aboutrisk: Investing in the bond market is subject to risks, including market, interest rate, issuer, credit, inflation risk, and liquidity risk. The value of most bonds and bond strategies are impacted by changes in interest rates. Bonds and bond strategies with longer durations tend to be more sensitive and volatile than those with shorter durations; bond prices generally fall as interest rates rise, and low interest rate environments increase this risk. Reductions in bond counterparty capacity may contribute to decreased market liquidity and increased price volatility. Bond investments may be worth more or less than the original cost when redeemed. Income from municipal bonds is exempt from federal income tax and may be subject to state and local taxes and at times the alternative minimum tax; a strategy concentrating in a single or limited number of states is subject to greater risk of adverse economic conditions and regulatory changes.
Statements concerning financial market trends or portfolio strategies are based on current market conditions, which will fluctuate. There is no guarantee that these investment strategies will work under all market conditions or are suitable for all investors and each investor should evaluate their ability to invest for the long term, especially during periods of downturn in the market. Outlook and strategies are subject to change without notice.
Forecasts, estimates and certain information contained herein are based upon proprietary research and should not be interpreted as investment advice, as an offer or solicitation, nor as the purchase or sale of any financial instrument. Forecasts and estimates have certain inherent limitations, and unlike an actual performance record, do not reflect actual trading, liquidity constraints, fees, and/or other costs. In addition, references to future results should not be construed as an estimate or promise of results that a client portfolio may achieve.
PIMCO does not provide legal or tax advice. Please consult your tax and/or legal counsel for specific tax or legal questions and concerns. The discussion herein is general in nature and is provided for informational purposes only. There is no guarantee as to its accuracy or completeness. Any tax statements contained herein are not intended or written to be used, and cannot be relied upon or used for the purpose of avoiding penalties imposed by the Internal Revenue Service or state and local tax authorities. Individuals should consult their own legal and tax counsel as to matters discussed herein and before entering into any estate planning, trust, investment, retirement, or insurance arrangement.