Following another year of strong returns, Emerging Markets (EM) fixed income has outperformed developed bond markets by a significant margin over the past four years.
The outperformance is likely to continue in 2020, because EM fixed income remains attractively priced both in absolute terms and relative to bonds in developed markets as well as under-owned and well-supported by an improving fundamental backdrop.
Contents
• Section 1 – briefly reviews performance in 2019, which can be characterised as a tale of two halves with a happy ending.
• Section 2 – presents 1-year and 5-year return scenarios for sovereign government bonds, local currency government bonds as well as corporate bonds along with discussion of the main drivers and risks in each market.
• Sections 3 and 4 – discuss two important themes, which are likely to exert a growing influence in global capital markets in the coming years, namely income inequality and slower growth, which can be attributed to gross misallocation of global capital.
Section 1
Review of the main developments in 2019
2019 was a tale of two halves with a happy ending. Early 2019 saw strong performance across all the major EM fixed income segments after the pullback in 2018. Performance in the first half was also aided by the brief US yield curve inversion and the start of the Fed cutting cycle. Sentiment turned sour after June as US protectionism resurfaced along with rising risk of a disorderly Brexit in the UK and powerful inventory adjustments in the semiconductor, shale oil and auto sectors. European growth also weakened and the ECB ran out of policy instruments after cutting the policy rate to -50bps and announcing open-ended Quantitative Easing (QE).
In addition to these mainly non-EM negatives, sentiment towards EM worsened sharply in response to a handful of idiosyncratic political crises in countries like Ecuador, Bolivia, Chile, Argentina and Lebanon. The price action was made more violent by the fact that these problems coincided with low market liquidity during the summer lull and profit-taking after the strong performance in the first half of the year. US economic data also began to improve in H2 2019 and the Dollar surged higher, which did not help EM either.
EM bonds recovered strongly from a mid-year dip to deliver solid full-year performance
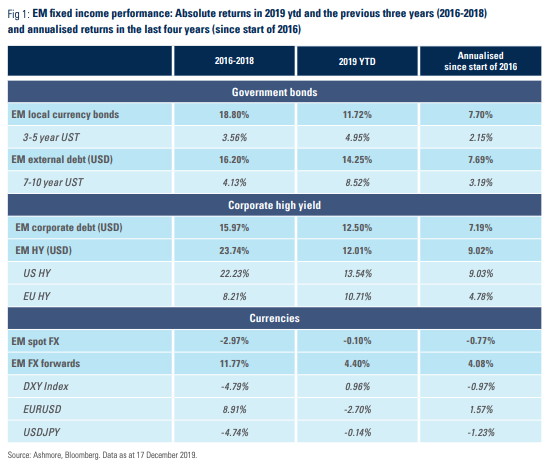
By December, however, EM markets were back. Better mood music around trade, a dovish Fed and a clearer outlook for the UK after a decisive General Election result worked hand in hand with improving data in a number of EM countries, including China. There was also a gradual normalisation of politics in the countries that had experienced trouble in Q3 2019. As the dust settled, EM could look back upon a volatile but strong year in terms of performance: local currency bonds were up 11.7% in USD terms, while external debt had delivered 14.3% return and corporate bonds were up 12.5% for the year (Figure 1).1 Remarkably, local currency bonds have now outperformed both EM sovereign and corporate Dollar-denominated bonds since 2016.2
It may surprise many that EM local currency bonds have performed in line with Dollar-denominated bonds over the last four years
Section 2
Return scenarios for EM fixed income in 2020 and 2020-2024
a) Sovereign Dollar-denominated debt
The USD 1.3trn EM sovereign debt asset class (‘external debt’) consists of mainly Dollar-denominated government and quasi-sovereign bonds with an average credit rating of investment grade and a spread over US Treasuries (UST) of 305bps.3 For comparison, the asset class traded at a spread of 180bps prior to 2008/2009, when the average credit rating of the asset class was below investment grade. The main benchmark index, the EMBI GD, which covers 69% of the outstanding bonds, currently includes bonds from 73 countries compared to less than half of that (32) before 2008/2009. In other words, external debt is more than twice as diverse, has a higher credit quality and trade significantly wider than ten years ago.
In 2020, broad external debt should return about 4.8% in Dollar terms, while investment grade external debt (IG) should pay investors about 3.5% (Figure 2).4 These estimates assume that UST yields converge to where they are currently priced in forward markets, but should be viewed as conservative in the sense that they assume zero spread compression in 2020. Figure 2 also shows ‘bull’ and ‘bear’ scenarios around the base case. The main source of upside risk is strong inflows to the asset class, which seems likely given the solid performance in recent years. Inflows would push spreads tighter.
The ‘bull market’ scenario assumes 10% spread compression, which pushes 1-year returns to 7.0% for broad external debt and 5.0% for IG, respectively. Note that abundant inflows can be a double-edged sword; abundance of finance may entice some EM governments to borrow too much, especially if they are inclined towards populism.
External debt should return at least 4.8% in 2020 from coupons
The ‘bear market’ scenario assumes strong acceleration of US economic growth and a resulting sharp (100bps) repricing of UST yields.5 This pushes the 1-year return on broad external debt down to just 1.3%. IG external debt would lose 0.6% in this scenario on account of greater sensitivity to underlying shifts in the UST curve due to narrow spread cushions. On balance, we believe the ‘bull market’ scenario is the more likely outcome, because EM’s technical position is benign and the fundamental outlook for the US economy is gently weakening.
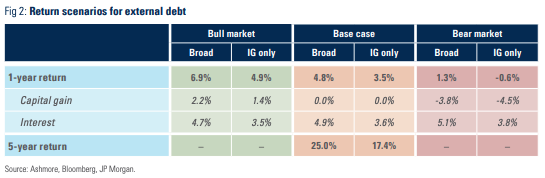
Over a 5-year investment horizon, the compounded return should be around 25.0%, while IG should return about 17.4%. The 5-year return estimates are predicated on the view that EM bond yields converge to the UST 5-year forward yield plus the average EM spread of the past ten years (331bps for broad external debt and 202bps for IG). The assumption of mean reversion for spreads implies that EM sovereign credit quality never improves over time. Again, this is probably too conservative. First, the external debt asset class broadens and deepens every year, thus improving liquidity and diversification and therefore reducing its riskiness (see Appendix for an overview of the EM fixed income asset class). Second, EM economies are generally converging rapidly with developed economies in per capita income terms, which improves the underlying credit fundamentals, all else even.6 Note that the 5-year return scenario for broad external debt assumes that 50bps is lost every year due to defaults, while for IG external debt the default rate is assumed to be zero.
The main downside risk to external debt is strong US growth with higher Treasury yields, but upside risks are greater due to benign technicals and a dovish Fed
b) EM local currency bonds
EM governments obtain nearly 90% of their financing from their local markets, the USD 10.5trn EM local currency government bond universe. Local bonds trade on inflation, monetary policy and other domestic macroeconomic fundamentals as well as the outlook for currencies. One notable development in the year ahead is that China enters the main benchmark index, JP Morgan’s GBI EM GD. China’s index weight will reach the cap of 10% by the end of 2020. China is the first ‘safe haven’ country in the GBI EM GD, so its inclusion could reduce Dollar-EM FX volatility, while possibly increasing RMB-EM FX volatility.
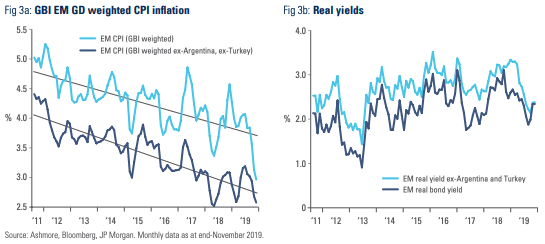
Going into 2020, EM local government bonds are trading with a yield of 5.2%.7 Nominal bond yields are 200bps lower than their peak, but EM inflation has fallen sharply (Figure 3a). Over the past decade, the decline in EM inflation has broadly matched the decline in nominal yields, so that real yields are more or less where they were ten years ago (Figure 3b).
Local currency bonds offer the greatest total return potential due to currency upside
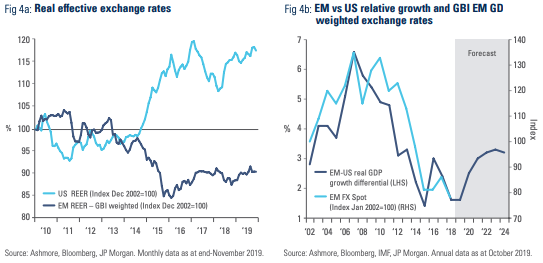
In sharp contrast to real yields, EM currencies are 45% lower in nominal terms than ten years ago, which translates into 20% cheapness versus the Dollar in real effective exchange rate terms (Figure 4a). EM currencies are also closely correlated with EM growth relative to US growth, which implies about 20% upside over the next few years, based on the latest growth forecasts of the International Monetary Fund (IMF) (Figure 4b).
EM currencies are 20% cheap based on real effective exchange rate and relative growth prospects
The combination of high real yield and very cheap FX suggests more upside for local bonds than for other EM fixed income markets in the coming years. Indeed, in 2020 local currency government bonds should return 9.2% in USD terms based on the assumption that bond yields are stable (i.e. no capital gain) and 4% currency appreciation (Figure 5). The ‘bull’ and ‘bear’ market scenarios around this base case mainly revolve around flows and inflation, since, in local markets, UST volatility generally has a relatively muted impact.8 A ‘bull market’ in EM local markets would come about if inflows picks up meaningfully. If so, local bond yield could be pushed down by 100bps and FX returns could double to 8% for a total return of 18.1% in USD terms. On the other hand, stronger relative US growth would push up the Dollar and US yields by 100bps in which case total return would be -7.7% (a ‘bear’ case not dissimilar to 2018).
Inflation risks are generally modest going into 2020 due to the very benign starting point. Index weighted EM CPI inflation set a multi-year low of 2.9% in November 2019 (2.6% excluding Turkey and Argentina). Many countries in EM are likely to end their cutting cycles in 2020, but few are likely to hike outright, in our view.
Inflation risks in EM should be moderate in 2020, but are likely to gradually increase over the medium term
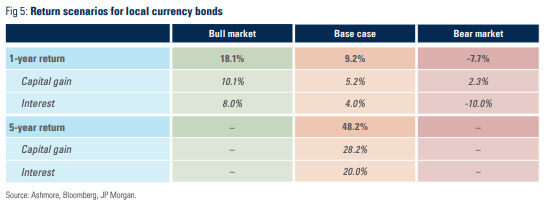
Over a 5-year investment horizon, local currency bonds should return about 48.2% in USD terms. This assumes that a steady inflow of capital to local markets lifts EM FX back to fair value (+20% versus the Dollar). In addition to lifting currencies, inflows also lift growth rates because an abundance of capital eases the finance constraints that impede growth in many EM economies. As a result, inflation should generally rise over the 5-year investment horizon. This means that bond yields, too, must rise, which has been factored into the forecast, which assumes that bond yields rise by 1.2% over five years towards their 10-year average of 6.4%.9 In practice, inflation risks will vary greatly across countries in the next half a decade. As a general rule, EM countries with credible central banks, higher productivity and vibrant private sectors will be better placed to absorb inflows without overheating, but distinguishing between ‘good’ and ‘bad’ EM countries will clearly become more important in the coming years.
c) EM corporate bonds
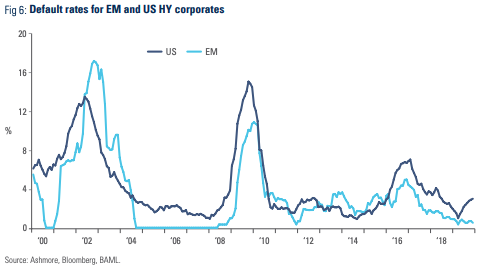
As Figure 6 shows, default rates for EM HY bonds hit a cycle low of just 0.51% in November 2019 and net leverage remains about 20% lower than US HY corporates. EM corporates should remain resilient to global risks, having faced down numerous external headwinds in the past decade, including a 50% Dollar rally, the Taper Tantrum, the full Fed hiking cycle, a halving of commodity prices, trade wars, the slowdown in China, Brexit and a bunch of country-specific shocks within individual EM countries. Inflows to EM in the coming years should reduce refinancing risks and increase domestic demand and hence improve corporate profitability. The last time EM saw large sustained inflows in the mid-2000s EM HY default rates collapsed to zero for several years in a row.
Corporate bonds in EM are supported by very low default rates and lower leverage than corporate bonds in developed economies
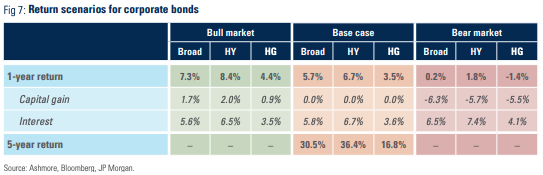
Given yields, investors should expect to make about 6.7% in EM corporate high yield (HY) in 2020 and about 3.5% in high-grade (HG). This assumes that UST yields behave in line with forward markets. The ‘bull market’ scenario for corporates would be a 10% spread compression, while the ‘bear market’ case would be a 100bps increase in UST yields plus a 25% widening in spreads (Figure 7). Another possible source of spread widening for EM HY in 2020 is rising defaults in the US HY market, where the default rate recently shot up to 3.00%. If EM HY experiences spread widening due to a sell-off in US HY, while EM credit fundamentals remain healthy investors should view this as a buying opportunity, in our view.
Over a 5-year investment horizon, returns are likely to be 36.4% and 16.8% for HY and HG, respectively (Figure 6). These 5-year return projections assumes that UST yields converge to forwards and that the spreads on corporate bonds revert to their 10-year average (238bps for HG and 567bps for HY).10 The 5-year return projection assume zero defaults for HG and a gradual return to the long-term average default rate of 3.5% for HY. The returns for ‘broad’ corporate debt in Figure 7 are simply weighted averages of HG (30%) and HY (70%) returns, where the weights reflects the broad composition of the main benchmark index, CEMBI BD.
Section 3
Emerging themes: income inequality
Income inequality in developed countries and in wealthier EM countries is likely to emerge as a driver of politics, economic policy, growth and ultimately financial markets performance in the coming years. This section discusses the origins of the rise in income inequality and, without exhausting the subject, draws attention to some of the likely consequences.
Origins of the inequality problem
In 2010, the former Chief Economist at the IMF, Raghuram Rajan, traced the origin of the 2008/2009 US financial crisis to unequal access to education. Surprising at first, his argument makes a great deal of sense upon further reflection. Lower-income segments of the US population, he argued, do not have the same opportunities as higher income segments. This meant that when the secular decline in interest rates began in the 1980s and lower rates cheapened the cost of capital for technological innovations in production processes, businesses faced strong incentives to replace humans with machines on the factory floor. Workers consequently found it hard to maintain real wages. Declining interest rates also drove home prices higher, which resulted in a higher cost of living, including higher rental costs. Finally, the end of the Cold War in 1989 and the transformation of China into a market economy significantly increased the volume of labour competing directly with workers in developed economies.
Income inequality in developed economies is likely to emerge as a major driver of politics, economics and financial market performance in the coming years
Economists will argue that the trend towards greater income inequality can be reversed in two ways. First, access to education can be broadened to meet the demand for high skilled labour as manual assembly line jobs disappear or move overseas. Second, governments can create transfer mechanisms, which allow the winners of globalisation to compensate the losers in such a way that trade is still net positive for the world, or Pareto efficient, as economists call it.
In reality, however, such remedies were never undertaken. It is costly to fix education systems and the results are only visible long after the term of most political mandates. Meanwhile, transfer mechanisms are unpopular with many politicians to the extent that they are sensitive to lobbying from the relevant vested interests. Cross-border transfers to ensure a fair distribution of the benefits of free trade are orders of magnitude more difficult to implement.
Given these constraints, politicians found other ways to help losers. In the US, Democrat and Republican administrations alike realised that by incentivising Fannie Mae and Freddie Mac to lend to people with lower income and easing credit rules more generally they could help millions of low income people to achieve their dreams of owning a house, cars and other consumer items. Excessive borrowing within the low-income segments of the US population was thus the main reason for the Savings & Loans Crisis in 1989 and the Subprime & Banking Crises of 2008/2009. The latter was particularly damaging, because by then regulators had also permitted ‘financial innovations’, such as bundling of different tiers of credit risk to create financial instruments that gave the impression of being diversified and therefore appear less risky. Layers upon layers of leverage were added. Result: the greatest financial crisis since 1929. And at the root of it all was income inequality.
The rise in inequality can be traced back to policies pursued by governments over several decades
Tax policies have also exacerbated the inequality problem. Since the 1980s, lobbyists have successfully convinced members of the US Congress to cut corporation income tax (CIT) on the argument that this would boost the overall wealth of society. This argument also won over policy-makers in other countries. Thus, the rate of CIT declined by 5% between 2012 and 2018 in the UK, by almost 10% in Japan and France, and by close to 15% in the US, according to a 2019 paper published by the IMF.11 Following the lead of developed economies, many lower income countries also cut CIT. The average CIT rate in low income countries fell from 45% in the early 1990s to below 30% by 2018.
The race to the bottom in CIT was given added impetus by opportunities to ‘arbitrage’ taxes lower by shopping around among small economies offering registration with low or no tax obligations. This enabled the wealthiest part of the population, whose income derives mainly from corporate income, to pay even less tax. Outrage over such practices is not uncommon. In the UK, for example, the population is frequently up in arms, when the press points out that corporate behemoths, such as Starbucks, Apple and Amazon, who profit greatly for their operations in the UK, pay virtually no corporate income taxes.
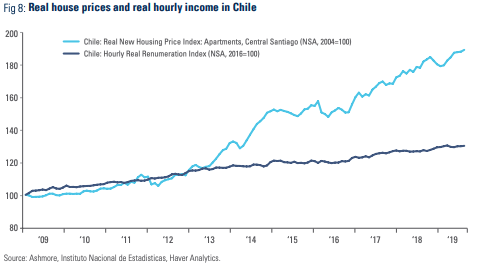
In the aftermath of 2008/2009, monetary policy further contributed to the rise in income inequality. Central banks cut policy rates to zero or below and are engaged in enormous programmes of asset purchases via QE. These policies helped to restore confidence by boosting asset prices, but they had a much more muted effect on the real economy. They greatly benefitted the wealthy, which are the largest owners of financial assets. According to the Congressional Budget Office, almost all the growth in pre-tax household income from 2009 to 2014 accrued to the top decile of the population. A side effect of hyper-easy monetary policies was a further sharp increase in the price of real estate and particularly rental prices in cities in OECD countries. Property owners became richer, while property renters, that is, low and middle income workers, suffered. Housing related inequality has also emerged as one of the important factors behind recent protests in Hong Kong and Santiago (Figure 8).
Problems rooted in income inequality are also afflicting some EM economies
The emerging consequences of rising inequality
The powerful economic convergence, which has taken place between EM and developed economies and which has lowered inequality between EM countries in recent years was rooted in globalisation. The end of the Cold War facilitated globalisation and the integration of many EM economies into the global economic fabric on the back of greater political stability, better macroeconomic policies and the establishment of local markets. In short, EM began to compete with developed markets on merit.
Yet, populists are now attacking globalisation, labeling it a villain, which steals purchasing power from low-skilled middle-class workers in developed countries. Populists, such as Donald Trump in the US and advocates of Brexit in the UK, are building political careers by selling a notion that people from EM are to blame for the woes of disenfranchised segments of the population in developed economies. They blame inequality and relative economic decline on immigration from Mexico (in the US) or the EU (in the UK). They accuse China of stealing intellectual property and taking manufacturing jobs away. Their anti-immigration and anti-establishment policies may confer upon them a temporary sense of power, but these policies will eventually have serious negative economic consequences for developed economies over the longer term.
Populists are increasingly blaming EM countries for the discontent among disenfranchised groups in developed countries
The problem with the populist anti-globalisation rhetoric is that it is fundamentally wrong. The hard truth is that EM countries have upped their game by becoming genuinely more competitive, while governments in developed economies have opted for the easy option of cheating rather than facing their own failures to deal with their home grown problems of declining productivity and rising income inequality. Since no amount of political blame-shifting will change these the hard economic facts, it is only a question of time before the emptiness of this rhetoric against globalisation is gradually exposed as a lie. The political pendulum is then likely to swing from the Right to the Left.
While Left-wing UK populist Jeremy Corbyn failed spectacularly in the recent UK general election, this failure may ultimately have had more to do with his personality than his message. The Left is becoming more radical across the Western world as voters demand more state support. The Right is also responding to this message as can be seen from Prime Minister Boris Johnson’s pledges of lavish spending on the National Health Service. Other examples include Trump’s state support for US farmers and the inefficient US steel industry.
In the US, the core vision behind Elizabeth Warren and Bernie Sanders is to redistribute income, especially from billionaires. Warren’s proposal to tax the wealth of people with more than USD 50m in net-worth is attracting attention. A New York Times poll conducted in July 2019 found that “two-thirds of Americans, including a majority of Republicans, support Warren’s proposal”. The most recent candidate to enter to the race, billionaire Michael Bloomberg, even pledged to increase taxes on people like himself, i.e. billionaires. The entire Democratic Party has placed comprehensive welfare reform as its core policy objective.
It is ultimately not critical whether the Democratic candidate wins the next US presidential election or not. Rather, the point is that re-distributive policies are now firmly on the political agenda and likely to stay there. It is only a question of time – be it 2020 or later – before a government with an explicit redistributive agenda assumes power in the most liberal capitalist economies in the world. The market will soon have to start to price in this possibility and its likely consequences, which may include, but not be confined to, capital flight as the wealthy and businesses seek to hide their assets in jurisdictions that offer a less draconian treatment of wealth.
Section 4
Emerging themes: misallocation of global capital and slowing growth
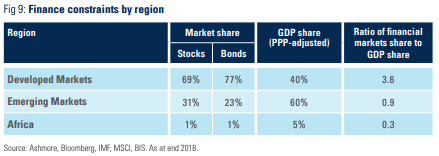
Slowing global growth is likely to emerge as a second powerful theme in finance in the coming years. The real reason for the ongoing slowdown in global growth is misallocation of capital on a global scale. The scale of the skew in global asset allocation can be seen in Figure 9, which compares the ratio of global market shares to global GDP shares for developed countries and EM. In developed economies, the ratio is 3.6, which shows that rich countries hold a far greater share of the world’s money than their share of global output. By contrast, the ratio is 0.9 in EM and only 0.3 in Africa. In other words, the countries with the largest growth potential have the least amount of financing, while the countries with slowest growth rates and lowest growth potential are drowning in money.
Countries with the largest growth potential have the least amount of financing, while the countries with the lowest growth potential are swimming in money
Granted, global capital has always been skewed towards wealthier countries, but monetary policies in developed economies in recent years massively increased the imbalances. So much capital is now sitting in developed economies that its marginal effectiveness in growth terms is at or even below zero. But this also means that the opportunity cost of shifting money out of developed markets would be tiny, since the marginal growth effectiveness is so small to begin with. By contrast, EM markets are underfinanced and can readily absorb more capital and, importantly, inflows to EM would relieve severely binding finance constraints to push up growth rates.
Despite the obvious economic merit in re-allocating capital from developed markets to EM, policy-makers are focused on other ways to address the growth challenge, particularly fiscal stimulus. This is unfortunate. Developed countries already rely so heavily on fiscal stimulus that productivity growth is declining at the margin, mainly because a unit of public spending in its current form is less productive than a unit of private spending.12 Hence, barring major improvements in the quality of public spending it is unlikely that further stimulus will do anything other than provide a brief boost to economic activity followed by yet slower trend growth afterwards.
While policy-makers are (so far) largely oblivious to the problem of misallocation of capital, we think investors will be more alert. They will lead the shift in global capital back to EM, because the asset class is more attractive relative to developed markets. Two arguments in particular will sway them.
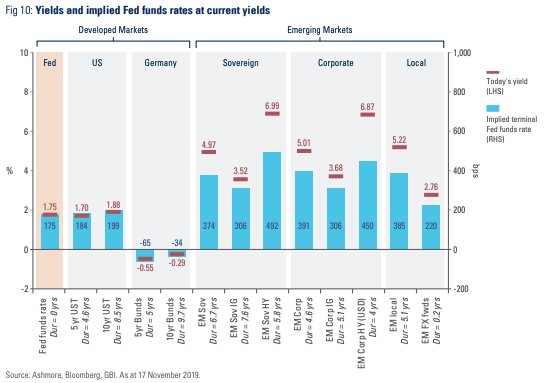
First, relative valuations in EM are dramatically better than those in developed economies. Figure 10 compares EM and developed market bond yields (red lines) and the Fed funds rates (grey columns) that have historically been consistent with the current level of yields. While US bonds look fairly priced relative to the Fed funds rate, German bonds trade at yields that are consistent with a much lower Fed funds rate, while EM bonds trade at yields that are consistent with a far higher Fed funds rate. These yield distortions, which were caused by QE, present a strong rationale for allocating more to EM.
EM bond yields remain too high, distorted by years of interest subsidies in developed economies
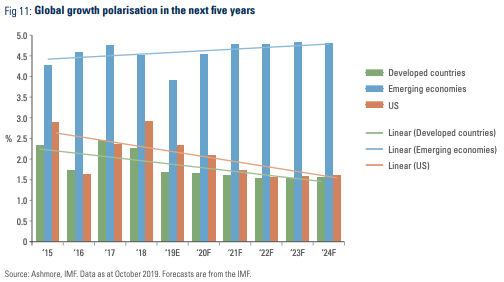
Second, EM looks far better than developed economies in terms of growth prospects. Growth in developed economies is set to slow to just 1.6% per annum by 2024, while EM growth is expected to re-accelerate to about 4.8% over the same period, according to the IMF (Figure 11). The IMF’s numbers imply that EM economies will contribute about 80% of global growth over the next five years with China alone contributing more than a quarter of all global growth. In our view, the IMF estimates may well understate EM’s eventual contribution to growth, because the IMF unlikely to have accounted for capital flowing back to EM and the associated pickup in domestic demand as financial conditions ease.
Relative growth prospects strongly favour EM over the next half a decade
Ironically, the single largest ‘unpriced’ risk in the global economy today, US recession, may well be the important trigger of rapid rebalancing of global capital in favour of EM. This would be due to a sharp fall in the Dollar. There is more bull-market risk-willing capital sitting in US stocks and in the Dollar than in any other market in the world. In a US recession, this money would flow to the rest of the world, where it would stimulate growth. Since the rest of the world is 80% of global GDP, it follows that a US recession would likely be net growth positive for the world economy. The timing of a US recession is unclear, of course, but the symptoms of a late-cycle slowdown are on display for all to see already, including the overvalued currency, large trade deficits, overvalued financial markets, big fiscal deficits, resilient consumers and weakening producers, declining productivity growth and gradually rising labour costs. US growth has halved since mid-2018.
Appendix
The EM fixed income universe
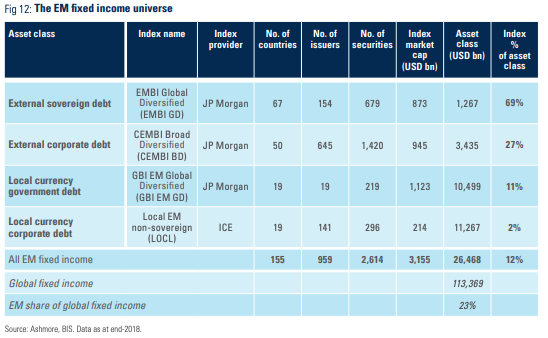
As of end-2018, the EM fixed income universe reached the size of USD 26.5trn, or 23% of global fixed income (Figure 12).13 The asset class grows roughly 10% per year (USD terms). Based on recent trends, the asset class should reach at least USD 39trn by 2024 at which point EM fixed income will make up more than a quarter of global fixed income.
The EM fixed income asset class is extremely diverse. The four major EM fixed income benchmark indices cover 154 individual EM bond markets. External debt is best represented in benchmark indices, but local bonds make up more than 80% of the EM fixed income universe. More than half of EM bonds – 56% – are corporate bonds.
Asia continues to dominate EM bond markets with 78% of all outstanding securities. China alone accounts for 51% of all EM bonds. The second largest region in terms of issuance is Latin America followed by Middle East & Africa and Eastern Europe.

No part of this article may be reproduced in any form, or referred to in any other publication, without the written permission of Ashmore Investment Management Limited © 2019.
Important information: This document is issued by Ashmore Investment Management Limited (‘Ashmore’) which is authorised and regulated by the UK Financial Conduct Authority and which is also, registered under the U.S. Investment Advisors Act. The information and any opinions contained in this document have been compiled in good faith, but no representation or warranty, express or implied, is made as to their accuracy, completeness or correctness. Save to the extent (if any) that exclusion of liability is prohibited by any applicable law or regulation, Ashmore and its respective officers, employees, representatives and agents expressly advise that they shall not be liable in any respect whatsoever for any loss or damage, whether direct, indirect, consequential or otherwise however arising (whether in negligence or otherwise) out of or in connection with the contents of or any omissions from this document. This document does not constitute an offer to sell, purchase, subscribe for or otherwise invest in units or shares of any Fund referred to in this document. The value of any investment in any such Fund may fall as well as rise and investors may not get back the amount originally invested. Past performance is not a reliable indicator of future results. All prospective investors must obtain a copy of the final Scheme Particulars or (if applicable) other offering document relating to the relevant Fund prior to making any decision to invest in any such Fund. This document does not constitute and may not be relied upon as constituting any form of investment advice and prospective investors are advised to ensure that they obtain appropriate independent professional advice before making any investment in any such Fund. Funds are distributed in the United States by Ashmore Investment Management (US) Corporation, a registered broker-dealer and member of FINRA and SIPC.
1 Returns as at 17 December 2019.
2 See ‘Under the radar: the EM bond market rally’, Financial Times, Beyond Brics, 22 November 2019
3 As at 17 December 2019.
4 ‘Broad’ means that the asset class includes both high yield and investment grade credits.
5 We assume that 50% of the change in UST yields is passed through to yields in EM. This is based on the average pass-through over the long-term.
6 See: ‘Convergence, Big Time!’, Market commentary, October 2018.
7 Source: JP Morgan, Bloomberg. Data as at 17 December 2019.
8 Based on our research, historically, the pass through from shifts in the UST curve to local rates has only been about 30%.
9 Source: JP Morgan, Bloomberg. As of 17 December 2019.
10 Source: JP Morgan, Bloomberg. As at 17 December 2019.
11 See: https://www.imf.org/en/Publications/Policy-Papers/Issues/2019/03/08/Corporate-Taxation-in-the-Global-Economy-46650
12 For a much more detailed discussion of the negative correlation between productivity growth and the ratio of government to private sector debt in the US please see: ‘The missing point in the global growth debate’, Market Commentary, 11 December 2019.
13 See: https://www.imf.org/en/Publications/Policy-Papers/Issues/2019/03/08/Corporate-Taxation-in-the-Global-Economy-46650