Emerging Markets (EM) investment grade (IG) bonds have delivered superior returns to US IG fixed income, both on nominal and risk-adjusted bases.
On a forward looking basis, EM IG should continue to outperform as the asset class offers higher spreads than US assets with similar leverage metrics for corporate bonds and superior indebtedness metrics at sovereign levels. The Fed is unlikely to be buying EM IG bonds directly, but the asset class should benefit technically from both scarcity value and valuation advantages as US bond markets get progressively more distorted by direct Fed purchases.
The EM IG asset class is sizeable, diverse and liquid enough to receive large allocations. Still, the technical positioning is favourable with the supply of EM IG bonds limited by the fact that most IG EM sovereigns and corporations now meet the bulk of their financing needs in local debt markets.
Overall, EM IG bonds represent a great opportunity for investors seeking to monetise the EM risk premium with moderate volatility in a world, where higher yielding IG-rated securities are increasingly difficult to come by.
Size and composition of the EM IG bond markets
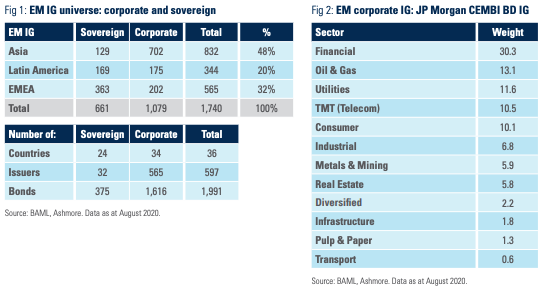
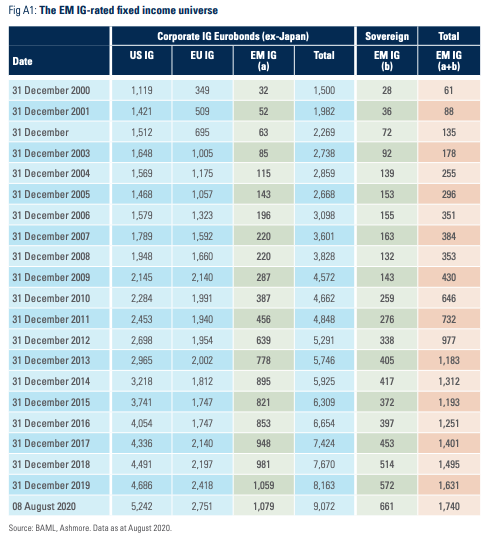
The EM IG bond market is a sizeable asset class with USD 1,740bn of assets comprising USD 1,079bn of corporate debt and USD 661bn of sovereign bonds (Figure 1). In terms of geographical distribution, 48% of outstanding bonds are from Asian issuers, 32% from Emerging Europe, Middle East and Africa (EMEA), and 20% Latin America. EMEA represents 55% of the sovereign universe due to large issuance from Middle East sovereigns over the last three years, whereas Asia dominates the corporate universe with 65% of all bonds. Furthermore, EM corporate IG is a diverse asset class encompassing the world’s largest banks, such as ICBC and Bank of China, the largest resource companies, such as Vale and Saudi Aramco, as well as the largest internet companies in the world, including Alibaba, Baidu, and Tencent. These companies are not only extraordinary businesses, but also strategic for the countries from which they originate, thus providing a double layer of credit risk protection.
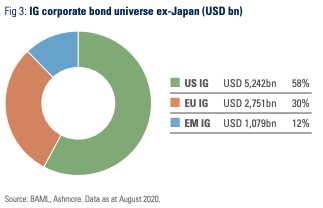
While large enough to be eminently investable, the EM IG fixed income asset class is relatively small compared to the IG bond universe in developed markets (DM). The corporate EM IG universe accounts for about 12% of the total corporate IG universe ex-Japan as shown in Figure 3, while the sovereign EM IG universe is dwarfed by the large sovereign bond markets in the US, Japan, and Europe. EM IG bond markets therefore benefit from scarcity value.
The size of the EM IG universe is constrained by two factors. First, rating agencies tend to be ruthless in assessing credit worthiness in EM bond markets. DM sovereign issuers, such as the US, Japan, the UK, or Italy tend to retain their IG ratings despite the fact that their debt to GDP ratios are in excess of 80%, while most EM sovereign issuers with debt to GDP rations in excess of 60% tend to soon find themselves at serious risk of downgrade to junk status. As for high quality EM corporates, barring a few rare exceptions, their ratings tend to be subject to so-called ‘sovereign ceiling’ constraints, which means that their ratings are required to be below that of the sovereign, regardless of the quality of the corporate. The second reason why the EM IG fixed income universe is small is that EM countries and corporations tend to finance the bulk of their liabilities in their deep and liquid local bond markets. As EM local currency bond yields have declined, so has the cost of funding for large IG-rated EM corporations, which often prefer to borrow locally, thereby reducing their exposure to oscillations in foreign exchange markets.
Superior risk-adjusted returns
Figure 4 charts the efficient frontier for EM and DM bonds markets for the period since the inception of JP Morgan’s IG and HY indices sovereign and corporate bond indices in June 2003.
EM corporate IG bonds have delivered 5.9% annualised return, or 0.6% higher return than US IG corporates, despite identical volatility. EM sovereign IG bonds have accrued an average annual return of 7.3%, which exceeds US sovereign bond market returns by a whopping 3.3% with only 2.0% higher volatility. Furthermore, EM sovereign higher returns and volatility than EM corporates can be explained by the longer duration profile of sovereign bonds.
The JP Morgan EMBI GD IG Index (sovereign) has a duration of 9.5 years whereas the JP Morgan Corporate EMBI BD IG (CEMBI IG) has a duration of only 5.7 years.
Overall, based on the past 17 years, a portfolio of EM IG assets would have been superior to a portfolio of DM IG bonds, while diversifying a US IG bond portfolio by adding EM IG assets would have improved the total risk-adjusted return of a portfolio of DM bonds significantly.
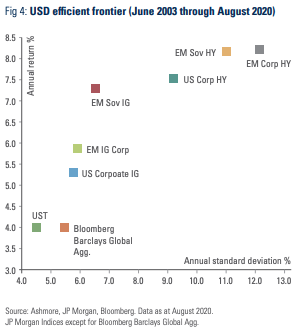
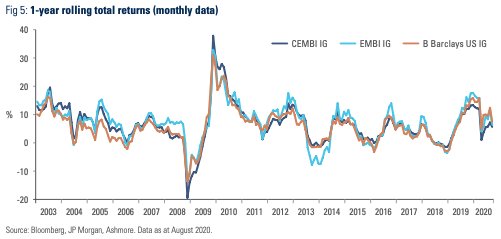
Figure 5 highlights the consistency of returns of the asset class. Since 2009, the total return on a rolling 1-year basis of the CEMBI BD IG has been negative only on three occasions (Dec-2013, Jan-2016 and Nov-2018) and never below -1.5%. EM corporate IG outperformed US corporate IG in all the downturn episodes since 2002, except for 2008. Importantly, the asset class weathered the coronavirus shock test with outstanding marks. The CEMBI BD IG rolling 1-year total return was +1.0% in March 2020 and +4.0% for the EMBI GD IG, only a marginal underperformance compared to US corporate IG with a return of +5.0%. The high correlation between EM IG and US IG bonds – 85% since 2001 – is also evident from Figure 5.
Forward looking prospects
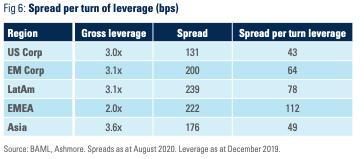
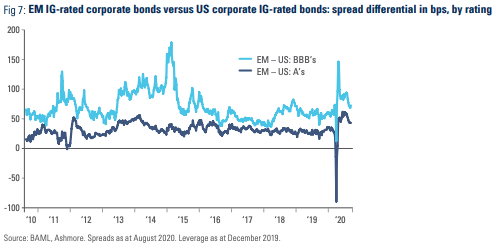
As per figure 6, EM corporate bonds offered 200bps of spread over UST at the end of August, which is almost 50% higher than US corporates (131bps). The higher spread for EM IG corporate bonds is not justified by leverage, which is almost identical for EM and US corporate bonds. Within EM regions EMEA offers the highest spread per turn of leverage (credit spread in basis points divided by the debt/EBITDA ratio) owing to lower leverage ratios and similar spreads to Latin American IG rated bonds. Figure 7 illustrates the current spread differential of A-rated EM corporate bonds and US corporates, which is close to the widest level in 10-years, while the EM-US BBB spread differential is close to the 10 year average, but still somewhat elevated.
Monetary policy tailwinds
The coronavirus-induced recession forced governments and central banks across the world to implement extraordinary fiscal expansions and monetary policy easing, but particularly in developed economies. DM central banks are no longer in the business of merely supporting economies with rate cuts and purchases of government debt securities. Rather, the Bank of Japan (BOJ), the European Central Bank (ECB), and the US Federal Reserve (Fed) have now expanded their purchase programmes to also include large volumes of corporate debt. Furthermore, the BoJ has capped the yield of the 10-year Japanese government bond at around 0% in a bid to control the term structure of the yield curve. So far, the Fed has refrained from adopting a policy of explicit yield curve control, but has instead opted to allow inflation to increase above its 2% target before tightening monetary policy, which may nevertheless be a precursor for future yield curve control if the curve bear steepens in response to inflation in the future. In any case, it seems likely that term yields in the US will be limited to the upside for the foreseeable future.
This environment should suit EM investment grade bonds. They will naturally benefit from ‘low for longer’ yields on government bonds and should experience spread tightening. In fact, in our view, it is not farfetched to imagine EM IG spreads to trade at similar levels to DM IG spreads, given the better credit fundamentals in EM. Reacceleration of EM growth in the next few years should be of benefit to both sovereigns and corporates, since higher relative growth means greater improvements in leverage ratios.
Risks
Investors in Dollar-denominated IG-rated bonds face two principal risks. The first risk is that the Fed loses control of inflation expectations, which could force a sharp U-turn on monetary policy and rising rates. This situation could arise from a failure on the part of the US government to reign in large fiscal deficits over a multi-year period, forcing the Fed to keep buying government bonds to fund the deficits. The inflation picture would deteriorate faster if higher commodity and/or durable goods prices ensue in response to a weaker Dollar or renewed trade war. This would send term yields higher across all fixed income securities, leading to significant losses to holders of long duration IG bonds.
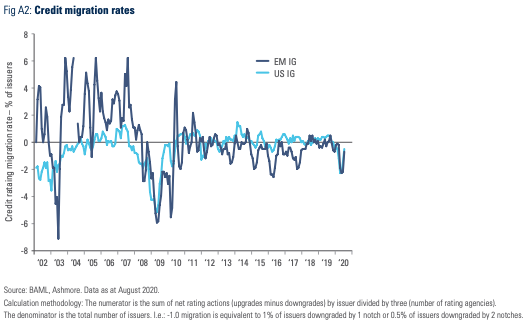
The second risk pertains to ratings downgrades. Over the last five years, several EM countries were downgraded to sub-IG, including Azerbaijan, Bahrain, Brazil, Oman, Turkey and South Africa. This resulted in a less diversified but more resilient universe as the remaining IG-rated sovereigns and corporates are less likely to be downgraded, in our view. At present, six countries could be downgraded to junk status over the next years, namely Colombia, Romania, Kazakhstan, Russia, and India, which are rated BBB- or equivalent by at least two rating agencies, whereas Morocco has one junk rating (Ba1 by Moody’s) and two IG ratings (BBB- by S&P and Fitch). These countries combined represents 21% of the JP Morgan EMBI GD IG Index and 14% of the CEMBI BD IG. If all countries got downgraded, the number of countries would decline by 19 and 29 on the sovereign and corporate benchmarks respectively. The asset class would remain highly investable and diverse even if all the countries above got downgraded.
Most EM countries are likely to fight hard to retain their IG status. Russia, for example, has pristine credit metrics, so that a downgrade would have to be justified solely on political grounds. Romania, Kazakhstan, and Morocco have strong balance sheets and are currently taking measures to reduce their fiscal deficits and limit their indebtedness. The growth outlook for both India and Colombia are good and both countries finance their deficits primarily in local currency, which is clearly supportive for the ratings of their external debt.
Appendix

No part of this article may be reproduced in any form, or referred to in any other publication, without the written permission of Ashmore Investment Management Limited © 2020.
Important information: This document is issued by Ashmore Investment Management Limited (‘Ashmore’) which is authorised and regulated by the UK Financial Conduct Authority and which is also, registered under the U.S. Investment Advisors Act. The information and any opinions contained in this document have been compiled in good faith, but no representation or warranty, express or implied, is made as to their accuracy, completeness or correctness. Save to the extent (if any) that exclusion of liability is prohibited by any applicable law or regulation, Ashmore and its respective officers, employees, representatives and agents expressly advise that they shall not be liable in any respect whatsoever for any loss or damage, whether direct, indirect, consequential or otherwise however arising (whether in negligence or otherwise) out of or in connection with the contents of or any omissions from this document. This document does not constitute an offer to sell, purchase, subscribe for or otherwise invest in units or shares of any Fund referred to in this document. The value of any investment in any such Fund may fall as well as rise and investors may not get back the amount originally invested. Past performance is not a reliable indicator of future results. All prospective investors must obtain a copy of the final Scheme Particulars or (if applicable) other offering document relating to the relevant Fund prior to making any decision to invest in any such Fund. This document does not constitute and may not be relied upon as constituting any form of investment advice and prospective investors are advised to ensure that they obtain appropriate independent professional advice before making any investment in any such Fund. Funds are distributed in the United States by Ashmore Investment Management (US) Corporation, a registered broker-dealer and member of FINRA and SIPC.