Science is winning the battle against the covid-19 coronavirus. The advance in therapies has already contributed to a significant reduction in hospitalisation and fatality rates vis-à-vis the number of cases, while the multiple of approved and soon to be approved vaccines puts the livelihoods of billions of people on track to normalise in 2021.
In addition to improving prospects for global health, seven themes are likely to dominate financial markets in 2021, namely:
Theme 1: The global economy heads for a ‘V-shaped’ recovery with Emerging Markets (EM) in the lead;
Theme 2: Fiscal and monetary policies remain expansionary in Developed Markets (DM);
Theme 3: Increasing pressure on DM governments to act on grotesque levels of inequality;
Theme 4: Rising inflation risks in the United States (US) due to the concomitant rebound in economic activity, extremely easy monetary policies, and fiscal expansion;
Theme 5: Growing pressure on the Dollar from large US twin deficits;
Theme 6: Improving liquidity conditions with positive spill overs to asset prices and growth as flows to EM increase on the back of a weaker Dollar;
Theme 7: EM equities followed by EM local bonds look set to perform the best in 2021, while EM Dollar-denominated debt should benefit from favourable technicals and spread compression as the EM risk premium declines.
The following report expands on each of the seven themes for 2021 followed by concluding remarks.
Theme 1
The global economy heads for a ‘V-shaped’ recovery with EM in the lead
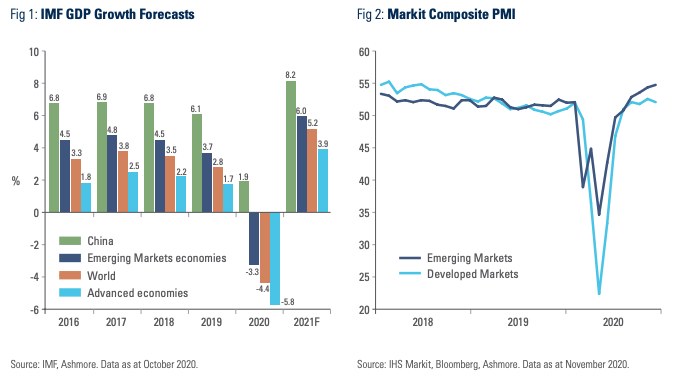
The arrival of effective vaccines against the Covid-19 coronavirus will allow for a definitive normalisation of mobility and economic activity in 2021. The continuation of the ‘V-shaped’ economic recovery, which already began to unfold in Q3 2020 is likely to be highly supportive for global market sentiment.
Figure 1 shows real GDP growth forecasts from the International Monetary Fund (IMF) based on its latest World Economic Outlook from October 2020. Since the release of this report, economic activity has surprised to the upside in EM, which means that the growth contraction in EM in 2020 is likely to be as much as 0.5% smaller than originally forecast by the IMF. Moreover, the rebound in 2021 now looks set to be stronger as well.
EM may have been the first to be impacted by the virus, but EM economies both contracted less than DMs and are now rebounding at a faster pace, according to PMIs as shown in Figure 2. We expect the current EM growth outperformance to continue in 2021 and beyond.
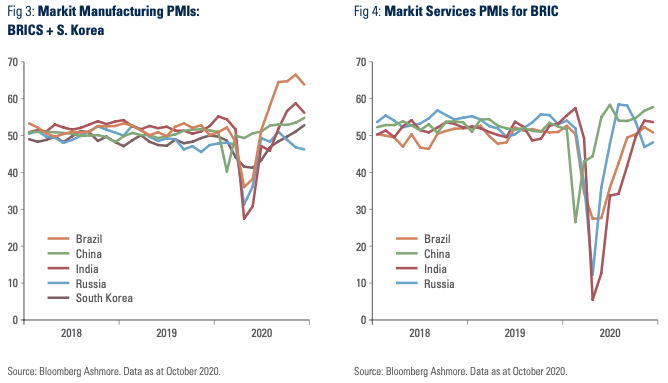
EM’s growth outperformance in 2020 was initially led by China. China was the first country affected by the coronavirus crisis and the first country to decisively control the outbreak. China has since gone on to recover strongly. Alongside other Asian manufacturers, such as South Korea, China has been able to benefit from the early rebound in manufacturing as consumption of durable goods (particularly technology) increased, as the outbreak spread westwards. More recently, warmer climates in the Southern Hemisphere have helped many other EM countries to reduce the number of virus cases and remove mobility restrictions, which in turn has facilitated a stronger economic upswing, now evident in larger EM economies, such as India and Brazil. The manufacturing PMIs of Brazil and India are at the highest levels going into 2021, even stronger than China and South Korea as shown in Figure 3. In other words, the recovery in EM economic activity is broadening from North Asia to a wider EM universe as 2021 approaches.
There is more upside to come from service sectors. As Figure 4 shows, the services PMI indices experienced a deeper contraction and so far a shallower recovery in most countries (ex-China) due to the fact that mobility has still not fully normalised. It is therefore likely that the arrival of vaccines will benefit services as consumption patterns and travel habits normalise. Alongside a broader recovery in domestic demand due to easier financial conditions – more on this below – the recovery of EM’s service sectors should ensure that the economic rebound in EM in 2021 will be broad-based.
Theme 2
Fiscal and monetary policies remain expansionary in DMs
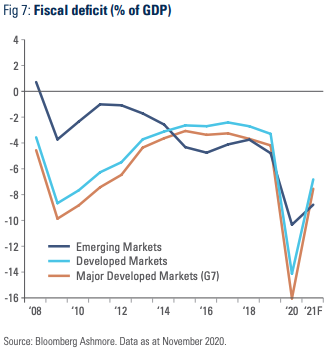
The start of the global economic rebound in 2020 has been aided by very large fiscal expansions in the world’s largest economies. In DM, the fiscal deficits have been funded by enormous expansions of central bank balance sheets which facilitates purchases of government bonds as shown in Figure 5. In Dollar terms, the central banks of G-10 economies will have injected close to USD 4trn of liquidity in financial markets via bond purchases during 2020 and are on track to inject another USD 2.8trn in 2021 according to Morgan Stanley. These central bank assisted fiscal expansions drove debt to GDP ratios to all-time highs in most DMs as shown in Figure 6.
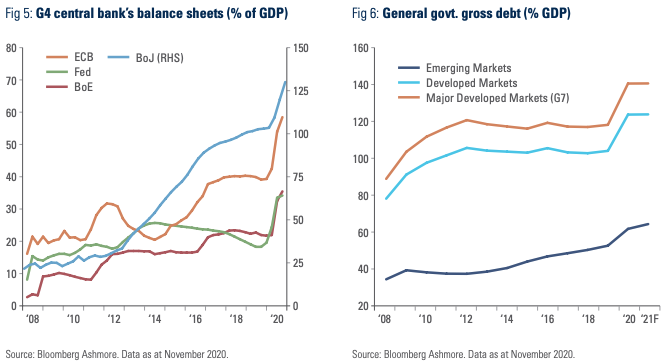
Fiscal balances are likely to improve in 2021 as shown in Figure 7, but mainly due to the economic rebound. Nevertheless, fiscal deficits are likely to remain elevated by historical standards, which will force central banks in DMs in particular to increase the size of their balance sheets further, in our view.
While some large EM economies also increased their fiscal deficits in 2020, their debt trajectories remain far lower than in DMs. This is partly due to a much lower starting point for debt/GDP, partly due to the fact that EM countries have run smaller fiscal deficits in 2020. Moreover, since most of large EM countries have funded deficits in their own local debt markets, where, in contrast to previous global crises, government bond yields collapsed, they have been able to borrow at low interest rates, which has, for the most part, kept debt sustainability in place.
While more than a dozen EM countries engaged in purchases of government bonds in 2020, the majority of these did so solely to stabilise yield curves in the face of extreme volatility in global markets. Indeed, Indonesia was the only EM country to implement a sizeable quantitative easing (QE) programme to systemically purchase government debt during the course of 2020. However, Indonesia’s QE program differed in important respects from the QE programs in DMs in that Indonesian’s QE program is not designed to be a permanent feature of Bank Indonesia’s financial toolkit. Bank Indonesia has pledged to end the programme as soon as the government returns to its original fiscally conservative state with the recovery from the covid-19 shock. Such a recovery looks very likely, not least due to the recent passage of a wide-ranging labour market reform (the Omnibus Law), which radically improves the business environment for foreign investors in Indonesia.1
Theme 3
Increasing pressure on DM governments to act on inequality
One of the most important unintended consequences of QE has been a large increase in income and wealth inequality. In a recent newsletter, Scott Galloway, a Professor of Marketing at the New York University, summarised how inequality has emerged as the defining political issue in the US for the coming decade:
“The two largest asset classes in America are residential real estate and stocks and 10% of the population controls 70% of the value of these assets. Both real estate and stocks are trading at all-time highs as Tesla is up 590% year to date, while 25% of US households have experienced food insecurity this year. Jeff Bezos is worth more than every citizen in Vermont, Alaska, and Wyoming combined, while a fourth of Americans can’t pay their rent.” 2
The extreme inequality in Western societies today is the result of technological progress and globalisation, which together have ensured that benefits of these positive developments have been distributed disproportionately towards wealthy segments of the population. Ultra-easy monetary policies over the past decade have in turn hugely exacerbated the inequality problem as interest rates at all-time low levels subsidise capital markets and thereby help to drive asset prices higher, benefiting asset-rich individuals and companies disproportionately.
The inequality problem is likely to have a direct impact on economic policies in the US in 2021. As larger segments of US society demand greater fairness, pressure will mount for redistributive policies that favour the poorest elements in society which in turn, increases the risk that taxes will rise for the super-rich and companies.
Indeed, Janet Yellen, newly appointed soon-to-be US Treasury Secretary, has written extensively about the unemployment problem in the poorer segments of the US population. As she works towards achieving a more egalitarian society, it is difficult to imagine how such a transformation can be achieved without a combination of higher expenditure on social assistance and higher taxation on the wealthiest parts of the population. The risk of higher taxes is particularly acute for the biggest winners over the last decade, namely the technology sector, which is already under bipartisan attack due to alleged monopolistic business practices and their alleged involvement in recent years in manipulating election outcomes across the world. Another tail risk is anti-trust measures becoming more widely applied in a bid to control the expansion of monopolistic positions in the tech sector in the name of fighting inequality.3
Having said that, tax hikes may not be forthcoming in 2021 if the Republicans keep control of the Senate (the Democrats still have a slim chance of winning two key seats in the state of Georgia in January). Even if no new taxes are forthcoming, it still seems very likely that spending will go up as there is bipartisan support for further expenditure to combat the effects of the economic downturn, now aggravated by the second wave of the pandemic. Republicans and Democrats only failed to achieve a consensus on more spending in 2H 2020 due to the presidential election, but this obstacle will be out of the way by the time the honeymoon period for the new president begins after 20 January 2021.
Theme 4
Rising US inflation risks in DM
A key difference between the Fed’s most recent QE programme and past QE programmes is that the current programme funds the US government’s large fiscal deficit. Much of the deficit is funding unemployment benefits, so QE, via the deficit, is putting money into the pockets of individuals. This stands in sharp contrast to QE in the 2009-2014 period, when QE principally provided liquidity to the banking sector. Banks in turn placed much of the money back to the Fed as excess reserves.
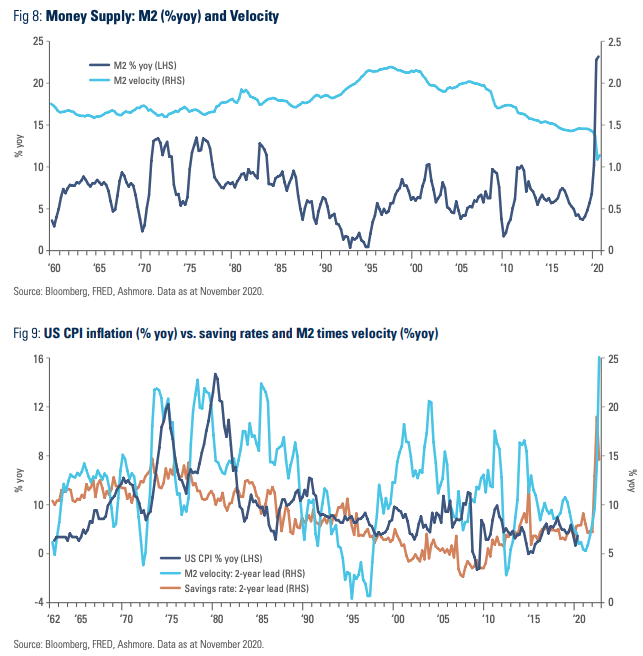
The recent cash handouts have been larger in aggregate than incomes lost during the recession, which is why the level of consumption held up well during the recession at the same time that private saving rates actually increased. The increased availability of cash is a latent inflation risk. It can be measured by the growth of the broad monetary aggregate, M2,4 as shown in Figure 8. M2 growth is running at the fastest pace since the beginning of the series and almost twice the pace of the 1970s when US inflation hit double-digits. Figure 8 also shows the depressed level of money velocity, which corroborates the fact that consumers saved, for now, a good deal of the money they were given in government handouts. The combination of high savings and high money supply means that any shock that causes individuals to begin to spend could rapidly drive money velocity higher, which in turn could ignite inflation. This risk is illustrated in Figure 9, which shows the current yoy rate of US CPI inflation superimposed alongside the 2-year lead of: (a) M2 multiplied by money velocity; and, (b) saving rates. It is unlikely that the latest inflation risk recedes anytime soon, unless DM governments enact policies to reign in fiscal spending, but this is unlikely in the short term, in our view the dollar is for sale.
So the key question is what kind of shock could suddenly trigger a rise in money velocity and therefore inflation? One risk is supply shocks. Some commodity prices, like iron ore, copper and lumber are already experiencing sharp price increases due to higher demand from China and the US amidst constrained supply. Precious metals and cryptocurrencies have also recently experienced sharp price increases; early signs, perhaps, that investors are getting uneasy about the risk of currency debasement due to the combination of fiscal profligacy and money printing. Investment has been very modest in many commodity sectors in the last decade as a result of tighter environmental regulations, low commodity prices, and country specific issues.5 These supply-side constraints could be exposed by the economic rebound in 2021. Finally, cost-push inflation could emanate from, say, collapsing supply of airline services, which in turn drives up the cost of perishable traded goods, such as in-natura foods and pharmaceutical goods.
Another potential source of higher inflation in 2021 is the fading influence of several long-term factors, which have driven inflation rates lower over the last 40 years, such as technology, globalisation, and the impact on savings rates of rising inequality and demographic trends. For example, the redistribution of wealth from rich to poor will almost certainly drive up the marginal propensity to consume in the economy as a whole. Demographic trends may also be turning from a deflationary to an inflationary factor, according to a recent study by the Bank of International Settlements (BIS).6
Perhaps most importantly of all, the credibility of DM central banks is being called into question for the first time since Paul Volcker assumed the position of Federal Reserve Chairman in August 1979. Inflation can rise solely due to loss rising inflation expectations. At root, the problem of central bank credibility is due to the fact that debts across DM economies today are now so large that its sustainability can only be maintained at very low levels of interest rates. The Fed has already conceded that inflation can exceed the erstwhile 2% inflation target. However, should inflation begin to rise much faster than 2%, central banks would find it extremely difficult to hike sufficiently without pushing DM governments into severe debt service problems. On the other hand, if they do not hike sufficiently, then term yields in DM bond markets will rise, which also pushes up the cost of funding. This is why inflation would likely require the Fed to cap term yields by purchasing bonds, in other words, engage in from covert to overt financial repression. This, combined with large twin deficits, would surely pose serious challenges for the Dollar.
Theme 5
Growing pressure on the Dollar from large US twin deficits
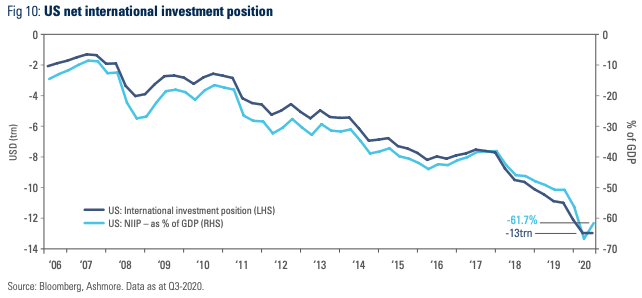
The US economy is extremely imbalanced going into 2021. Foreign capital has been hugely supportive of the strong performance of the US stock market against the backdrop of the economic recovery from the crisis of 2008/2009. In fact, since 2006, the US has received some USD 11trn in inflows from the rest of the world in excess of what Americans have invested abroad (Figure 10). In the last four years alone, the net investment balance has deteriorated to the tune of USD 5trn, thereby saddling the US to a net international liability of USD 13trn, or 62% of its GDP. The problem arising from America’s extreme reliance on foreign capital is that the trend is unsustainable. The Dollar is becoming more and more overvalued relative to US productivity growth.7 The bull market for the Dollar ends once Americans start diversifying their assets away from the Dollar and foreign investors reduce their exposure to US assets. What can trigger such a change?
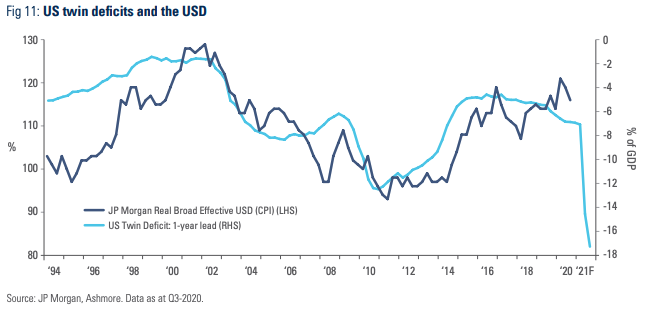
Arguably, Dollar depreciation is already underway. The US nominal broad effective exchange rate depreciated 11% between its peak on 23 March 2020 and 4 December 2020. Yet, the Dollar was so overbought that it still remains some 40% higher than at its weaker level in October 1994. There may well be significant potential for further weakness judging by the unprecedented size of the US twin deficits. As Figure 11 shows, the sum of the US fiscal and current account deficits has now reached 18% of GDP, which is the largest on record. Ordinarily, such large twin deficits can only be sustained with high interest rates to attract sufficient foreign capital to keep the currency stable, but US interest rates are at their lowest relative to the rest of the world since 2012, while the Fed remains publicly committed to keeping interest rates low for the foreseeable future. The past relationship between the twin deficits and the Dollar, as depicted in Figure 11, points to major downside risk for the Dollar around one year after the twin deficits balloon. The Dollar may therefore well be for sale in 2021.
Theme 6
EM is likely to experience improving liquidity conditions with positive spill overs to asset prices and GDP growth as flows to EM increase on the back of a weaker Dollar
The BIS has done a series of studies over the years showing how a strong Dollar leads to lower GDP growth in EM countries.8 This is because EM countries have shallower and narrower capital markets than their DM peers, rendering them ‘capital starved’. When the Dollar strengthens it puts downward pressure on the revenues of EM companies in USD terms, which prompts foreign banks and institutional investors, which care about returns in Dollar terms, to reduce exposure to EM local currency denominated assets. The resulting capital outflows not only impacts EM asset valuations, but also adversely impact GDP growth by tightening financing conditions in the real economy. The result is a vicious cycle that can feed on itself for some time. Additionally, the strong Dollar put downward pressure on commodity prices, which hurt commodity exporters in EM more than helped EM commodity importers (who still suffered from the capital outflows). In fact, these very dynamics are the main explanation of why outflows from EM assets in the period of maximum QE in DMs from July 2011 to December 2016 led to weaker market performance of, and massive outflows from, EM assets as well as weaker economic growth in EM countries.
The same logic also works in reverse, however. As the Dollar turns lower, DM investors benefit from having exposure to earnings in local currencies, because they become more valuable in Dollar terms. Similarly, DM banks and institutional investors find that the credit risk and earnings profiles of EM corporations are improving as local currency revenues and profits increase in Dollar terms. This increases their willingness to extend credit and increase ownership of companies across EM. Such capital flows are converted into local currency enabling greater consumption and investment, and hence stronger domestic demand.
Theme 7
EM equities followed by EM local bonds look set to perform the best in 2021
• EM Equities have the highest potential total return
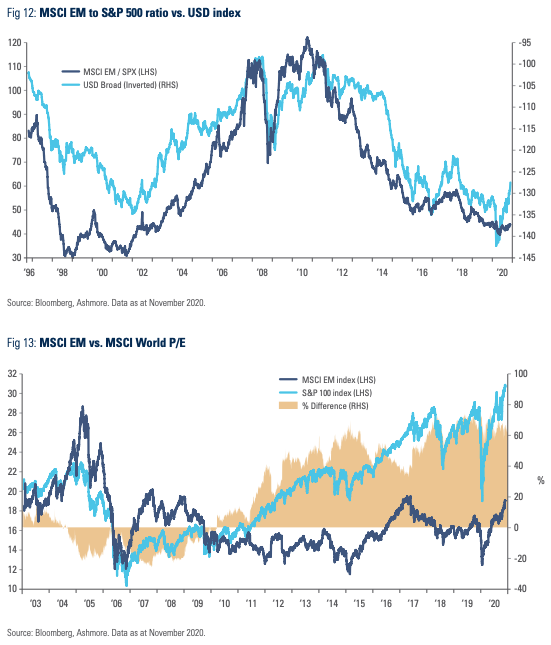
The return of capital to EM flips a vicious cycle into a virtuous one, with self-reinforcing forces linking currency strength, real GDP growth, earnings expansion, and, thus, asset price appreciation. Figure 12 illustrates the powerful link between exchange rates and equity market performance. A lower Dollar is strongly linked to outperformance of the MSCI EM equity index versus the US S&P 500 index. What makes the case for EM equities even more compelling is that valuations are significantly discounted (to the tune of about 60%) versus the S&P 500 (Figure 13). EM equities are likely to be supported both by earnings expansion and the potential for significant multiple re-rating versus US markets.
Specifically, EM equities now look to offer the highest potential total return of all EM asset classes in 2021, in our view. We expect investors to make as much as 36% in local currency terms, assuming that earnings expand in line with current consensus expectations of 32%, expected dividend yield of 3%, and a stable P/E multiple at the current level of 15x 1-year forward earnings. Even if the price-to-earnings ratio re-rates to the undemanding historical median of 12x, investors would still be looking at close to 10% return in local currency terms that is, before factoring in any currency appreciation.
• EM local currency bonds are attractive due to cheap FX and curve flattening potential
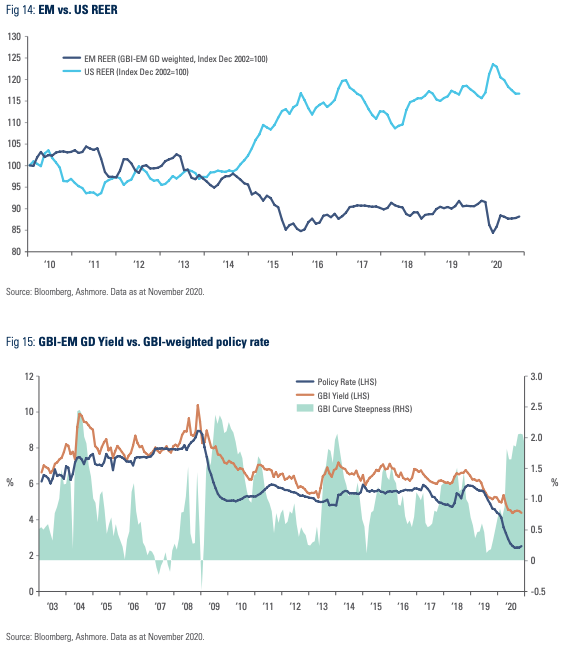
The asset class with the second largest total return potential in 2021 is EM local currency bonds. EM currencies are undervalued in real effective exchange rate terms as shown in Figure 14. In addition, local yield curves offer a healthy real positive yield in excess of 220bps (nominal yield minus current inflation), compared to about -150bps for US inflation-linked government bonds of similar duration.
While EM central banks slashed policy rates to the lowest levels in recent history in 2020, term yields declined by far less, which has left EM local yield curves at near-record steepness as shown in Figure 15. In 2021, as EM currencies rally and economic performance improves with the easing of financial conditions, the EM risk premium is likely to decline, which in turn should allow for EM yield curves to bull flatten through lower term yields.
Given the duration of local bonds, investors should expect to make about 5.4% in capital gain for every 1% decline in the term yield of the GBI EM GD. This return has to be added to the carry. Factoring in FX upside, investors should be able to see total returns in double-digits in 2021, even with relatively modest currency strength.
• Favourable technicals for EM Dollar-denominated assets
Dollar denominated EM bonds are particularly suitable for fixed income investors, who do not have the ability to allocate capital to EM local currency asset classes. In 2021, EM Dollar denominated bonds are likely to benefit from much lower supply of bonds following very heavy, mainly precautionary issuance of bonds in 2020. In a recent report, Bank of America Merrill Lynch (BAML) estimated that net issuance by US investment grade corporates (after accounting for debt payments) will reach about USD 260bn in 2021. Net issuance after all amortisations and early redemptions (including from callable bonds) will be close to zero, according to BAML. This would amount to the lowest volume of issuance on record and down from close to USD 1.2tr in 2020. The collapse in supply in 2021 will put further strong downwards pressure on EM IG spreads at a time when a staggering USD 17.5trn of mainly DM bonds already trade with negative yields. This is likely to act as a strong incentive for investors to allocate to EM Dollar-denominated bonds, which offer far better value.
• EM investment Grade (IG) bonds
Risk-averse long-term investors will be particularly drawn to EM investment grade Dollar-denominated debt.9 EM IG bonds are already seeing strong demand from so-called cross-over investors. That is, global bond managers whose primary focus is DM, but who can invest in EM on an opportunistic basis. While IG rated EM sovereign bonds tends to the first port of call for cross-over investors, EM IG rated corporate bonds are even more attractive, in our view, especially compared to US corporate bonds. EM corporates offer wider spreads than EM IG sovereigns and US IG corporates in spite of shorter duration, leading to a higher Sharpe Ratio over time. EM corporates also offer much greater diversification with more than 500 issuers across 34 countries and many different sectors within the individual economies.10 In comparison with sovereigns, most corporations have been far quicker to raise liquidity and adjust their balance sheets and operations to the Covid-19 shock. Governments will be forced to run fiscal deficits for longer in order to stimulate the economy, while corporates are well placed to ride the recovery in 2021, in our view.
• EM high yield (HY) bonds
Some flows from cross-over investors find their way into EM high yield bonds, where spreads are still dislocated vis-à-vis historical levels due to the events of 2020. EM HY spreads remain particularly attractive versus IG spreads for those who can access lower rated credit. Sovereign HY bonds in EM currently pay about 625bps spreads over US Treasuries of similar duration, which is the widest level since 2016 (excluding the brief peak in spreads in March 2020). This is an attractive spread given that most of the countries that went through the 2020 shocks with weak balance sheets have either restructured (Ecuador and Argentina) or defaulted on their debts (Lebanon and Zambia). The debt restructuring in Ecuador and Argentina have resulted in postponement of principal and coupon payments so that these countries have virtually nothing to pay in debt service on commercial bonds until 2022, making it extremely unlikely that they will face debt repayment challenges over the short term. In the case of Lebanon and Zambia, situations remain unresolved, but their bonds already trade at extremely distressed levels, which lowers the risk of further sharp sell-offs. Of course, there are other EM countries with poor balance sheets that are not doing enough reforms to avoid a debt restructuring, such as Sri Lanka. However, these countries represent a very small part of the EM debt universe, so their particular challenges are not likely to derail the performance of the asset class, which now counts a total of 73 individual sovereign index members.
In the corporate HY space, bonds pay 510bps in spread over US Treasuries of similar duration. In spite of all the government support of corporates in the US, defaults rates for US HY are currently around twice as high as the default rate for EM HY corporates, according to data from Bank of America Merrill Lynch. We expect EM corporate default rates to reduce significantly in 2021 given the improved commodity price backdrop. This, in our view, means that EM HY offers a superior investment proposition.
Conclusion
• Looking into 2021, the arrival of multiple vaccines amount to an important shot in the arm for investor confidence. Normalisation is now possible, even likely.
• The global economy looks set to experience a ‘V-shaped’ recovery as DM economies maintain expansionary fiscal and monetary policies for longer in a bid to drive down the unemployment rate quickly.
• This effort will prove particularly important in the US, where inequality has reached staggering levels. Combined with the large twin deficit, the Dollar is likely to be for sale in 2021.
• The weak Dollar in turn implies inflows to EM, which should boost both growth rates and asset price returns.
Appendix
Are debt ratios sustainable?
Most EM countries were able to cut policy rates to unprecedented low levels in 2020. Many EM governments were able to pursue counter-cyclical fiscal policies for the first time in the context of a global crisis. Lower domestic rates significantly lowered debt service obligations. Moreover, despite the sell-off in EM currencies and the negative investor sentiment towards EM, none of the major EM economies experienced balance of payment crises of any kind. This resilience in the consequence of very sharply improved current account balances, generally prudent macroeconomic policies, low levels of external debt, and deliberate policies to achieve self-reliance in financial terms, mainly via the development of local bond markets. As the major EM countries now get more than 80% of their financing from local sources, currency depreciation no longer triggers non-linear increases in local interest rates and destabilising spikes in debt service costs.
Having said that, no country can expand the stock of government debt without limitation. In 2021, it is likely that many EM economies will engage in some moderate re-tightening of fiscal policies in order to ensure that debt levels remain sustainable. In contrast, many economists still believe that debt ratios can rise without limit in DMs. This may be a convenient view for DM countries already saddled with record high levels of debt and asset prices that are so high that central banks have become de facto hostages to their own policies. But what matters for debt sustainability is not current growth rates and current interest rates, but rather future expected growth and the future path of interest rates. The private sector can be expected to react in real time to changes in expectations of future developments. That is why, in spite of record low bond yields, DM governments cannot rest easy and simply count on increasing their debt levels forever. When investors start to fear higher taxes or rising inflation the cost of funding will most likely increase due to capital flight. DM central banks will undoubtedly find ways to cap the yields of long dated bonds, for example by committing to buying unlimited amount of paper to defend a specific level of yield, but the problem with this policy is that it is only credible if backed by strong fiscal policies, which are not in place. In the absence of a solid fiscal anchor, the escape valve is a large and possibly disorderly currency depreciation.