The Emerging Markets (EM) asset class is often labelled a commodity play for investment purposes. The argument is simple and directional; EM countries export commodities, so rising commodity prices are good for the asset class, whereas falling commodity prices hurt EM countries.
This report challenges the view that EM is a simple directional play on commodity prices. Analysis of commodity sensitivity in 114 EM countries and 36 Developed Market (DM) countries shows that while commodities matter more to EMs than to DMs, they do so in ways that are far more nuanced than has hitherto been recognised.
Specifically, extreme sensitivity to commodities is confined to a relatively small number of EM countries, while the overwhelming majority of countries either have balanced trade in commodities or highly diversified exposures, which render them immune to large commodity price shocks. It is therefore unwise to treat individual EM regions as simple commodity plays, let alone EM as a whole.
In light of the extreme variation in sensitivity to commodities in EM, the better way is to establish commodity profiles for individual EM countries and use them as inputs in investment analysis exactly as one would do with other unique, country-specific macroeconomic variables, such as debt to GDP, inflation, domestic politics, and economic growth.
1. Why pay special attention to commodities?
By dint of their smaller and less developed services and manufacturing sectors, primary commodities naturally matter more to EM countries than to DMs. Greater reliance on commodities confers a unique quality to EM countries, because commodity prices are more volatile than the prices of services and manufactures. Since price volatility impacts both imports and exports, it is a country’s net commodity exposure that determines its overall sensitivity to commodities from a macroeconomic perspective.1 Countries with positive net commodity exports benefit from rising commodity prices, while countries with negative net commodity exports – or net commodity importers – gain when prices fall, all else even.
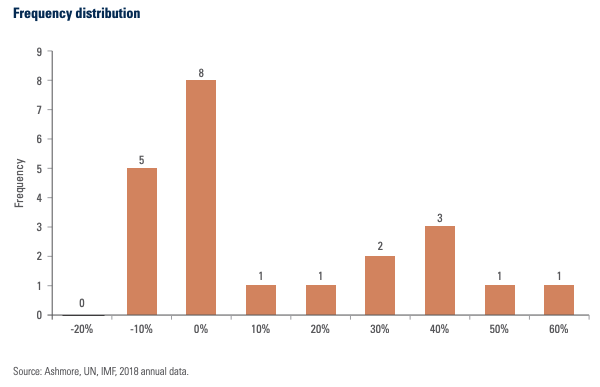
The perception of EM as a directional commodity play rests on an implicit – and rarely tested – assumption that most if not all EM countries are net commodity exporters. Yet, the distribution of countries in terms of their commodity sensitivity (net commodity exports to GDP) is far from normal as shown in Figure 1.2 In addition to the pronounced right skew, the distribution appears to show a very large number of countries with small or no commodity sensitivity at all. This variety is also consistent with anecdotal observations that suggest that EM economies differ greatly in terms of the sizes of their commodity sectors and trade balances as well as the types of commodities they produce and consume. In short, there are strong a priori reasons for suspecting that commodity prices to impact EM countries very differently.
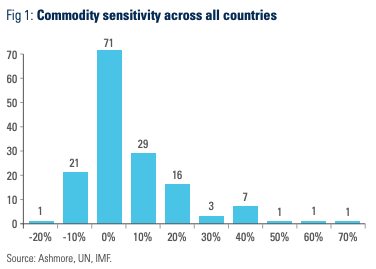
The key empirical question is: how differently?
The rest of this report seeks to answer this question. Section 2 reviews the broad regional averages of commodity sensitivity that typically inform the view that EM countries are commodity plays. Section 3 then tests this view at intra-regional level, finding that intra-regional variation is enormous and that a relatively small number of countries with very large net commodity exposure tend to distort the regional averages. Since countries with very large net commodity exposures also happen to be very interesting from an investment perspective, Section 4 of the report examines these countries in particular. This is followed by a Conclusion, which summarises the main findings of the report.
2.The Big Picture
This section presents broad aggregate measures of commodity sensitivity by region; EM versus DM and the main EM regions. The findings lend strong support to the commonly voiced thesis of EM countries as commodity plays. Specifically:
• EM is a net commodity exporter to the tune of 2.6% of GDP, while DM is a net commodity importer to the tune of 1.6% of GDP
• Commodities accounts for 44% of EM trade compared to just 29% in DMs
• Eastern Europe is a net commodity importer and Asia & Pacific has balanced trade in commodities, but Latin America & Caribbean, Sub-Saharan Africa, and Middle East & North Africa are significant net commodity exporters in rising order of magnitude.
The rest of this section provides a more detailed examination of the data behind these conclusions. Readers, who are not interested in this additional level of detail can skip to Section 3 on intra-regional variation in EM commodity sensitivity.
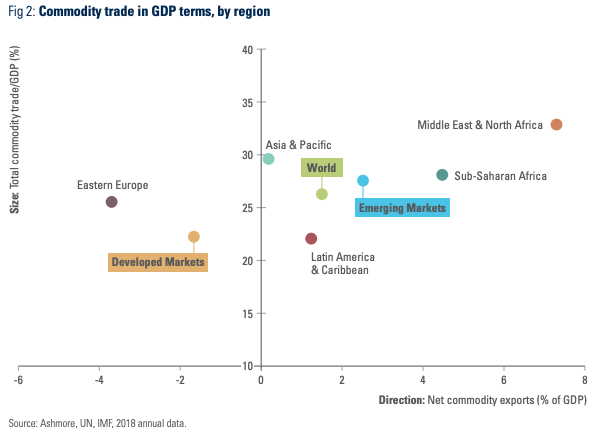
At 26% of global GDP, commodities are a significant part of the world economy. DM is a small net commodity importer to the tune of 1.6% of GDP, while EM as a group is a modestly sized net commodity exporter of 2.6% of GDP. Figure 2 presents a visual depiction of commodity sensitivity by region with commodity trade as a share of GDP on the vertical axis and net commodity exports in GDP terms on the horizontal axis. Commodity trade as a share of GDP sits within a range from 20% to 35%, but there is considerably more variety in terms of commodity trade balances. Eastern Europe is a net commodity importer, trade in commodities is close to balance in Asia & Pacific countries, while Latin America & Caribbean, Sub-Saharan Africa, and Middle East & North Africa are net commodity exporters in rising order of magnitude. It is clear, therefore, that even at this very high level of aggregation there is considerable variety in commodity sensitivity within EM.
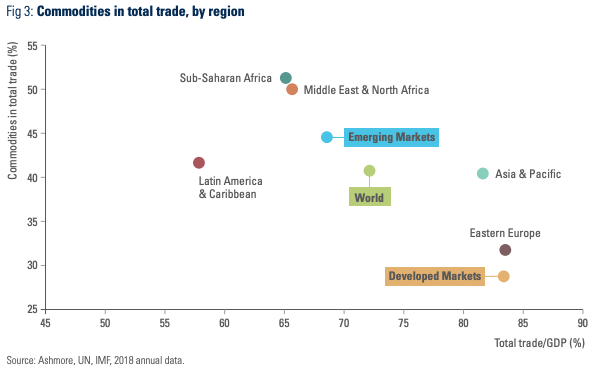
Trade makes up 72% of global GDP and commodities alone account for a meaningful 41% of global trade.3 Commodities make up 44% of all EM trade compared to 29% in DM, albeit with considerable variation across EM regions (Figure 3). The share of commodities in total trade within EM varies from 32% in Eastern Europe to 51% in Sub-Saharan Africa (vertical axis). There is also large variation in overall openness to trade (horizontal axis).4 Asia & Pacific and Eastern Europe trade far more as a share of GDP than Sub-Saharan Africa and Middle East & North Africa, while Latin America & Caribbean is the least open to trade region in the world. Greater openness to trade is generally associated with faster growth and greater resilience to shocks.
3. Intra-regional commodity profiles
Broad regional averages cut across very large numbers of countries that import and export different types of commodities in very different quantities, both in absolute terms and relative to their GDP. This need not pose any problem as long as the underlying countries are distributed normally within the group. Broad averages become a problem, however, in the presence of outliers, which can distort averages to the point where they cease to be representative. As shown in Section 1, there are reasons to suspect outliers across a range of countries as diverse as EM. To test this hypothesis and to evaluate the importance of the outlier problem, this section examines the intra-regional distribution of EM countries with respect to their commodity sensitivities across the five major EM regions.
The analysis lends strong support to the view that broad regional averages are inappropriate as measures of commodity sensitivity at country level in EM, because:
• Commodity sensitivity is surprisingly low in the majority of EM countries
• A relatively small number of outliers strongly influence regional estimates of commodity sensitivity in most EM regions
• EM regions have distinct distributions of commodity sensitivity:
– Bimodal and right skewed in Latin America & Caribbean
– Normally distributed in Sub-Saharan Africa except for eight extreme outliers
– Highly distorted by just four outliers in Asia & Pacific
– Light-tailed with negative average net commodity trade balance in Eastern Europe
– Extremely fat-tailed with large subset of commodity insensitive countries in Middle East & North Africa.
The rest of this section delves into the detail that supports these conclusions. Those not interested in this level of detail can skip to Section 4 on the most commodity sensitive EM countries.
a. Latin America & Caribbean
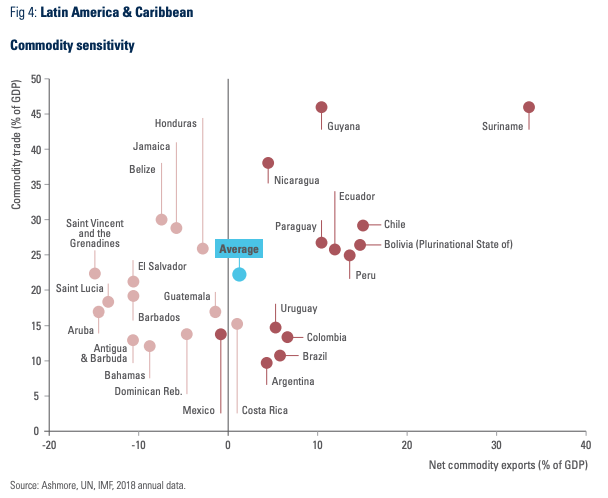
There is huge intra-regional variation in commodity sensitivity among the twenty-six Latin America & Caribbean countries as shown in Figure 4.
The appearance of low commodity sensitivity for the region based on the average is highly misleading, because the group is in fact split right down the middle with one half sizeable net commodity importers and the other half even larger net commodity exporters.
The split neatly divides Caribbean and Central American net commodity importers from mainly net commodity exporting countries in continental Latin America.5 The fact that the largest outliers are on export side means that the distribution has fat tails and a distinct skew to the right.
Some seven countries have net commodity exports in excess of 10% of GDP, while six countries have net imports above this threshold, while the majority of countries clustered relatively close to the mean.
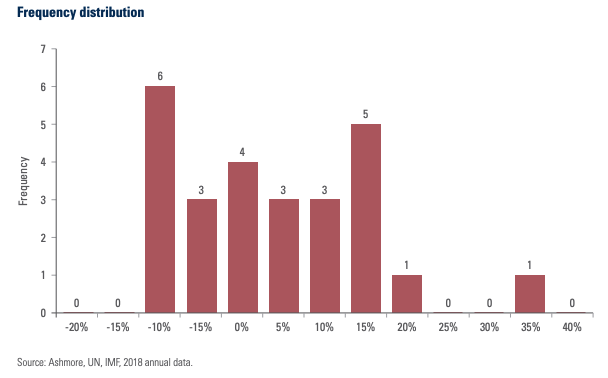
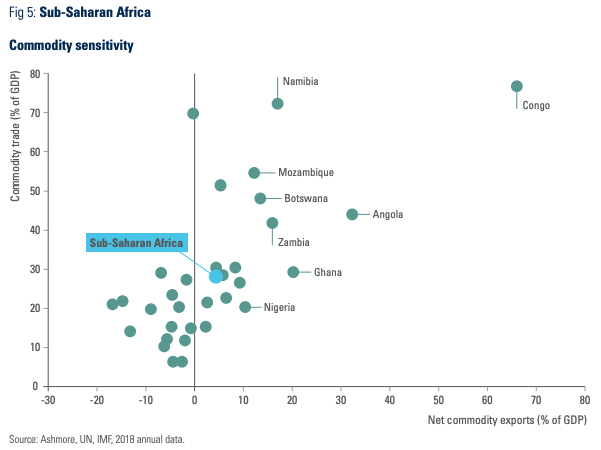
b. Sub-Saharan Africa
The thirty three Sub-Saharan African countries in the sample have important similarities. They are relatively undiversified economies with small manufacturing sectors, large non-tradeable semisubsistence sectors, and low per capita income. On average, they export commodities worth 17% of GDP and import commodities with 12% of GDP of commodities, so their net commodity exports are 5% of GDP, on average. This is the second highest commodity trade imbalance in EM after Middle East & North Africa. Yet, the really big imbalances in commodity trade that account for the region’s unbalanced trade overall are due to the eight named net commodity exporters in Figure 5 without which the region’s commodity exposure is actually remarkably balanced. This can be seen from the frequency distribution, which shows that most Sub-Saharan African countries are clustered around the mean and produces a median net commodity trade balance for the region of 0% of GDP. In other words, contrary to popular perception most Sub-Saharan African countries will not be severely impacted by generalised movements in commodity prices.
There is also variation within the eight outliers. For example, Mozambique and Ghana trade broad ranges of commodities spanning agriculture, minerals & ores as well as fuels, with meaningful volumes in each. This gives them some protection through diversification. It is therefore the remaining six outliers – Congo, Namibia, Angola, Nigeria, Zambia, and Botswana – that genuinely shift the regional average. Jointly, these six countries make up just only 4% of EM GDP.
c. Asia & Pacific
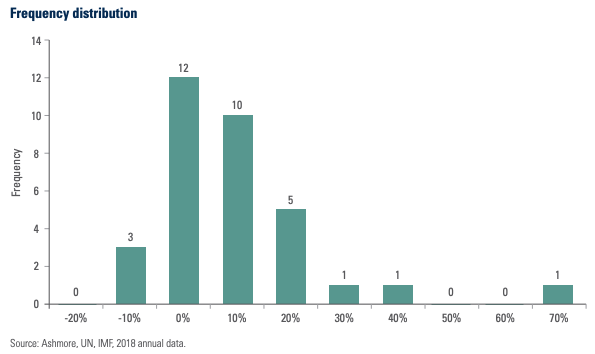
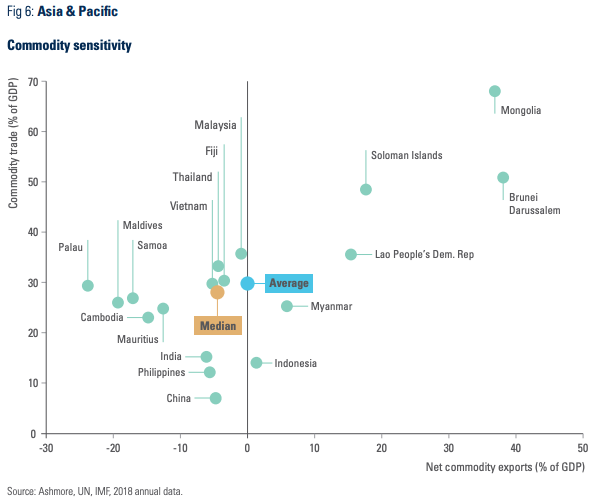
The eighteen nations in the Asia & Pacific region have average net commodity exports to GDP close to 0%, but the median commodity trade balance is -4% of GDP, i.e. the region is predominantly a net importer.
The large discrepancy between mean and median is due to just four outliers – Mongolia, Brunei, Laos, and Solomon Islands, whose net commodity exports range between 20% and 40% (Figure 6).6
Commodity exposure in the rest of the region is mostly in low single digits as a percentage of GDP, so the region is relatively commodity insensitive, aside from the outliers, that is.
d. Eastern Europe
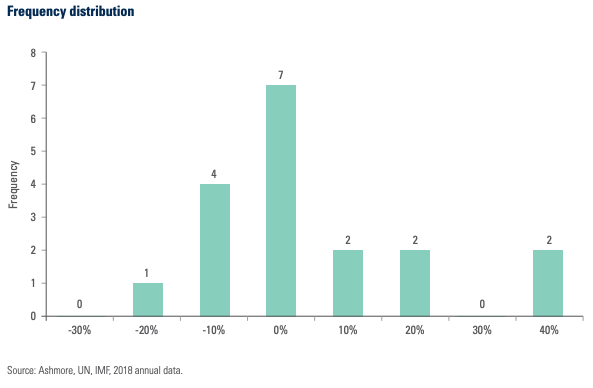
The intra-regional distribution of Eastern European countries in terms of commodity sensitivity is extremely light-tailed. Uniquely in EM, Eastern Europe is a net commodity importer on average.
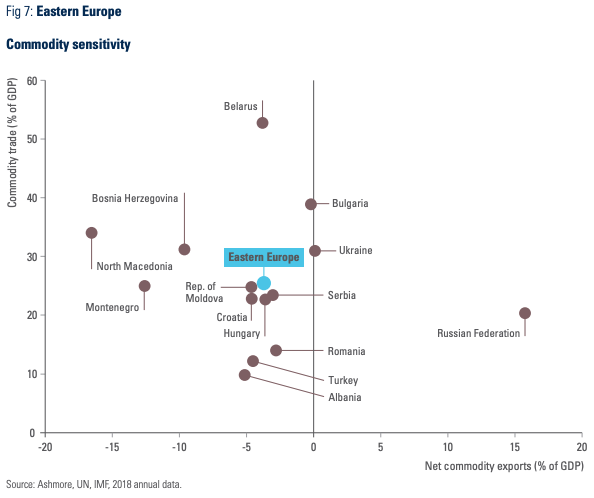
It also has more outliers with very large net imports (2) than with large net exports (1). All fifteen countries in the region are net commodity importers with the sole exception of Russia, whose net commodity trade balance is +16% of GDP (Figure 7).
On the import side, North Macedonia and Montenegro stand out by dint of their large net imports of raw minerals & ores and agricultural raw materials, respectively. Ukraine and Belarus are also interesting. Their exports and imports are broadly balanced, but both countries export large quantities of agricultural commodities and import large quantities of raw fuel, so if the prices of agricultural commodities and crude oil part ways then both countries find themselves in a predicament (either positive or negative depending on the direction of relative prices).
e. Middle East & North Africa
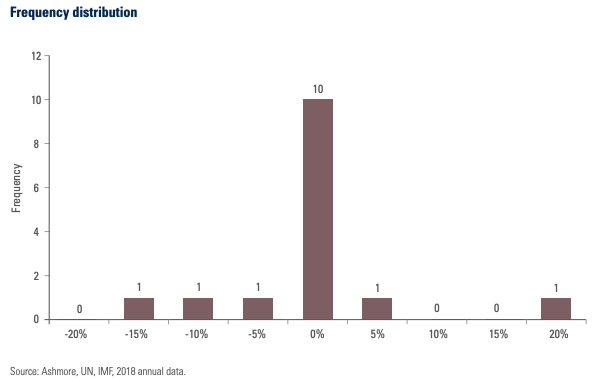
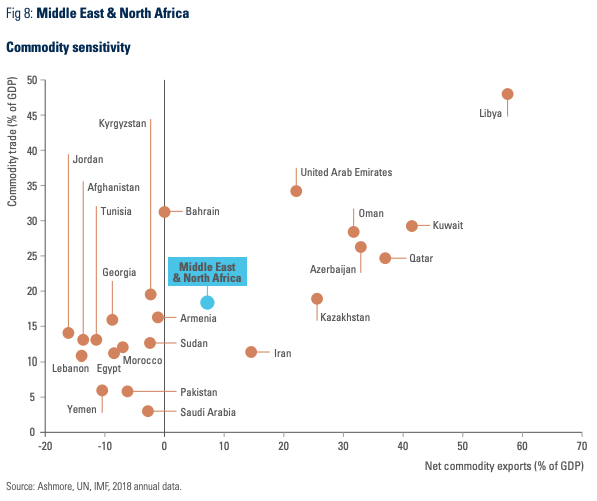
The twenty two countries in the Middle East & North Africa include some of the most commodity sensitive countries in the world. Yet, once again, the variation in commodity sensitivity within the region is extreme, resulting in a far from normal and quite distinct distribution compared to other regions.
As Figure 8 shows, the region produces a long and fat tail in the right side of the distribution due to the large number of big oil exporters, but at the same time there is an even larger segment of countries in the region that have very low net commodity sensitivity. These countries are predominantly net commodity importers and they most closely resemble the commodity profiles of Eastern European countries.
The distribution of commodity sensitivity in the Middle East & North Africa region is so extreme that a further breakdown of the data is insightful.
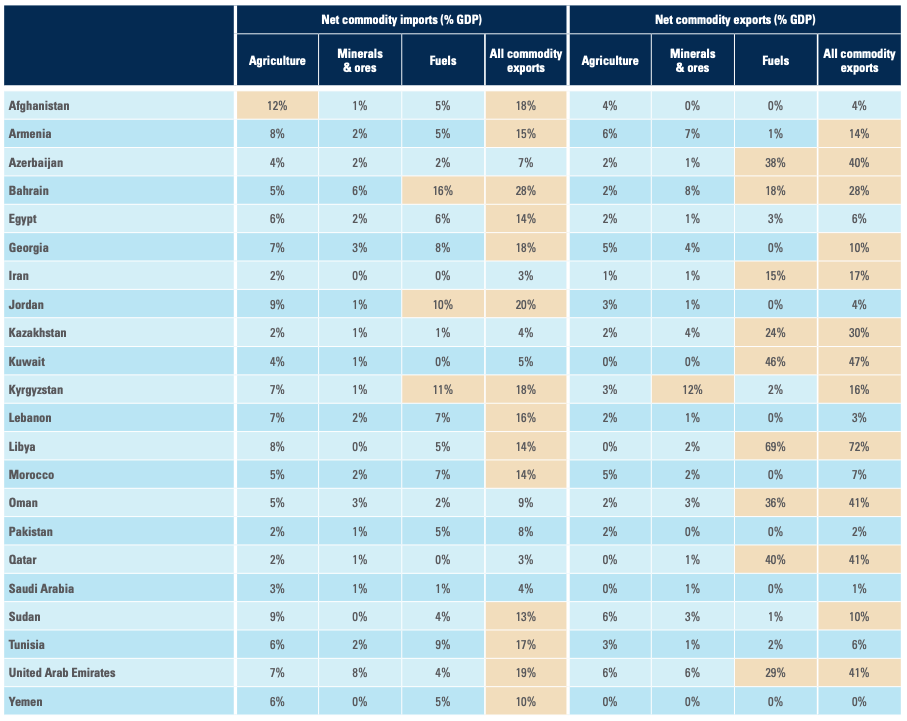
Figure 9 is a decomposition of the individual countries’ net commodity imports and exports by broad commodity type. Yellow fields denote net trade imbalances in excess of 10% of GDP. There are clearly relatively few major net imbalances across commodity types on the import side with only three countries standing out from the rest (Afghanistan, Kyrgyzstan, and Bahrain).
By contrast, there is a very large number of large imbalances on the export side due to heavy concentrations in raw fuels. No fewer than nine countries export more than 10% of GDP in fuel alone and the average net fuel export for these nine countries exceeds 33% of GDP.7
Kyrgyzstan stands out as a lone specialist net minerals & ores exporter in the region.
4.The most highly commodity sensitive EM countries
The previous section established that there are significant numbers of outliers in terms of commodity sensitivity in most regions and that they distort regional averages.
This section focuses exclusively on the outliers. Thresholds for commodity sensitivity are necessarily arbitrary. For the purpose of this analysis, a country is deemed to be commodity sensitive if its net commodity trade balance is equal to or exceeds 10% of GDP. This threshold implies that a generalised 10% swing in commodity prices shifts GDP by 1%.
Figure 10 shows how the outliers are distributed across the globe. A total of 49 EM countries are outliers, or 43% of the total sample.8
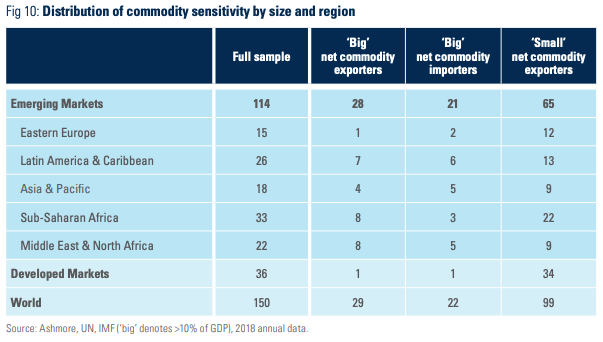
Despite the fact that this is quite a large number, it is difficult to support a broad conclusion that EM is a directional commodity play for three specific reasons:
1. No fewer than 65 EM countries, or 55% of the total sample, are not prone to significant commodity shocks at all.
2. Commodity sensitivity goes in both directions with 21 of outliers (43% of the total) being net commodity importers.
3. There are large differences in the composition and size of commodity sensitivity even among the outliers.
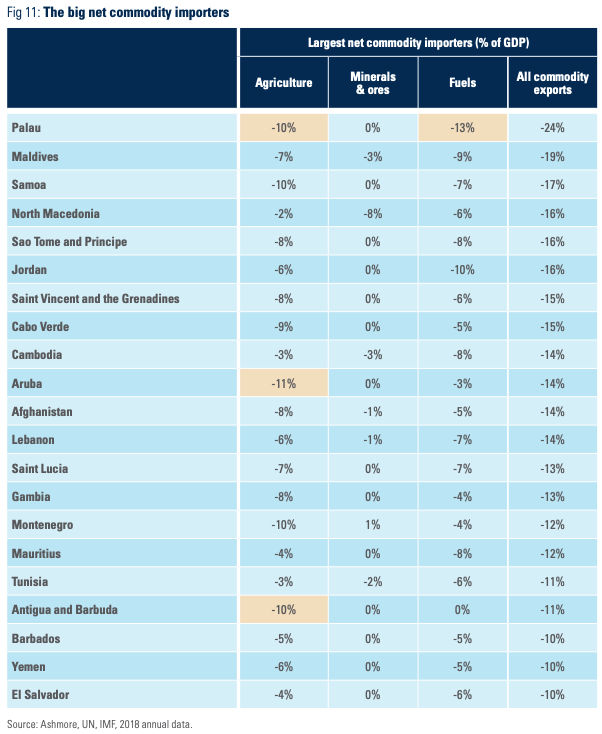
The importance of the last point can be illustrated with a closer examination of net export and import outliers, starting the importers. The twenty-one outliers on the import side are listed in Figure 11, complete with their respective specialisations across commodity types. Yellow denotes trade imbalance in excess of 10% of GDP. Mean and median are identical (14% of GDP) and the range is 10% of GDP (El Salvador) to 24% of GDP (Palau). Twelve countries are large agricultural goods importers, while eight import fuels. Only one imports minerals & ores in size.
It is particularly notable that a proportion of the import outliers are smaller countries and island states, many of which export tourism and import fuel and food. The commodity profiles of these small countries are often diametrically opposite to those of the larger countries within their regions.
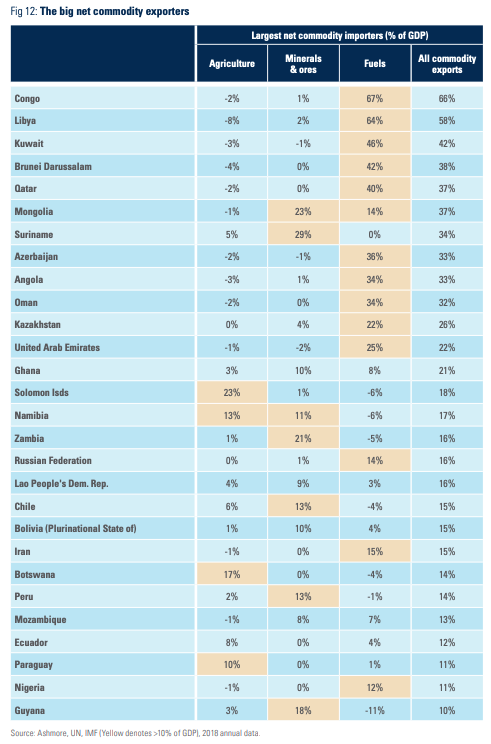
The twenty-eight export outliers in EM are listed in Figure 12. The size of their net commodity exports is 25% of GDP, which is five times larger than the EM average and nearly twice as large as the average for the import outliers. The range is also much wider from 10% of GDP in Guyana to 66% of GDP in the Republic of Congo.
Different regions of EM are very different in terms of how many outliers they have. Only 7% of countries in Eastern Europe feature among the outliers compared to 36% of Middle East & North African countries. Indeed, specialisation in raw fuels is very closely associated with export commodity sensitivity, probably due to the tendency for fuel exporters to experience strong so-called ‘Dutch Disease’ effects, which wipe out other exports.9
No fewer than thirteen countries – just shy of half of the total sample – are raw fuel exporters. Another ten exporters mainly minerals & ores, while only five countries are principally exporters of agricultural goods.
The considerable variation even among outliers in terms of the type of commodities they export/import further undermines the thesis that EM is a simple directional commodity play. After all, a positive shock in the price of:
• Oil only meaningfully impacts 13 countries, or 11% of EM. Simultaneously, eight large net oil importing EM countries (7% of EM) will be impacted, but in the diametrically opposite direction.
• Minerals & ores only impacts 10 countries on the export side (8.8% of EM countries) and just one country on the import side (0.8% of EM).
• Agriculture hits just five countries on the export side (4.4% of EM) and 12 countries on the import side (10.5% of EM countries).
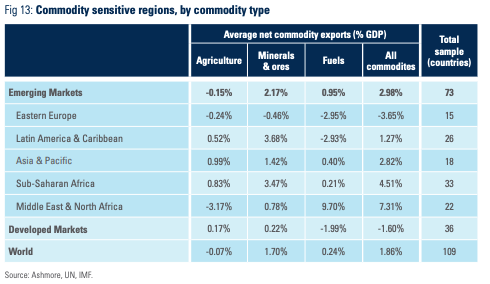
The considerable diversification in commodity specialisation in both exports and imports – a few notable exceptions such as Middle East & North African exporters – obviously helps to dilute the sensitivity to shocks in any particular commodity type at regional level. This is illustrated in Figure 13, which shows that not a single region of EM reaches the 10% of GDP threshold for commodity sensitivity with respect to movements in individual commodity prices. Only the Middle East & North Africa comes close with 9.7% net commodity sensitivity to shocks in fuel prices. All other regions have average net exposures below 4% of GDP with respect to shocks in specific commodity prices.
5.Conclusion
EM is no longer a directional play on commodities. More than half of EM countries do not trade commodities in sufficient size to experience meaningful commodity shocks. Nearly as many are net commodity importers as net commodity exporters. Most importantly, the broad regional averages are heavily distorted by the presence of outliers, which themselves are highly varied in terms of their commodity specialisation.
The rich diversity across EM in terms of commodity sensitivity means that individual countries respond to changes in commodity prices in unique ways. As such, it makes no sense to treat them all as the same. It is not even wise to think of EM regions as simple commodity plays. This has two implications. First, the practice viewing commodity risk in EM as something that cuts across all EM countries indiscriminately should be ditched. Second, investors should instead use the unique commodity profiles of individual EM countries as inputs in investment analysis exactly like they use other country-specific macroeconomic indicators, such as debt to GDP ratios, inflation rates, domestic politics, and economic growth.
Yet, a country’s commodity profiles only takes you so far. Ultimately, it is the countries’ institutional capacity to manage commodity shocks that matters most to investment outcomes. A country that has access to global financial markets will typically perform better during a transitory collapse in commodity prices than one that gets cut off from global finance. Similarly, countries that are better at stewarding the windfall associated with large temporary commodity booms are more likely to perform better over the cycle.10
Appendix: Data and measurement issues
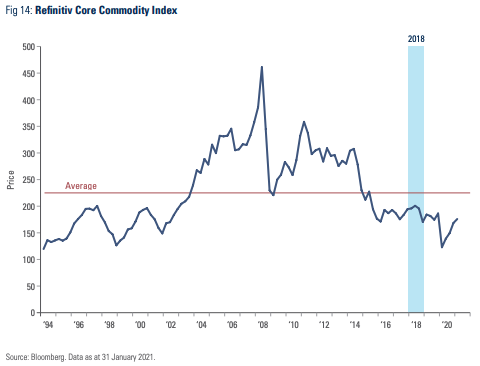
Commodity prices are volatile. Supply of commodities is subject to major disruptions due to weather, cartel activity, and inventory effects, while demand for commodities can move sharply with the business cycle. Analyses of commodities are therefore often undertaken using data for many years to smooth out the frequent cycles. An alternative approach is to pick a ‘representative’ year, when commodity prices are roughly in line with their long-term averages. The chosen year should be relatively recent, but not so recent that there is not a full set of data available. It is also best to pick a year which does not coincide with major global shocks, such as the Coronavirus Pandemic. The analysis in this paper uses annual data for the year 2018, when broad commodities prices were close to their long term average (Figure 14).
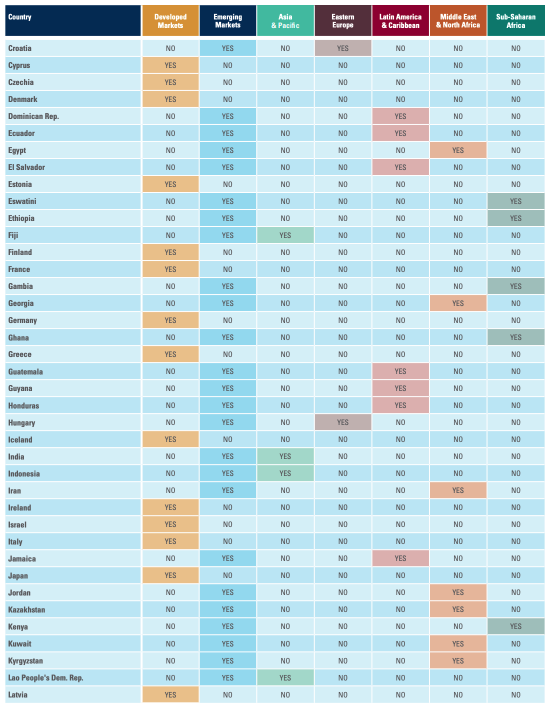
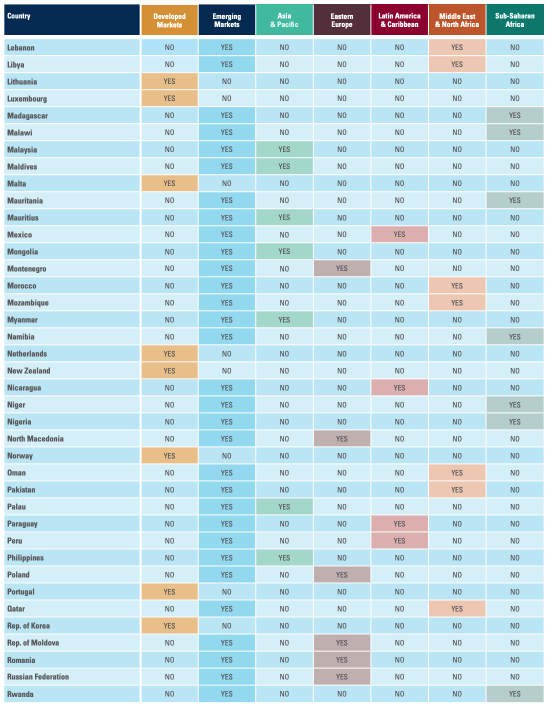
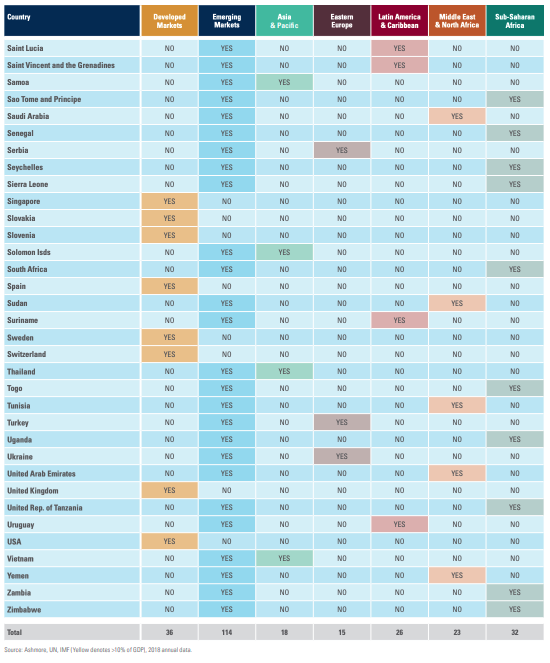
• Commodity profiles are established for 114 EM countries and 36 DMs using United Nations SITC Revision 3 data covering three broad categories of primary commodities, namely agriculture, minerals & ores, and fuels.11
• Data on imports and exports of agricultural commodities, minerals & ores, and fuels comes from the Comtrade database of the United Nations (UN).12
• GDP data is from the October 2020 World Economic Outlook database of the International Monetary Fund (IMF).13
• Data total imports and exports are from IMF’s Direction of Trade Statistics database.14
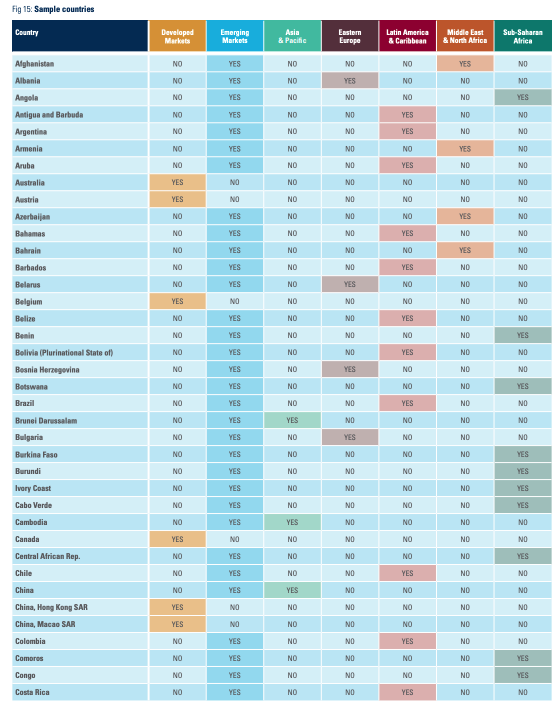
• The EM sample includes 18 Asian & Pacific economies, 15 Eastern European countries, 26 Latin American & Caribbean nations, 22 countries from Middle East & North Africa, and 33 countries from Sub-Saharan Africa.
• The countries are listed in Figure 15 (overleaf; pages 15 - 18).
1 It follows that countries that import and export the same amount of commodities are not impacted by generalised shifts in commodity prices. In reality, this is not strictly true. There will be distributional implications on the demand side and marginal sectoral implications on the supply side, notably between export and exportable sectors as well as import and importable sectors. There will also be intertemporal distributional consequences depending on the duration of the shock. However, this report will mainly focus on first order implications of shocks for growth and trade.
2 The Appendix has information on the data sources and other issues.
3 These considerable differences between countries in terms of their overall openness to trade extends to the size of their commodity sectors relative to GDP. For example, if a country is relatively closed then overall trade is a smaller part of GDP and so it follows that commodity trade – a subset of overall trade – is also smaller in relation to GDP, all else even. Latin America & Caribbean trades 58% of GDP, Sub-Saharan Africa 65% of GDP. This is much less than Asia & Pacific (82%) and the EM average (69%). Low openness to trade partially explains why only one third of Sub-Saharan Africa and half of Latin American & Caribbean countries are classified as commodity sensitive according to the 10% of GDP net commodity export criterion.
4 Unless otherwise specified, ‘total trade’ will refer to export plus imports in this report.
5 This split suggests that investments in Caribbean and Central American countries can be used to hedge investments in continental Latin America from a commodity risk perspective.
6 Brunei’s commodity trade imbalance is due to large oil exports, while Mongolia is a big net mining exporter. Solomon Islands exports a lot of agriculture, while Laos is a large net exporter of a broad range of primary commodities, including agriculture, minerals & ores, and fuels.
7 Note that this sub-group excludes Saudi Arabia whose exports are mainly refined products, so not considered basic commodities.
8 There are only two commodity sensitive DMs; Norway is an outlier on the export side and Malta is an outlier on the import side.
9 The authoritative theory of temporary trade shocks is contained in “Controlled Open Economies: A Neoclassical Approach to Structuralism” by David Bevan, Paul Collier and Jan Willem Gunning (1991), Clarendon Press, Oxford and New York.
10 See: https://openknowledge.worldbank.org/handle/10986/19508
11 All three are primary commodities, that is, unprocessed raw materials. For example, ‘fuels’ refers to gas and crude oil, not refined products, such as petroleum or LNG.
12 Agricultural products comprise SITC codes 0, 1, 2 (less 27 and 28), and 4. Fuels comprise SITC code 3. Ores, metals, precious stones as well as non-monetary gold are captured in SITC codes 27, 28, 667, 68, and 971. All data is based on SITC Revision 3. See: https://unctadstat.unctad.org/en/classifications.html
13 See: https://www.imf.org/en/Publications/WEO/weo-database/2020/October
14 See: https://data.imf.org/regular.aspx?key=61013712

No part of this article may be reproduced in any form, or referred to in any other publication, without the written permission of Ashmore Investment Management Limited © 2021.
Important information: This document is issued by Ashmore Investment Management Limited (‘Ashmore’) which is authorised and regulated by the UK Financial Conduct Authority and which is also, registered under the U.S. Investment Advisors Act. The information and any opinions contained in this document have been compiled in good faith, but no representation or warranty, express or implied, is made as to their accuracy, completeness or correctness. Save to the extent (if any) that exclusion of liability is prohibited by any applicable law or regulation, Ashmore and its respective officers, employees, representatives and agents expressly advise that they shall not be liable in any respect whatsoever for any loss or damage, whether direct, indirect, consequential or otherwise however arising (whether in negligence or otherwise) out of or in connection with the contents of or any omissions from this document. This document does not constitute an offer to sell, purchase, subscribe for or otherwise invest in units or shares of any Fund referred to in this document. The value of any investment in any such Fund may fall as well as rise and investors may not get back the amount originally invested. Past performance is not a reliable indicator of future results. All prospective investors must obtain a copy of the final Scheme Particulars or (if applicable) other offering document relating to the relevant Fund prior to making any decision to invest in any such Fund. This document does not constitute and may not be relied upon as constituting any form of investment advice and prospective investors are advised to ensure that they obtain appropriate independent professional advice before making any investment in any such Fund. Funds are distributed in the United States by Ashmore Investment Management (US) Corporation, a registered broker-dealer and member of FINRA and SIPC.