Measuring EM Stocks’ Undervaluation
Membership required
Membership is now required to use this feature. To learn more:
View Membership BenefitsWhat is the degree of Emerging Markets (EM) stocks’ undervaluation relative to United States (US) equities? This paper compares long-term equity valuations for EM and US stocks using two different models, namely; market capitalisation (market cap) to gross domestic product (GDP); and by comparing current equity valuations to earnings growth. We analyse EM equities in aggregate and by country (focusing on the largest eight markets). The overarching conclusion is that EM equities are deeply undervalued compared to US equities, a result which is robust across different methods, both trading at the most attractive relative valuation levels for over 15 years. There is also significant dispersion between markets leading to excellent opportunities for active managers.
Stock valuations compared to the size of the economy: The ‘Buffett model’
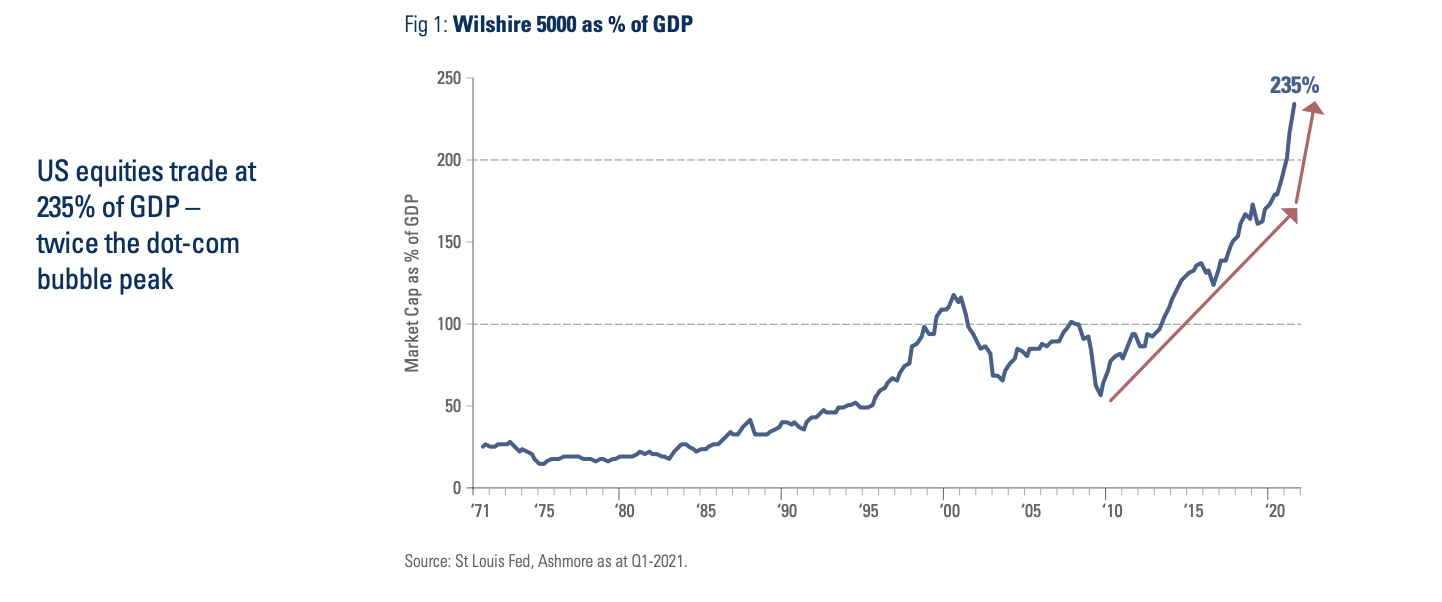
In 2001, Warren Buffett said that the ratio of stock market capitalisation to nominal gross domestic product (GDP) was “probably the best single measure of where valuations stand at any given moment”. This valuation metric has returned to prominence as market participants question record high US stock valuations. Indeed, Warren Buffett has described the recent spike in the ‘Buffett ratio’ to above 200% as a “very strong warning signal of a future market crash” (Figure 1). Figure 1 shows the ratio of the broad Wilshire 5000 stock market index to US GDP, which stands at 235%. This is the highest level in 50 years and more than twice the peaks achieved in Q1 2000 and Q1 2007. In other words, market participants are trading US companies at close to 2.5x the size of the US economy.
How did we get here?
The ratio of market cap to GDP has been increasing consistently from the early 1980s as macroeconomic stability paved the way for earnings expansion above that of inflation. Lower cost of production of goods thanks to globalisation and increased automation have also supported the rise of profit margins and the value of listed companies.
The ‘Buffett ratio’ peaked in Q1 2000, just before the dot-com bubble burst, at 118% of GDP. From there, the ratio declined by half to 65% in Q1 2003, the second lowest level over the last 20 years, which was only exceeded by a decline to 47% in Q3 2009 in the wake of the housing market crash at the time. Since 2010, market cap to GDP has relentlessly increased, aside from modest corrections in 2011, 2015, and 2018, reaching 179% in Q4 2019 and then accelerating to the current high of 235% as of Q1 2021.
The unprecedented increase in the ‘Buffett ratio’ since 2009 began at the same time as the Federal Reserve (Fed) quantitative easing (QE) policy. The Fed’s balance sheet increased by USD 3.6trn from June 2008 to December 2014, equivalent to 19.5% of GDP in 5.5 years. During the current QE cycle, the Fed’s balance sheet expanded by USD 4.1trn or 18% of GDP in just 1.5 years (February 2020 to July 2021). The enormous amount of liquidity injected into the system depressed interest rates below natural levels, which in effect leads to artificially higher asset prices in other markets.
Artificially low interest rates mean investors become unusually comfortable with low long-term expected returns in their portfolio and aggressively pay up for companies with a solid growth profile, even if their business models are not profitable. Furthermore, since the bail out of the hedge fund Long Term Capital Management (LTCM) in 1998 and following the disastrous effects of the Lehman Brothers default in 2008, market participants became convinced that the Fed would not allow for a significant market correction without intervening (the so-called Greenspan-put). The Greenspan-put has since become market participants’ expectations, morphing into the Bernanke, Yellen and finally Powell-put.
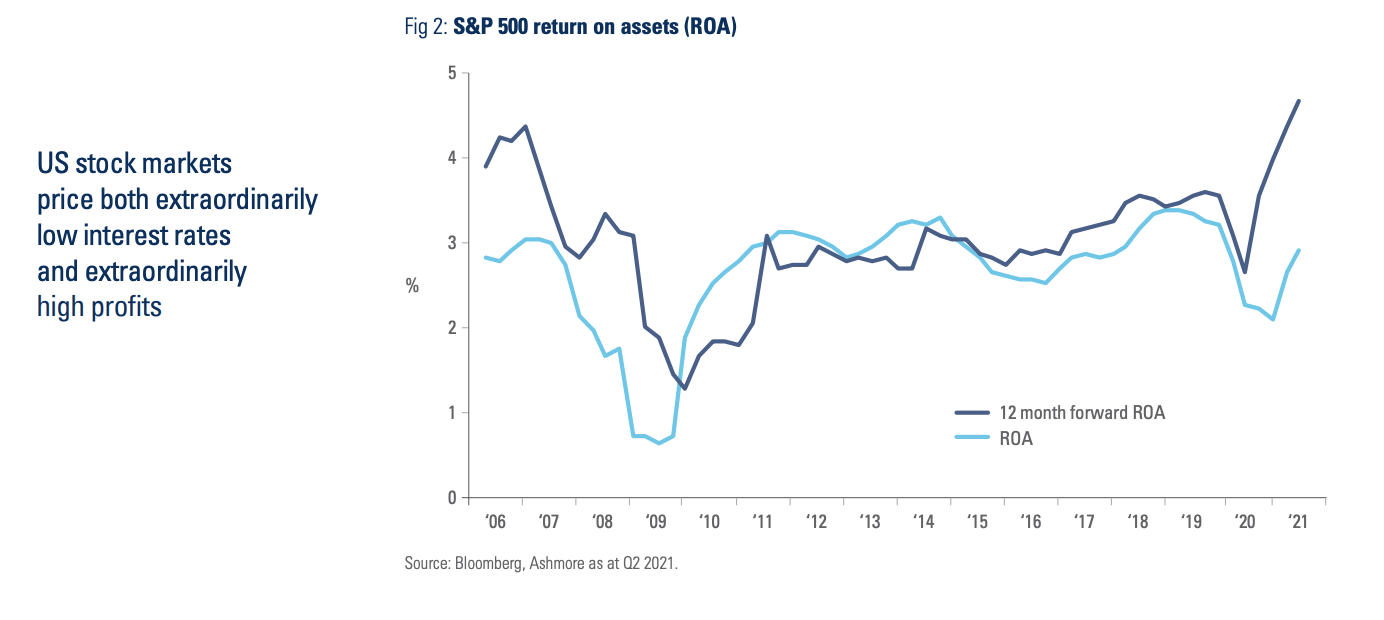
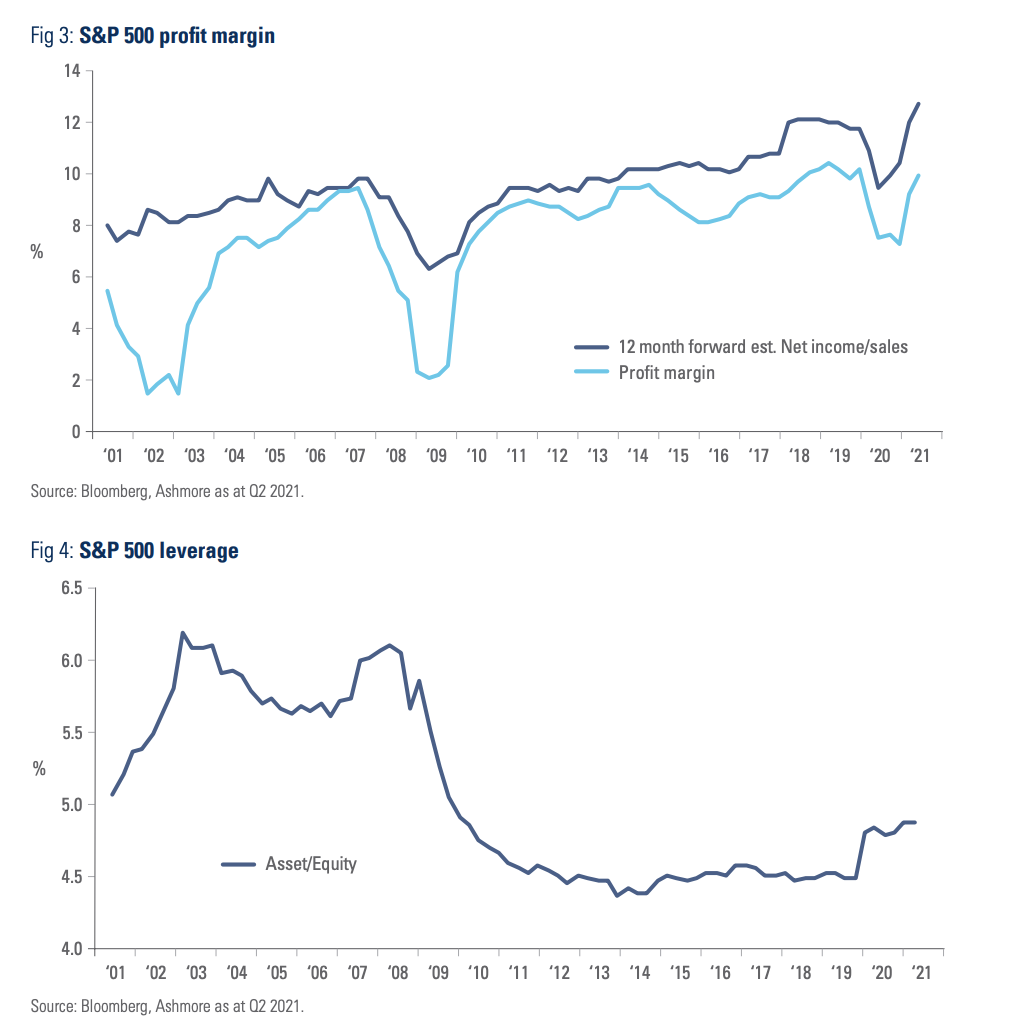
Indeed, stock market valuations now incorporate both interest rates remaining low for an extended period of time alongside either an assumption of significant future economic growth, or an assumption that companies will be able to maintain very high levels of profitability for longer. DuPont analysis that decomposes the different drivers of return on equity (ROE) of the S&P 500 index points to extraordinary expectations of future profits. Figures 2, 3, and 4 depict the 12-month forward estimates of return on assets and profit margins, which are both at their highest levels in 20 years, aided in part by a marginal pick-up in leverage after the Covid-19 recession.
Price to earnings
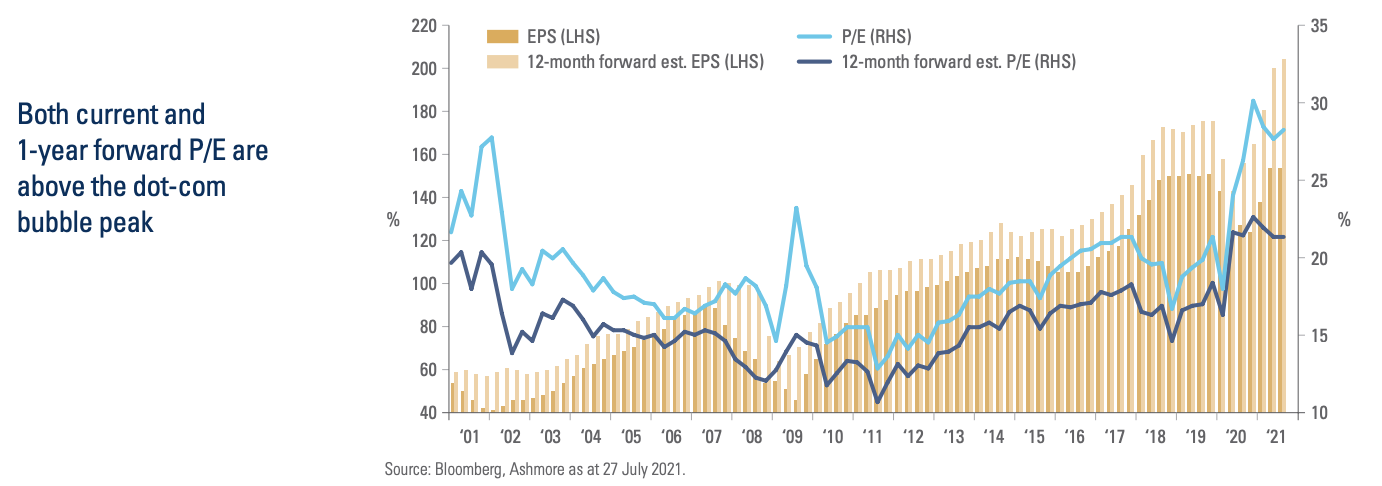
Of course, the market may be right that companies will be able to extract higher than average earnings in the future, justifying the current elevated valuations. Figure 5 shows that earnings growth has been solid over the last two decades with earnings per share (EPS) rising from USD 41 in 2002 to USD 151 by 2019, before declining due to the Covid-19 recession.1 However, despite the impressive earnings expansion both current and 1-year forward price-to-earnings (P/E) ratios are now higher than at the peak of the Dotcom Bubble in 2001. In other words, equity valuations appear excessive even after factoring in the strong earnings growth of the last twenty years.
The Buffett Indicator in Emerging Markets
We applied the same ‘Buffett ratio’ calculation to all EM countries using data from the World Federation of Exchanges and national stock exchanges, weighting market cap to GDP for each country by its historical weight in the MSCI EM stock market index to obtain an EM aggregate estimate of market cap to GDP.
In absolute terms, EM valuations look somewhat elevated at 124% of GDP in Q1 2021. This followed a strong bounce from 78% in Q1 2020, a low point since 2011. Similar to the US, the ratio has been distorted by the deep GDP contraction in 2020, which depressed the denominator of the ‘Buffett ratio’, while rapid earnings expansion in 2021 pushed the numerator higher. Furthermore, EM GDP growth, excluding China and Taiwan, has been running below potential for almost a decade, as capital was attracted to the US at EM’s expense considering US quantitative easing policies led to a strong Dollar, among other factors. A prolonged bear market in commodity prices also weighed on growth rates in commodity-exporting countries, forcing a macroeconomic adjustment that included running smaller fiscal deficits and raising interest rates in order to return their external balances to equilibrium.
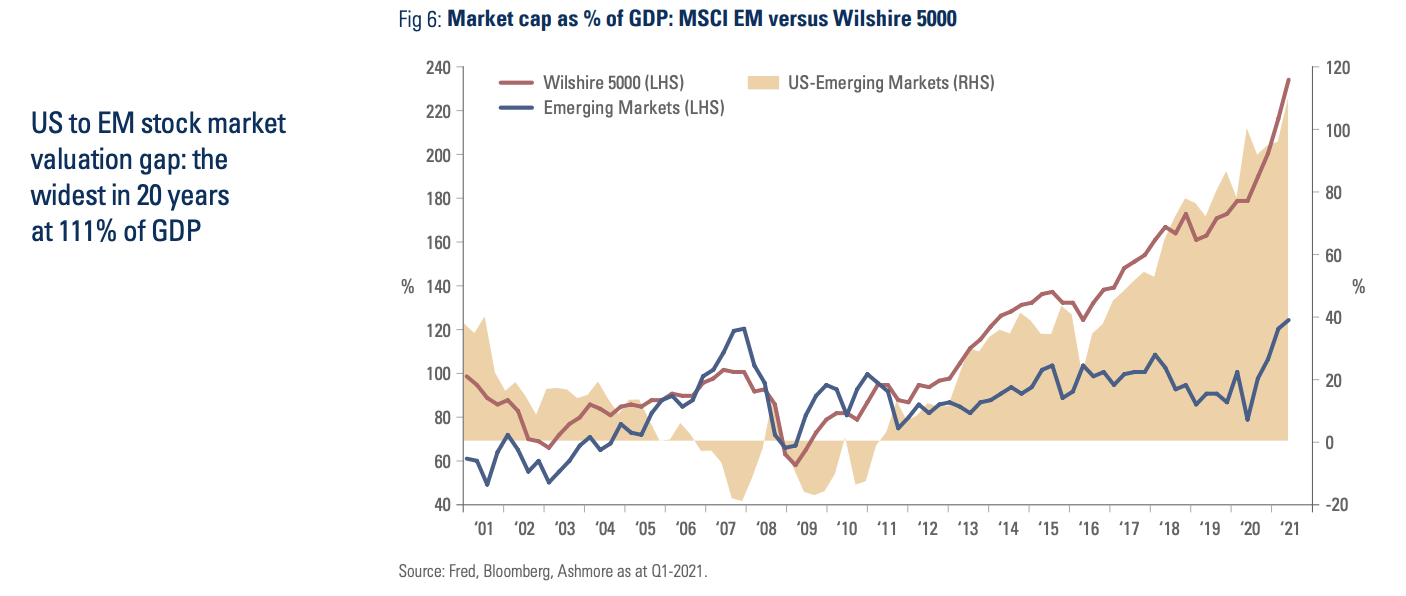
Nevertheless, several factors suggest GDP growth is set to accelerate in EM, both in absolute terms and relative to developed economies, which will support valuations.2 For one, commodity prices are higher, which supports profits, investment, and consumption growth across EM exporters. Second, the ongoing global economic recovery is keeping the demand for other tradable goods higher, which supports economies, especially in Asia. Thirdly, the services sector is far from having normalised yet. The faster pace of vaccinations across most EM countries will allow for a relatively faster recovery in service sectors, including tourism receipts, and the domestic economies more broadly. Notably in relative terms, the gap between EM and US stock markets valuations stands at the widest level in 20 years at 111% of GDP as at Q1 2021. This is illustrated in Figure 6.
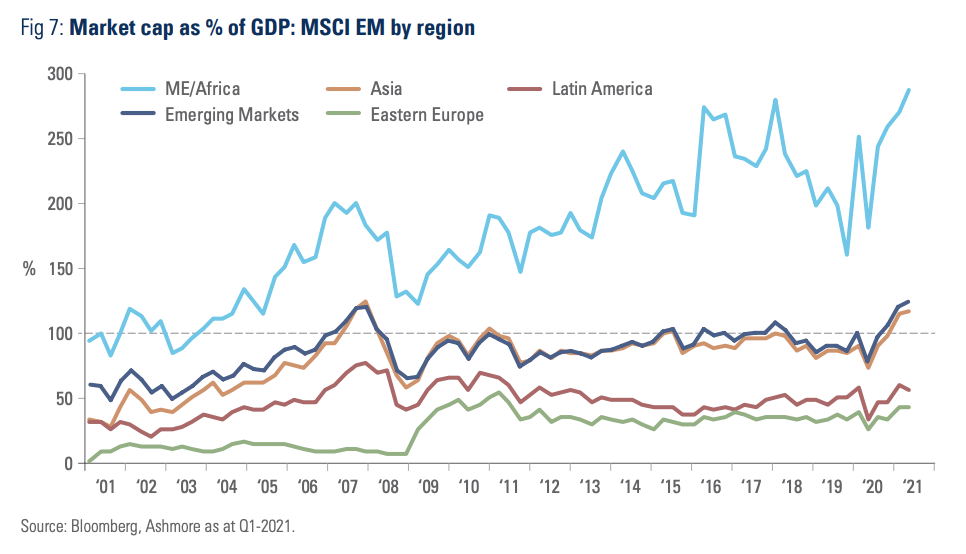
The aggregate ‘Buffett ratio’ for EM masks large valuation differences across regions in EM as shown in Figure 7.
EM Asia trades at a ratio of 117% (from 74% pre-Covid) and since Asian stocks currently make up 80% of the MSCI EM (compared to 45% in 2001), it dominates the ratio for EM as a whole. The Middle East and Africa’s ratio is higher at 287%, which reflects particularly large market caps to GDP in South Africa, Saudi Arabia, Qatar, and the United Arab Emirates, where the listing of national champions dominates.
For example, the listing of the Saudi Arabian Oil Company (ARAMCO) in 2019 boosted the market cap to GDP ratio for Saudi Arabia from 64% to 304% in the quarter of the listing. Saudi Arabia’s market cap to GDP now stands at 366%, which is the highest in EM.
Latin America and Eastern European equities have much more modest and stable ratios of 57% and 44%, respectively.
The Big Eight EM equity markets
Whilst regional breakdowns shed some light on how EM market caps to GDP behave across the asset class, the regional averages in turn conceal significant variations across countries. In order to gain a more granular insight about specific markets this section examines market cap to GDP ratios for the largest eight countries within MSCI EM, or the ‘Big Eight’. Together, the Big Eight markets account for nearly 88% of the MSCI EM index as of Q1 2021. China is the largest country with a weight of 37.9% followed by Taiwan (13.8%), South Korea (13.3%), and India (9.6%). The remaining four countries had much larger weights in the past, but are still significant. They are Brazil (4.5%), South Africa (3.8%), Russia (3.1%), and Mexico (1.7%).
Today, half of the Big Eight have market caps to GDP well below 100% as shown in Figure 8. China´s market cap to GDP rose from 57% in Q1 2020 to 80% in Q4 2020, but has recently declined to 73% after the regulatory clampdown on technology companies, among other factors. Its highest valuation in the past was 123% in Q4 2007. Brazil’s market cap to GDP ratio nearly doubled to 65% in Q1 2021 from 36% in Q1 2020, while Russia’s ratio increased to 51% from 31% over the same period. Mexico’s market cap to GDP rose to 36% in Q1 2021 from 22% in Q1 2020, a depressed level both in absolute terms and relative to the rest of EM.
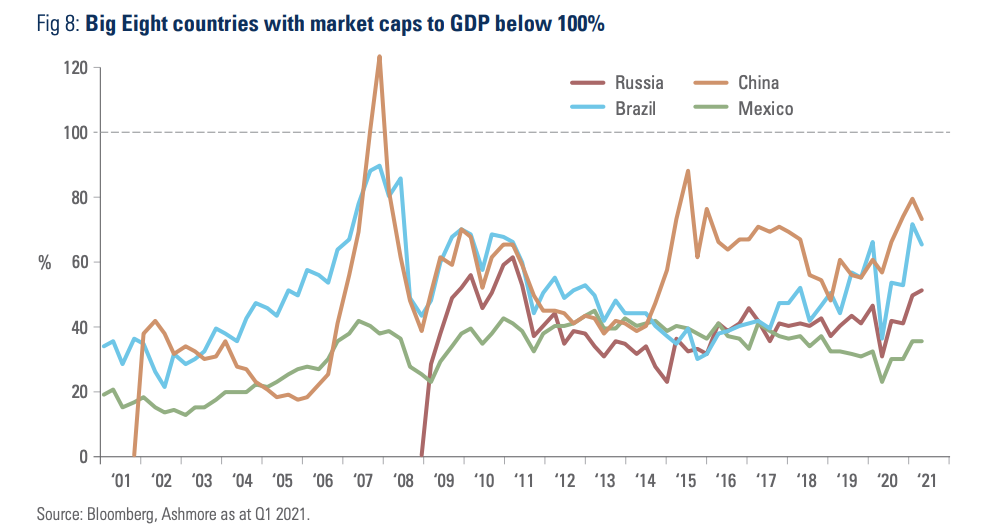
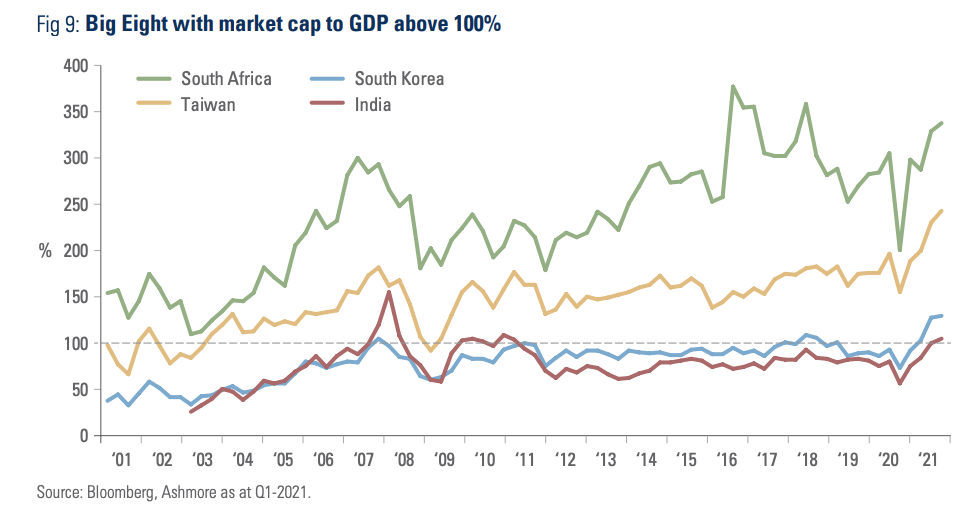
Figure 9 shows market caps to GDP for the remaining four countries in the Big Eight countries where the ratio stands above 100%. South Africa tops the list due mainly to the presence of large multinational companies in the mining sector as well as Naspers, which owns a significant stake in Chinese Internet giant Tencent. South Africa is a good example of a country where the ‘Buffett ratio’ may be misleading given the distortion triggered by large concentration in a few stocks. Another example is Taiwan, the second most expensive country among the Big Eight according to the same ratio, mostly due to the presence of global technology behemoths, such as semiconductor manufacturer TSMC, whose earnings are extremely large vis-à-vis the size of its economy. Another large exporting country, South Korea, which is currently benefitting from a very strong cyclical rebound in tradable goods currently values stocks at 128% of GDP. The last of the Big Eight is India, whose market cap to GDP just crossed the 100% mark for the third time over the last twenty years. The market capitalisation of Indian equities increased due to large improvements in productivity over the last few years thanks to growth of the formal sector, digitalisation as well as infrastructure spending across the country, all of which have supported strong earnings expansion.
Furthermore, Indian GDP has been running below its potential for five to six years due to sequential negative shocks to the economy, including demonetisation in 2016, the introduction of goods and service tax (GST) in 2017, and a mini-banking crisis in 2018 and 2019. The denominator of the ‘Buffett ratio’ in India therefore has considerable upside potential, especially considering that many Indian companies have de levered over the last decade. The Indian economy is in a strong position to improve its growth trajectory, in our view.
Overall, the Buffett indicator should trend up in EM as many large companies are still not listed in the national stock market, including nascent businesses in the technology sector. A single IPO of an Indian food-delivery company (Zomato) added USD 13.5bn of market cap (0.5% of total) which is close to 50% of the annual market cap listing of all IPOs in India from 2018 to 2020. In passing, it is insightful to note that the market cap of Chinese and Indian companies have outgrown GDP growth in these countries over the last 20 years. In addition, both the Chinese and Indian stock markets have an extraordinary breadth and depth.
Price to earnings: EM versus US
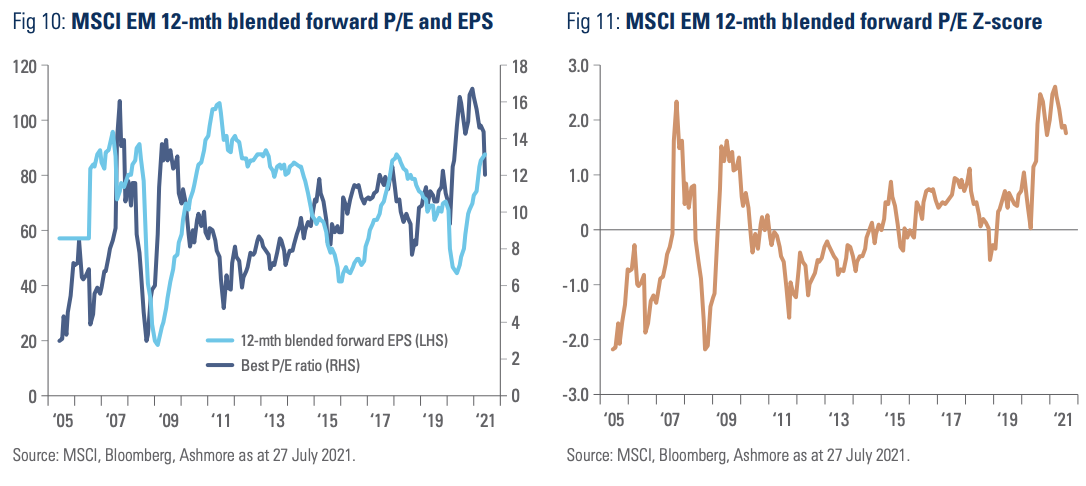
For EM in aggregate, price to earnings valuations stands at the upper part of the last 15 years range at 12.7 times earnings as shown in Figure 10. However, given the fact that EPS is increasing at a fast pace and taking into account the recent price correction, the Z-score for EM stocks has declined from 2.5 standard deviations (st. dev.) above the P/E mean in January 2021 to just 1.0 at time of writing.
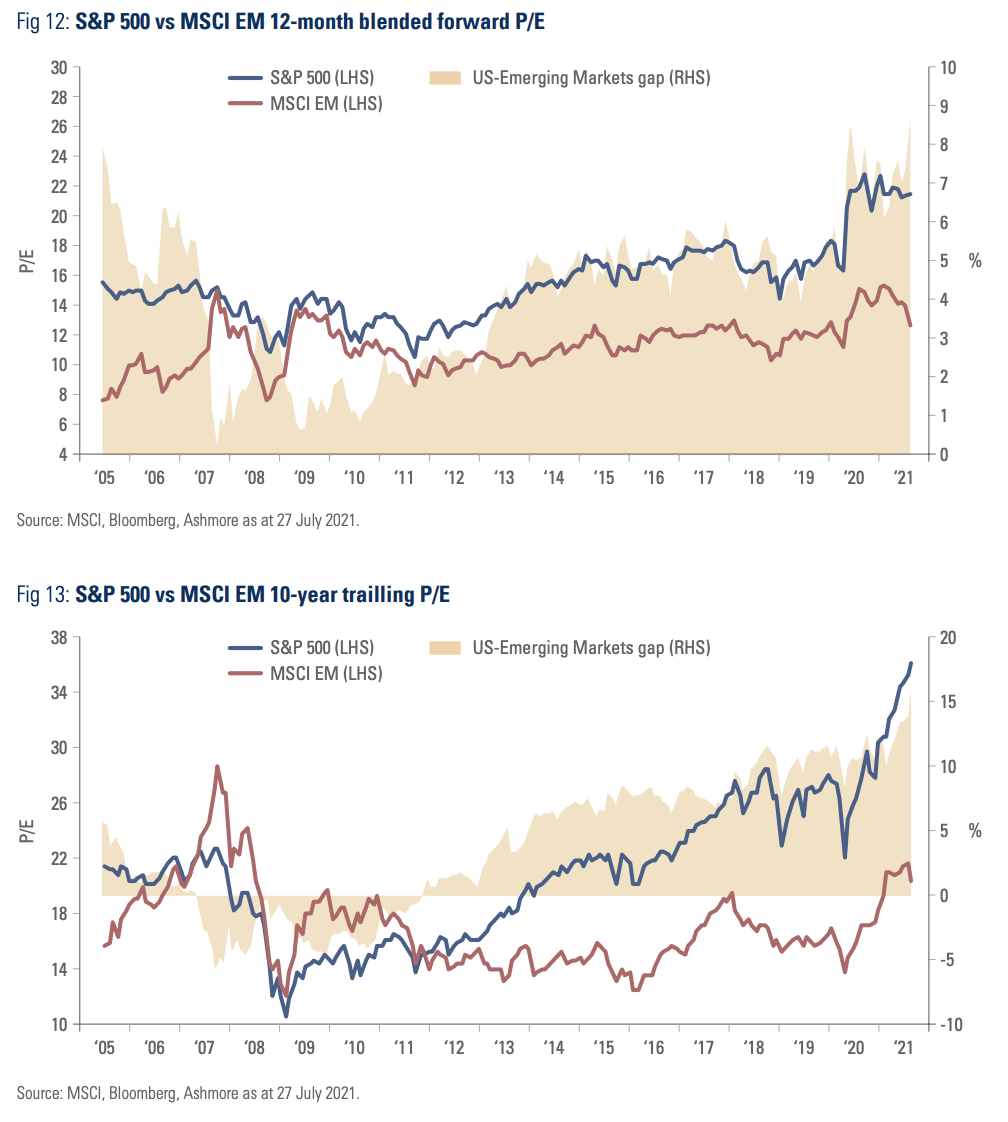
Furthermore, EM equities trade at the largest discount in terms of 12 month blended forward P/E to the S&P 500 since 2005. Even more contrasting is the gap between valuations of US and EM stocks on a 10-year trailing P/E depicted in Figure 13. The 10-year trailing P/E was developed by Yale Professor Robert J. Shiller in order to adjust earnings for cyclical developments, which can temporarily distort the index.
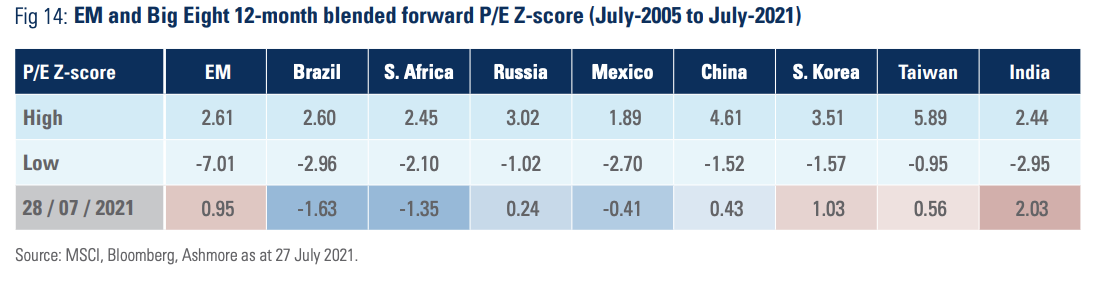
Within EM, a quick analysis of the individual Z-scores of the Big Eight in Figure 14 reveals a far more nuanced story. India stands out as the most expensive country on a Z-score basis, currently trading around 2.0 standard deviations above its mean, which is the highest level since 2005. South Korea is close to 1.0 while China and Taiwan are around 0.5 standard deviation from their means after de-rating from much higher levels since January 2020. Russia’s Z-score recently declined to levels that are even more attractive, while the Mexican P/E ratio currently sits slightly below its 16-year mean. Brazil and South Africa are the cheapest in relative Z-score of P/E terms, at 1.6 and 1.4 standard deviations below their respective means.
The remaining part of this section looks more closely at the individual markets and the factors behind the current valuations in each market.
Brazil
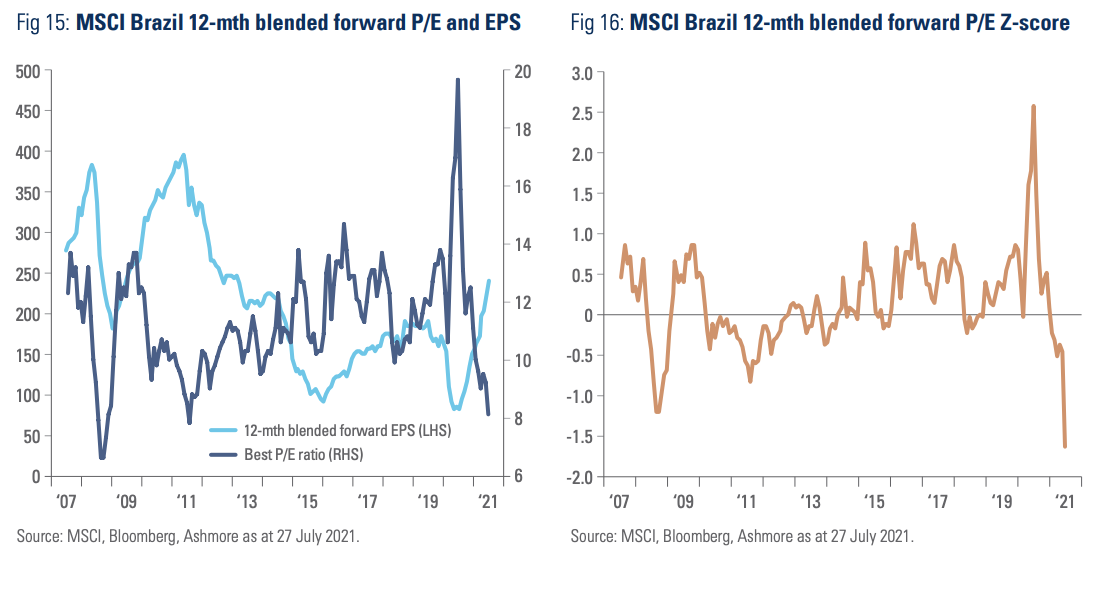
Figure 15 shows that Brazilian stocks are currently close to 8x earnings. This is 1.6 standard deviations below the mean (Figure 16), despite the fact that earnings stand at the highest levels since 2013 and are recovering at a similar pace as between 2007 and 2009. In other words, the Brazilian stock market is experiencing a cyclical upswing while its stocks still trade at a deep discount. Brazil’s undervalued currency due to political uncertainties and high levels of government debt may be part of the explanation, but at current valuation levels stocks seems to discount those risks and perhaps more.
South Africa
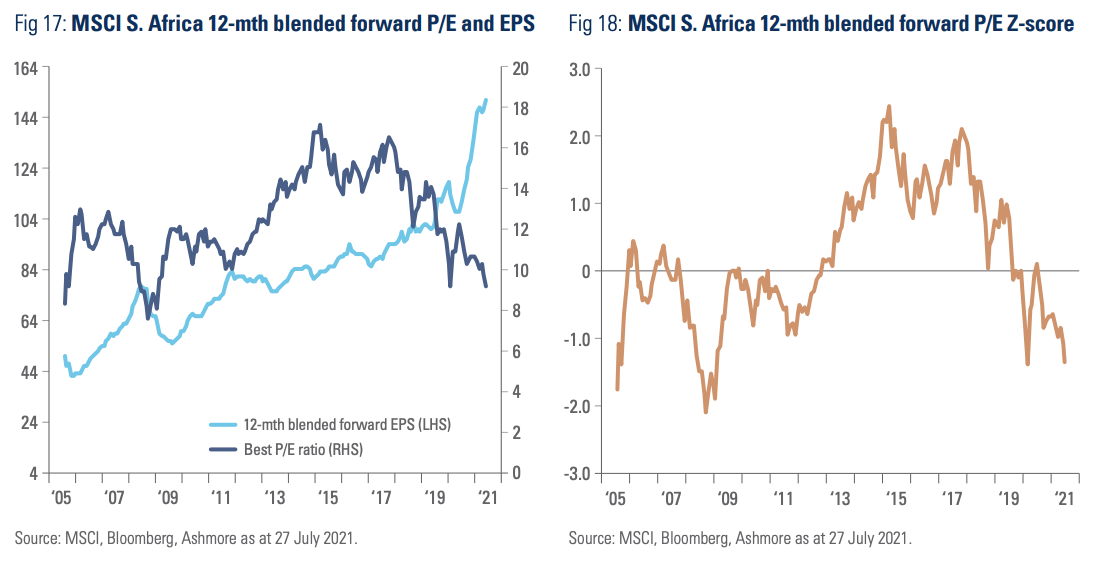
As Figure 17 shows, South African earnings per share have barely grown from 2008 to 2019. Much like South Africa’s economy, its companies are supported by strong institutions, but there has not been much improvement since the end of Thabo Mbeki’s administration. Investors were paying a high premium for South African stocks in 2015, but have since given up on optimism, leading to six years of de-rating, which has left South Africa the second cheapest country in terms of P/E Z-score at -1.4 (Figure 18). Furthermore, higher commodity prices are boosting the outlook for earnings growth, which is expanding for the first time since 2008. This means that the recent volatility of South African stocks caused by political unrest, alongside cheap valuations, may mean there are attractive investment opportunities.
Russia
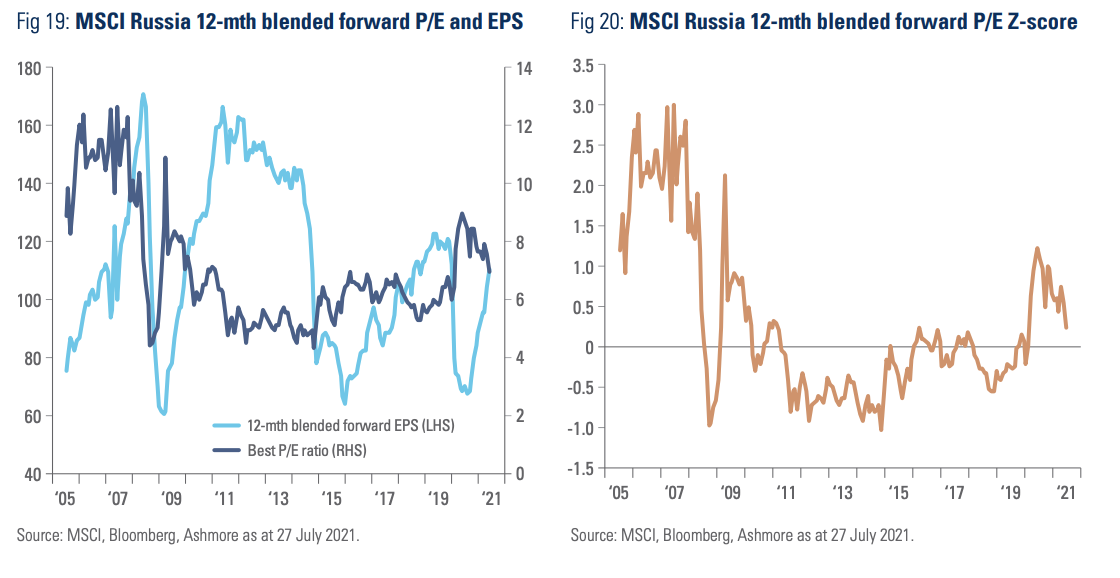
Equity investors have been dismissive of Russian stocks for many years, as they have seen the interests of large Russian companies more closely aligned with the government than with shareholders. This has led to very low P/E multiples since 2010 as seen in Figure 19. More recently, investors have added exposure to Russian stocks thanks to interesting opportunities in the technology sector and in severely undervalued companies in the materials and financial sectors, in turn causing valuations to increase somewhat. Furthermore, in spite of low oil prices, EPS improved significantly from 2016 to 2019 thanks to solid macroeconomic policies, including prudent fiscal policies and a highly credible central bank. Today, Russian EPS is rebounding thanks to a strong economic recovery and higher oil prices, which may well extend over the next several quarters. Interestingly, the Z-score of P/E for Russia moved from 1.2 standard deviations above its mean in July-2020 to just 0.2 today as shown in Figure 20.
Mexico
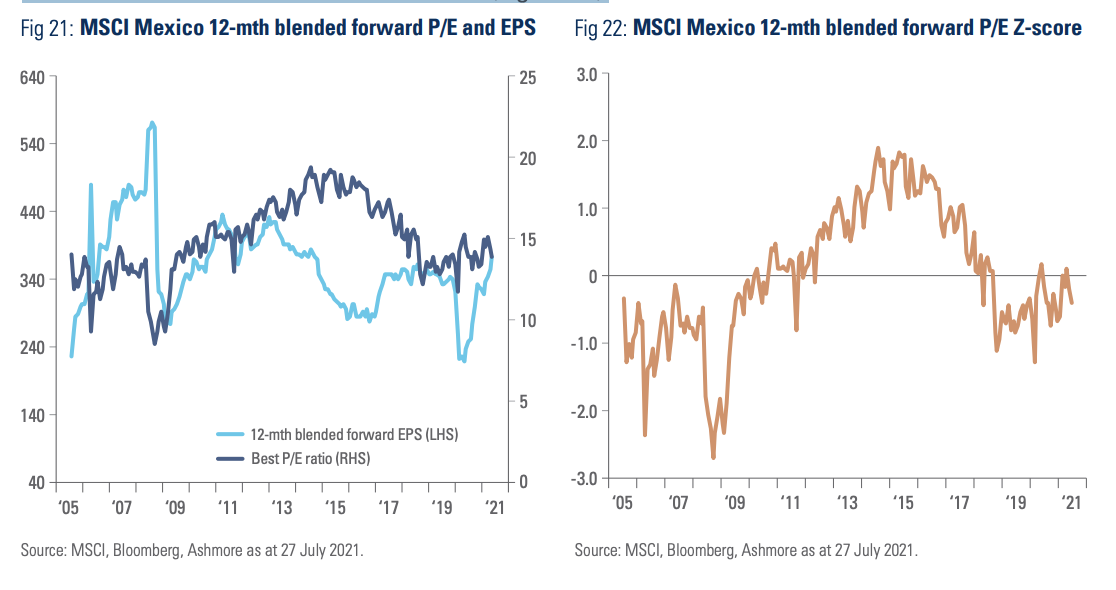
Mexican EPS have recovered back to pre-Covid levels, but are still around their 16-year average. In our view, earnings growth is likely to expand thanks to the economic rebound in the US and the ongoing re-opening of the Mexican tourism sector. Mexican stocks currently screen as undervalued, particularly considering the current stage of the economic cycle, at 13.9x earnings (Figure 21), or 0.4 standard deviations below their mean (Figure 22).
China
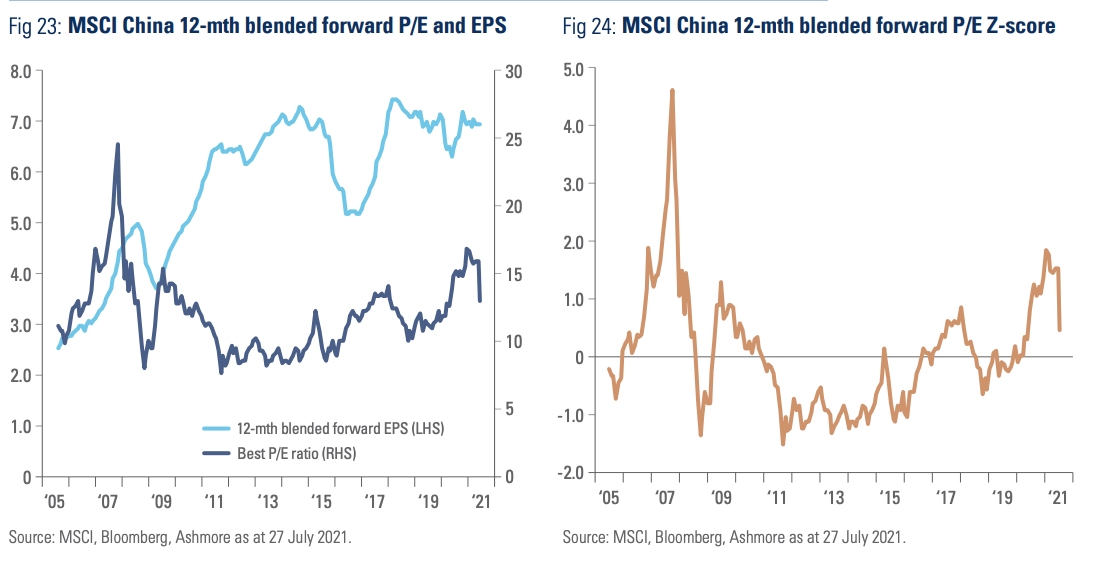
EPS for Chinese stocks hardly declined during the pandemic and have since returned to the same levels of the 2018-2019 period. China was the first country where equity valuations re-rated after the Covid-19 pandemic as investors paid a premium for the good handling of the pandemic, which allowed economic activity to rebound, while the rest of the world entered lockdowns. P/Es rose from 11.0x in September 2019 to 16.8x in January 2021 before declining to 12.9x on the 27 July (Figure 23). Most of the year-to-date correction came from stocks in the technology, real estate and educational sectors, which have come under increased regulatory pressure leading more recently to broad negative sentiment across Chinese stocks. The Z-score of the MSCI China P/E declined from 1.8 standard deviations above its mean to only 0.4 (Figure 24), which is a meaningful de-rating for a country with significant growth opportunities, particularly considering recent liquidity injections from the People’s Bank of China via cuts in the reserve requirement ratio for banks.
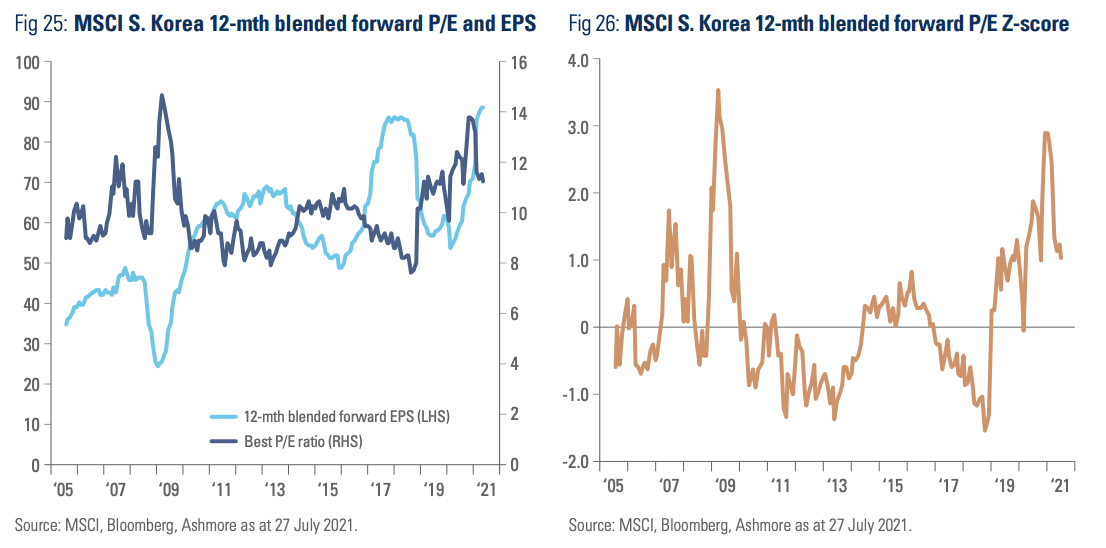
South Korea
Similar to China, the 12 months forward EPS in South Korea was largely unscratched by the Covid-19 pandemic. Swift implementation of an effective track and trace system early in the crisis allowed for a robust rebound of Korea’s manufacturing sector far earlier than in most other countries. Korean earnings have also benefited from a strong rebound in demand for electronic goods following the downturn triggered by the start of the US-China trade war in 2018. In addition, Korean pharmaceutical companies and durable goods producers also benefited from higher demand during the pandemic. In terms of valuations, Korean stocks therefore moved from undervalued at 7.6x earnings in October 2018 (Z-score of -1.6) to overvalued at 13.8x earnings in December 2020 (Z-score of 2.9) as shown in Figures 25 and 26. More recently, a sharp acceleration in earnings growth expectations in excess of the rise in equity prices has precipitated a decline in the P/E ratio to 11.2x earnings, or 1.0 standard deviation ahead of the mean.
Taiwan
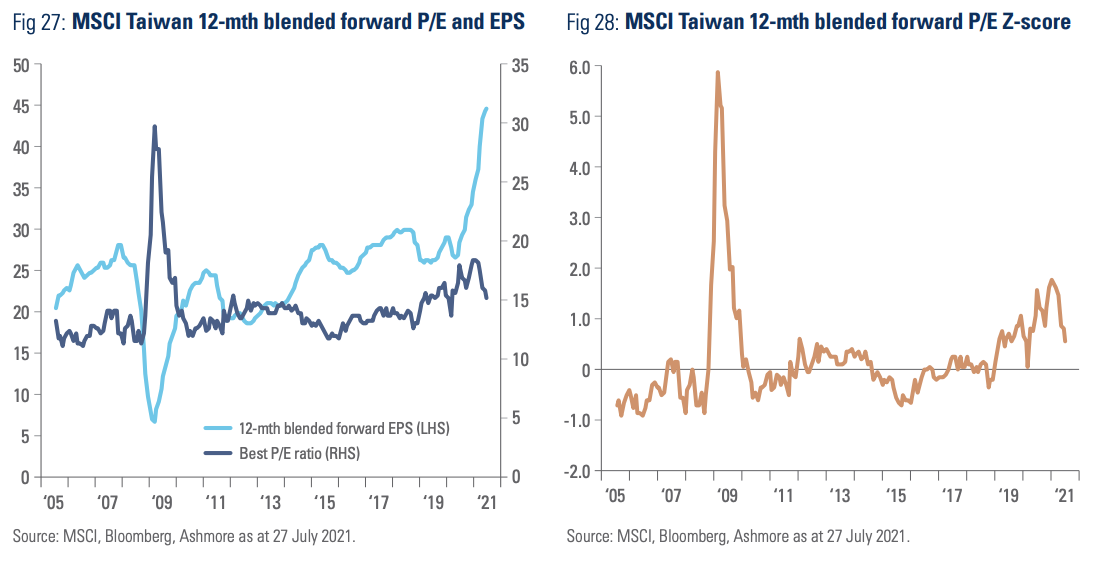
Taiwanese stocks are another example where valuations look expensive in market cap to GDP terms, but not so much when looking at the price to earnings. Taiwanese stocks benefited strongly from the Covid-19 crisis as higher demand for high-tech electronic goods resulted in a shortage of semiconductors. Other manufactured goods also experienced strong demand, leading to a 57% surge in earnings between July 2020 and July 2021 as per Figure 27. The price to earnings ratio also accelerated from 12.4x in October 2018 to 18.3x in January 2021 before de-rating to 15.1x as of 27 July 2021, thanks to an acceleration of earnings expectations in excess of the share prices. In terms of Z-score, Taiwan stocks are sitting at 0.6 standard deviation away from their mean (Figure 28), which is attractive considering the strong structural growth drivers for semiconductor demand.
India
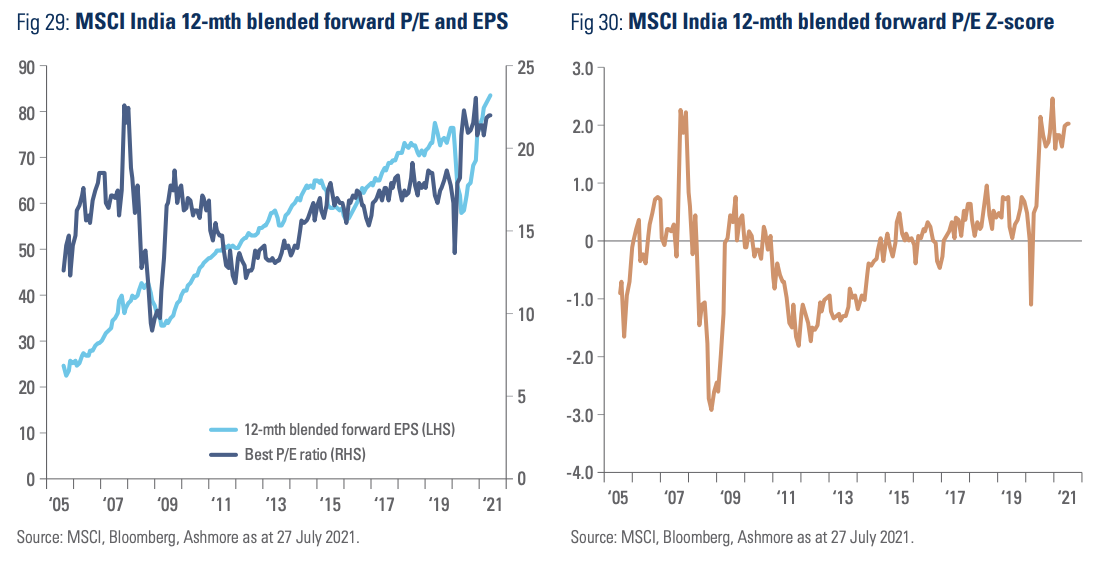
As in most EM countries, Indian 12-month forward earnings estimates have seen a strong cyclical rebound, bringing EPS to its highest historical level. At the same time, Indian equity valuations seem to price in the EPS recovery since the P/E ratio sits at a high 22.0x as per Figure 29. However, Indian stocks have historically traded at a premium due to distinct features of the Indian market, including a domestic oriented economy, a very broad equity market with many opportunities, large ownership of stocks by domestic investors (home bias), and one of the strongest demographic profiles in the world. These factors have allowed for a solid structural expansion of earnings over the last 15 years. In addition, a small number of large companies distort the headline P/E ratio, including ‘expensive’ companies like Hindustan Unilever, Nestle, and Asian Paints as well as companies in the financial sector that currently report below trend earnings. Among the Big Eight, Indian stocks do not stand out as outright cheap with a Z-spread close to a 15-year peak at 2.0 as per Figure 30
Conclusion
This report analysed US and EM stock prices using two different methodologies. The so-called ‘Buffett ratio’ and the traditional price to earnings ratio. Both point to EM being meaningfully undervalued when compared with US stocks. On an absolute basis, EM stocks do not screen as ‘cheap’ vis-à-vis recent history largely due to the recovery stage of the economic cycle, where valuations tend to lead the positive revisions to growth and earnings. The report also highlights significant valuation opportunities for active managers in EM.
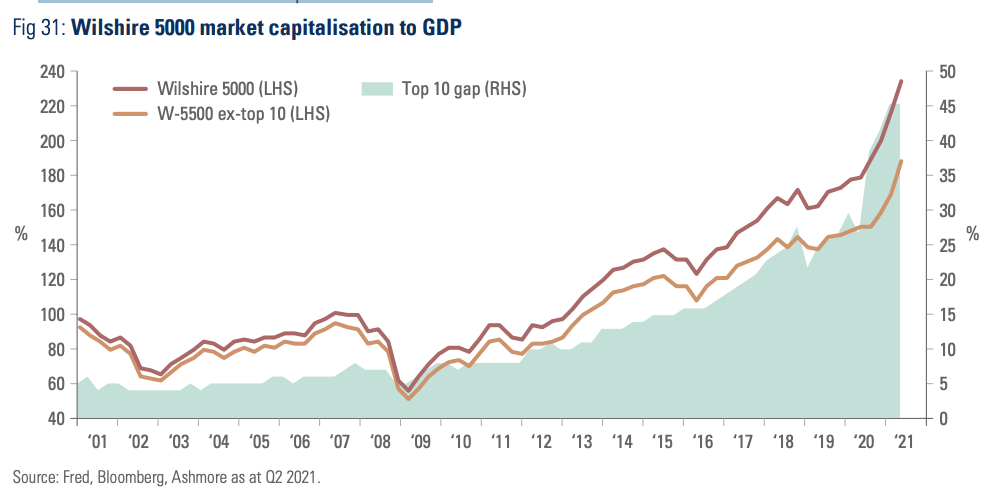
Appendix 1: What explains large profit margins in the US? • Globalisation, technological progress, and inequality: The main factor explaining the strong earnings expansion in the US is technological progress. This is great – higher productivity forms a sustainable basis for improvement in any society. However, the US has only relatively few companies and individuals, who are able to monetise most of the gains made possible by technology, leading to rising inequality. Inequality has been increasing since the 1980s as wages underperformed both broad economic progress and company earnings. The boom in asset valuations (stocks and houses) since 2008 has further exacerbated the share of wealth of the top 10% of Americans, who now control close to 80% of all assets. This may be changing going forward as the Biden Administration proposes to increase taxes for large companies and the wealthiest individuals. • Monopoly power: A number of key companies in US stocks markets have achieved a degree of monopoly power, enabling them to extract extraordinary profit growth for a much longer period than in previous cycles. The largest 10 companies in terms of stock market capitalisation have valuations that are equivalent to 46% of GDP. However, US stocks still look overpriced in historical terms, even after excluding the ten largest stocks as shown in Figure 31. The existence of pockets of irrational exuberance in stocks of companies with poor fundamentals (meme stocks) and the recent strong run of previously undervalued stocks from sectors like financials, materials, and energy also suggests that stock market overvaluation is a broader phenomenon.
Tax and regulatory environment: It is unlikely that the largest technology companies in the US will keep receiving a favourable tax and regulation treatment, in our view. In early July, a group of 130 countries approved a global 15% corporate income tax that will prevent technology companies from circumventing tax by registering intellectual licences and property rights in low-tax jurisdictions.3 At the same time, Democrats will likely lobby for more redistributionist policies, which will require higher taxation. The regulatory environment is also likely to get tougher, focusing on curtailing monopolistic practices.4
Low risk aversion due to low interest rates: Another hypothesis for elevated P/Es and market cap to GDP ratios is that investors are less averse to risk than ever before. However, one can perhaps more plausibly argue that investors have no alternative but to be less risk-averse due to record-low levels of interest rates in fixed income assets, alongside a large amount of direct intervention in capital markets via asset purchasing programmes, or quantitative easing. In fact, the size of the balance sheet of the largest central banks in the developed world rose from 11.2% of GDP in December 2007 to 58.0% in June 2021.
Membership required
Membership is now required to use this feature. To learn more:
View Membership Benefits