An increase in interest rates that had been widely anticipated for several years finally came to fruition in 2022. A variety of inflation measures that a year ago had been deemed “transitory” remained elevated throughout the year. This finally gave the Federal Reserve (the “Fed”) a green light to reverse years of an “easy” monetary policy and initiate, what has been by historical standards, an extraordinarily rapid and accelerated tightening of its monetary policy and increase interest rates—specifically, the federal funds rate (the interest rate that banks charge each other to borrow or lend excess reserves overnight).
In a span of only nine months, the federal funds rate was raised 425 basis points in seven increases, lifting its target range to 4.25%-4.50%, the highest level in 15 years. Market yields in benchmark U.S. Treasury and municipal bonds responded in kind and have experienced substantial increases as well. As a result, fixed income asset classes across the board, including municipal bonds, saw values fall due to the inverse yield/price relationship.
The monetary policy, fixed income returns and economic landscape this year have begun to more closely parallel the Fed-driven bond bear markets of 1994 and 1998. In particular, this year’s municipal bond market performance appears to share more in common with those 1990s bear markets than with the post-2000s market dislocations with which many municipal bond investors are familiar, such as the 2008 credit crisis and the so-called “Taper Tantrum” in 2013. Of course, every market cycle is different and cannot be a predictor of the future. An evaluation of some of the parallels and dichotomies between the bond bear markets of the 1990s and today can offer potentially greater insights into approaching fixed income asset allocation and, more specifically, municipal bond investing heading into 2023.
A Look Back at Previous Market Cycles
The municipal bond market in the 1990s experienced two significant pullbacks, as higher market interest rates driven by Federal Reserve monetary policy produced negative returns for investors. In comparing both, the 1994 market unfolded much like the bond market has in 2022. For example:
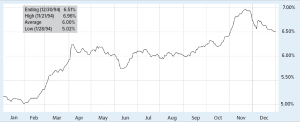
- The 1994 bond bear market was deeper, yet quicker than the 1998-2000 bond bear market. In looking at benchmark AAA municipal bond yields, the trough and peak for yields in 1994 occurred over only 10 months between February and November of that year, with 30-year yields climbing over 190 basis points over that time (as illustrated below).

Source: Bloomberg. Past performance does not guarantee future results.
The total return for the Bloomberg U.S. Municipal Bond Index in 1994 was -5.18%, the largest single-year negative return in municipal bonds until this year (so far). As of this writing, the 2022 YTD total return for the Index is -8.35%.
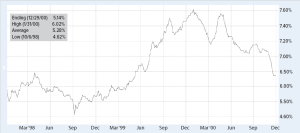
- From 1998-2000, the ultimate time between trough and peak yields was twice as long as the 1994 bond bear market, at 20 months (from September 1998-May 2020). However, it involved a more muted increase in 30-year yields of 140 basis points (see below).
Source: Bloomberg. Past performance does not guarantee future results.
Of note, the single largest calendar year negative return during that 3-year period was 1999 (-2.06%), while the 3-year average return was 5.22%. As bond bear markets go, the 1998-2000 one was generally considered fairly docile for municipal bond investors.
Fed Policies and Economic Backdrops
In 1994, then-Federal Reserve Chairman Alan Greenspan was facing an economy with GDP growth of 4% that was quickly accelerating above 5%. With a relatively benign inflation environment, he moved quickly throughout 1994 to get ahead of what was at the time perceived as inflationary growth. The federal funds rate was increased that year from 3% in January to 6% in November, and market yields in both taxable and tax-exempt fixed income markets rose substantially. As a result, 1994 produced the largest one-year negative fixed income returns prior to those of 2022.
This year, current Federal Reserve Chairman Jerome Powell has been facing much higher inflation levels, topping 8% during 2022. Much like Alan Greenspan in 1994, Mr. Powell has moved quickly and decisively in initiating a much tighter monetary policy to help quell inflation.
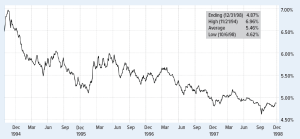
The big dichotomy between 1994 and today has generally been the health of the economy. The bond bear market of 1994 saw the advent of a huge productivity wave, as the wide adoption of both the Internet and cell phone usage helped spawn a technology-driven efficiency in the economy that ultimately helped keep inflation well under 3%. Without an uptick in inflation, Fed policy quickly paused and eventually reversed course in 1995, as market yields began to recede and continue declining for the next four years (see below).
Source: Bloomberg. Past performance does not guarantee future results.
Here in 2022, we are emerging from a three-year period of economic disruption in the aftermath of the COVID-19 pandemic. Annual GDP growth for the 2020-2022 period is expected to average approximately 1.3% and enter 2023 in a decelerating trend with reduced growth expectations. This economic weakness stems from a decidedly “lack of productivity” economy, characterized by substantial supply chain disruptions and an uneven labor market recovery that has, only recently, brought total employment and labor participation rates back to February 2020 levels.
It increasingly appears that the “pandemic economy” is outlasting the pandemic itself. This kind of continued economic weakness has not historically been the backdrop for long-term, steady inflation, and could portend an economic environment that allows the Fed room for a pause in its monetary policy. The current inversion in the U.S. Treasury yield curve seems to give some validity to this consideration.
The Cumulative Effect of Recurring Income
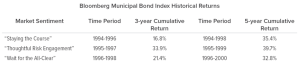
With the federal funds rate currently at 4.50%, short-term savers are finally being paid reasonable returns in a variety of cash equivalents and other savings vehicles. Cautious investors and those bruised by the negative returns of 2022 have also increasingly sought the relative safety of these short-term “harbors.” However, an examination of returns following the 1994 bond bear market can illustrate how remaining patient and maintaining a long-term asset allocation perspective may be more effective than market timing and maneuvering on and off the sidelines (see below).
Source: Bloomberg. The examples referenced above are specific for the time periods referenced. Returns are cumulative and do not include the effect of fees and expenses or and the reinvestment of dividends. Past performance does not guarantee future results.
The total return environment for municipal bonds across these three potential entry points at the time reflect how significant opportunity costs may result from moving to, or remaining on, the sidelines over the course of time. ”Staying the course,” even through challenging market conditions, still left investors with a positive total return experience. As we know, this cannot guarantee future results will be similar. The key is for investors to consider such factors as their individual investment objectives, risk tolerance and long-term financial goals.
This points to the lesson from the 1994 bond bear market returns of the importance of income when it comes to fixed income investing, including municipal bonds. In order to benefit from the cumulative effect of fixed income coupon streams, it often requires staying the course through bouts of market turbulence. As Josh Billings (the pen name of Henry Wheeler Shaw) once said, “Consider the postage stamp. Its usefulness consists in the ability to stick to one thing till it gets there.” As it pertains to fixed income investing, “sticking with it” and enabling an investment to generate recurring income is a key aspect of municipal bonds.
Relative Yields and Valuations
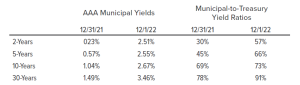
The municipal bond market experienced some firmness from the lows of October 2022, but yields remain well above their 2021 year-end lows. In addition, relative values reflected in Municipal-to-Treasury yield ratios still appear more favorable as well (see below).
Source: Bloomberg. Past performance does not guarantee future results.
A few observations to draw from these yield and valuation changes are as follows:
- The state of investible yields has improved dramatically in just this year alone. Investors approaching retirement and/or with an income-oriented objective are now capable of generating a meaningful stream of tax-free income that simply was not attainable a year ago.
- Municipal bond yields have generally increased more when compared to taxable yields—an indication that eroded municipal bonds prices have potentially become undervalued or discounted. This is especially true of high-quality municipal bonds (as of this writing and, of course, subject to change).
- Such valuation discounts may potentially mitigate the downside volatility of future interest rate increases and perhaps even bolster longer term total return prospects should relative values improve.
- Moving out the maturity spectrum from short to intermediate and longer maturities may enable investors with long-term, income-oriented objectives to situate their municipal bond allocations to more effectively meet those goals.
Considerations Moving Forward
Municipal-to-Treasury yield ratios are viewed as a common barometer of relative value. However, this barometer is sometimes a better indication of what not to do rather than what to do. In the case of higher (“cheaper”) yield ratios, the most valuable implication may be one of a patient approach towards allocating away from the municipal bond asset class. The potential entry point of today’s investable yields and relative values demonstrate that the opportunity costs of moving to, or remaining on, the sidelines may have finally caught up to costs that are inherent in the interest rate risks of a continuation of current Federal Reserve policy and path of inflation.
Particularly during periods of volatility and uncertainty, it is important to maintain a long-term perspective. While some investors may attempt to avoid market volatility, or perhaps make emotionally-based investment decisions, we strongly suggest that individual investors not try to time the market. Rather, keep in mind the key benefits offered by municipal bonds, and remain focused on your investment objectives and long-term financial goals. Now may be an appropriate time to review your asset allocation to ensure that your portfolio is aligned with your individual investment objectives.
This information is general in nature and is not intended to provide investment, accounting, tax or legal advice. It is not intended to represent a recommendation or solicitation related to any particular investment, security or industry sector. The opinions shared are those of the author and do not necessarily reflect those of the Investment Adviser of the Fund.
Independent rating services such as Standard & Poor’s, Moody’s and Fitch assign ratings, which generally range from AAA highest to D lowest, to indicate the creditworthiness of underlying bonds in the portfolio. Where the independent rating services differ in the rating assigned to an issue or do not provide a rating for an issue, the highest available rating is used in calculating allocations by rating.
Yield refers to the earnings generated and realized on an investment over a specific period. Yield is expressed as a percentage based on the invested amount, current market value, or face value of the security, and includes the interest earned or dividends received from holding a particular security. The yield ratio represents the comparison of the expected yield of one bond to the expected yield of another.
The Bloomberg Municipal Bond Index is an unmanaged index that covers the U.S. dollar-denominated, long-term tax-exempt bond market. The index has four main sectors: state and local general obligation bonds, revenue bonds, insured bonds and pre-refunded bonds. Indices are unmanaged and are not available for direct investment.
BLOOMBERG® is a trademark and service mark of Bloomberg Finance L.P. and its affiliates (collectively “Bloomberg”). Bloomberg or Bloomberg’s licensors own all proprietary rights in the Bloomberg Indices. Bloomberg does not approve or endorse this material or guarantee the accuracy of completeness of any information herein, nor does Bloomberg make any warranty, express or implied, as to the results to be obtained therefrom, and, to the maximum extent allowed by law, Bloomberg shall not have any liability or responsibility for injury or damages arising in connection therewith.
Mutual fund investing involves risk; loss of principal is possible. Investments in bonds may decline in value due to rising interest rates, a real or perceived decline in credit quality of the issuer, borrower, counterparty, or collateral, adverse tax or legislative changes, court decisions, market or economic conditions. State-specific fund performance could be more volatile than that of funds with greater geographic diversification. Past performance does not guarantee future results.
Before investing in the Fund, carefully read about and consider the investment objectives, risks, charges, expenses, and other information found in the Fund prospectus. The prospectus is available from your financial professional, by clicking here, or by calling 800-437-1020.
Read more commentaries by Aquila Group of Funds