Current Backdrop
2025 has been marked by U.S. tariff news, geopolitical tensions and market volatility. Recent comments by Treasury Secretary Scott Bessent and President Donald Trump seem to confirm that the “Trump put” of his first presidential term is no longer in place. Investor confidence has clearly been shaken by this revelation and the uncertainty of the administration’s on-again/off-again tariff policy. Thus, 2025 so far has represented a stark reversal from many of the trends we saw last year. Nevertheless, one could argue the market needed a correction with stocks at all-time highs and credit spreads in many areas of fixed income at post-Global Financial Crisis (GFC) tights entering the year.
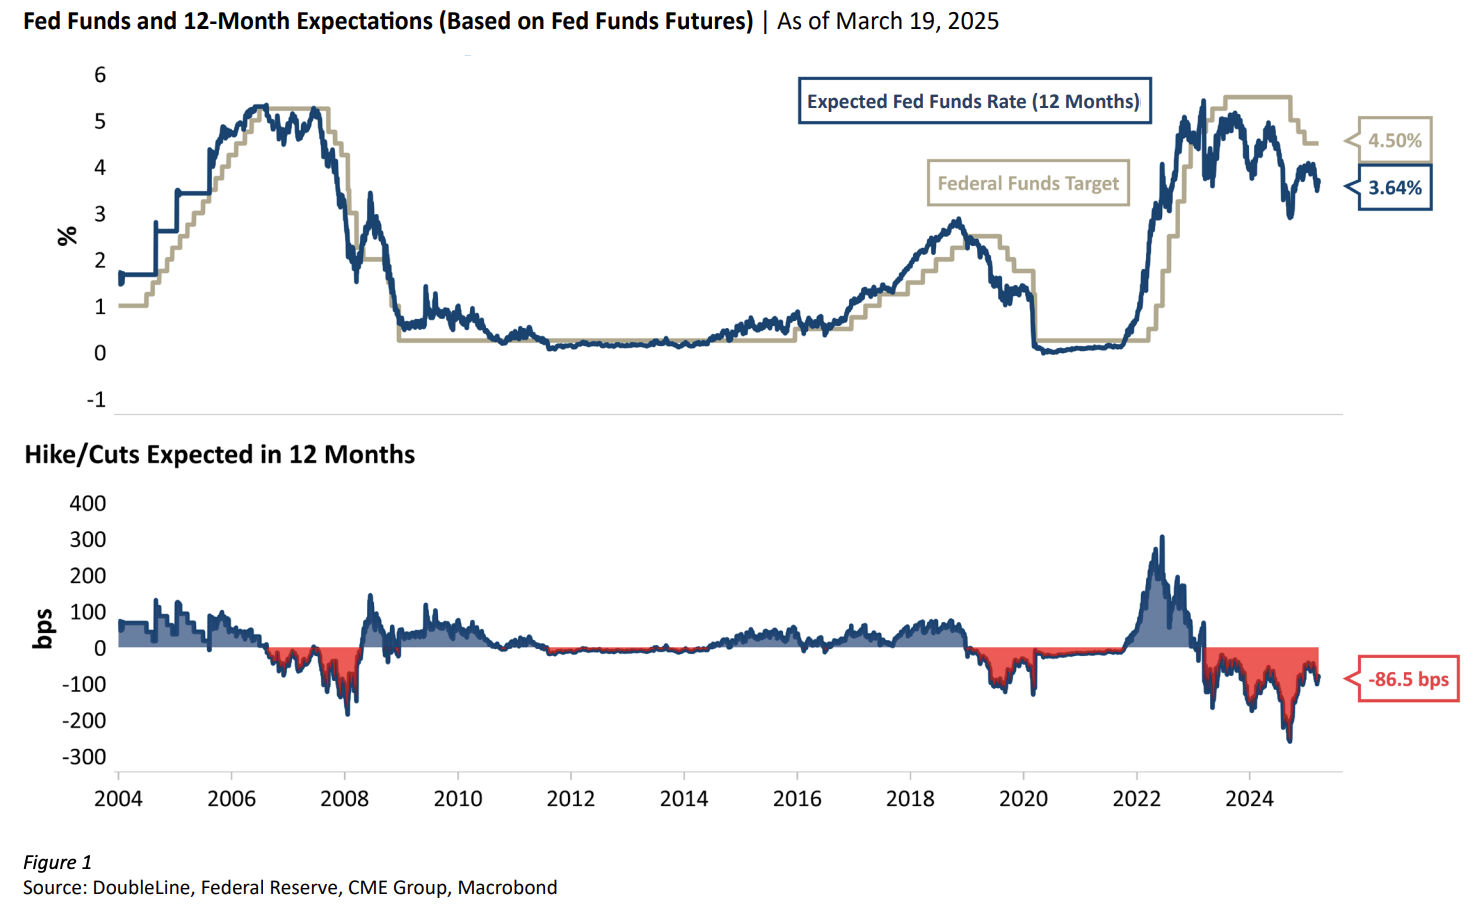
In 2024, risk assets generally outperformed consensus expectations amid stronger-than-expected growth. While many global central banks embarked on policy normalization, resilient growth and sticky inflation led markets to pare back expectations for additional monetary policy easing. Despite high interest rates and a modest rise in unemployment, U.S. real gross domestic product (GDP) increased at an annual rate of 2.8% in 2024, according to the advanced estimate from the U.S. Bureau of Economic Analysis, while inflation eased to 2.9% by year-end.1 Throughout 2024, several traditional economic indicators continued to signal economic contraction, however, strong consumer spending and a robust services sector powered the economy forward. The U.S. Treasury yield curve steepened during 2024, with the two-year note falling 1 basis point (bp) and 10- and 30-year Treasury yields rising 69 bps and 75 bps, respectively. The Federal Reserve first lowered the target federal funds rate (FFR) by 50 bps in September, followed by sequential cuts of 25 bps in the final two meetings of the year but decided to maintain the target FFR at 4.25% to 4.50% at its first two meetings of 2025. Market expectations for Fed cuts have been on a rollercoaster ride, with the number of cuts expected in 2025 having risen from the start of the year. (Figure 1) Despite a recent rally, long-end Treasury rates remain well above where they were at the start of the Fed’s cutting cycle.

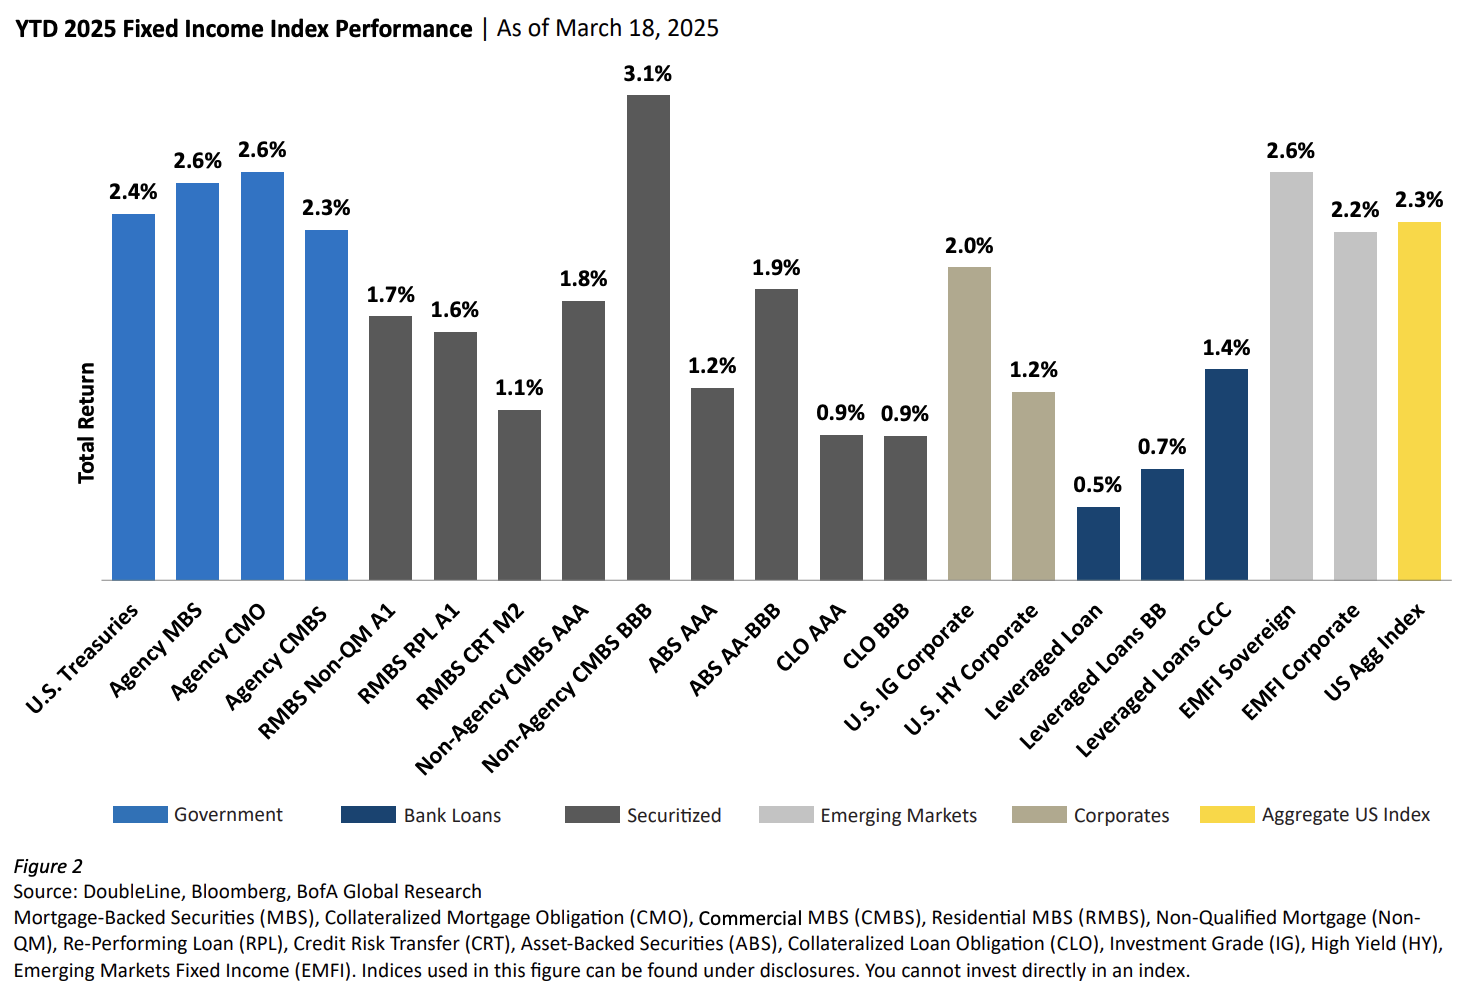
After Donald Trump’s November victory, initial market reaction included stocks reaching all-time highs, the U.S. dollar strengthening, Treasury yields rising and credit spreads tightening (see: DoubleLine’s Initial Thoughts on the Economic Impact of U.S. Election). However, these trends have reversed in 2025, with stocks losing all post-election gains, the dollar weakening, Treasury yields falling and credit spreads widening. Risk-off sentiment has led to bond outperformance versus equities, with the Bloomberg US Aggregate Bond Index (the “Agg”) up 2.31% versus a negative 4.26% return for the S&P 500 Index.2 (Figure 2) Moving forward, all eyes will be on President Trump’s policy implementation and the potential ramifications of the methods used to deliver on it.
Income in Fixed Income
Less than four years ago, there was $18.3 trillion of bonds that had a negative yield profile. Today, that number is zero. Four years ago, the Agg had a yield of 1.19%. Today, it yields 4.70%.3 On Jan. 11, 2022, DoubleLine CEO-CIO Jeffrey Gundlach stated on his annual “Just Markets” webcast, “Equities are cheap relative to bonds. It’s not that stocks are cheap using traditional metrics [such as the price-toearnings ratio], it is because bonds are so expensive with the highest negative interest rates in the history of the data series.” Time proved Mr. Gundlach correct as the Agg experienced its worst calendar year return on record, falling 13.0% in 2022.
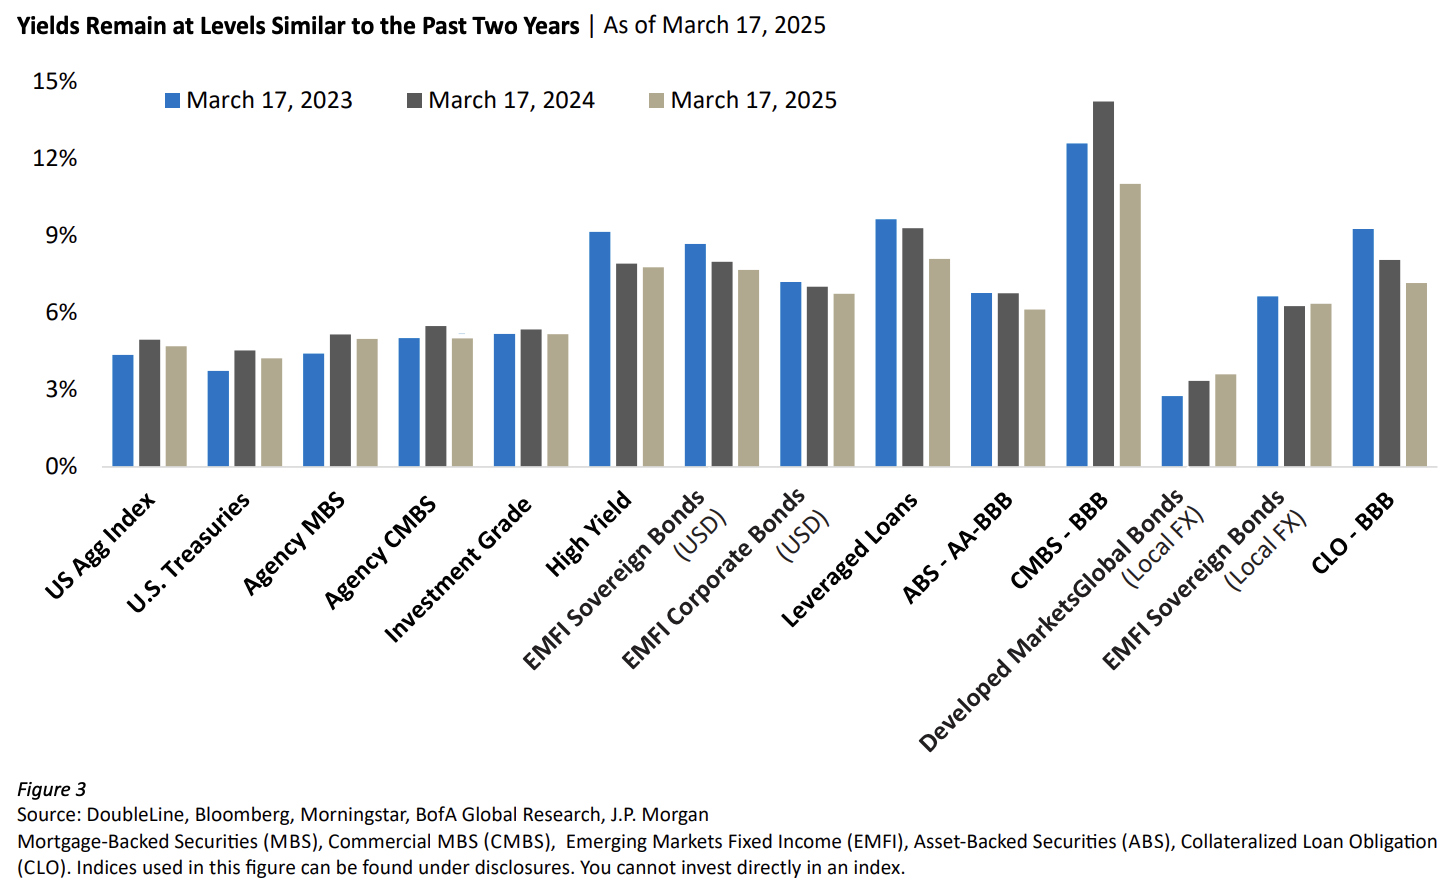
While painful, the 2022 experience gave way to a fixed-income yield environment that had not been seen since the 2000s. By year-end 2022, DoubleLine believed the pain had given way to significant opportunity (see: The Case for Public Credit in Today’s Environment (October 2022)). While credit spreads have tightened since, we maintain the same sentiment today, as current all-in yields remain at levels similar to the past two years. (Figure 3)
Outlook
Higher for Longer?
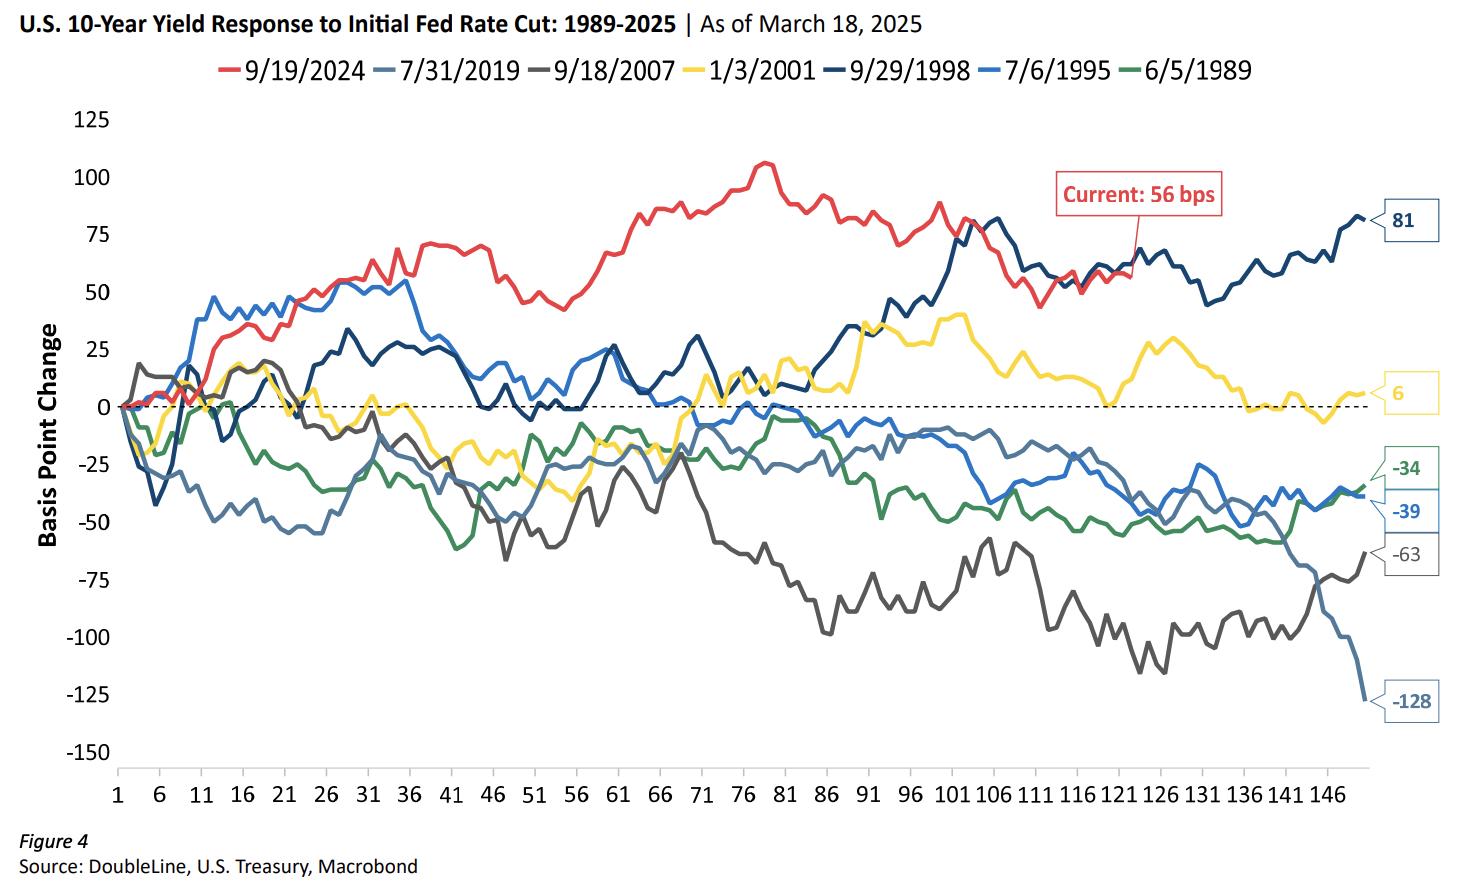
A common sentiment from investors last year was “When the Fed cuts, rates will fall.” At DoubleLine, we thought the “direction of rates” question warranted a follow-up, “What part of the Treasury curve?” The implication that yields would fall across the curve following the initiation of a Fed rate cutting cycle does historically carry merit. The two-year yield tends to lead the FFR and therefore falls often prior to rate cuts. The 10-year yield has also fallen most of the time following an initial Fed rate cut. (Figure 4)
However, we were of the belief that “This time might be different,” a phrase in the finance world often proved fallacious. Nevertheless, since the first Fed cut on Sept. 18, the long end of the curve has risen. The question facing investors moving forward is: Will it last? Absent a recession, we believe the answer is yes. DoubleLine’s base case is that a combination of stubborn inflation, heightened rate volatility amid policy uncertainty and an expanding deficit coupled with rising interest expense puts a floor under the long end of the Treasury yield curve in the near to medium term. Given our views, we are taking a patient approach on extending portfolio duration meaningfully. Additionally, our intermediate-duration portfolios’ government allocations are positioned with a curve steepener, with an overweight to the front end and an underweight to the long end of the Treasury curve (see: U.S. Treasuries, page 8).
All-In Yields Remain Attractive
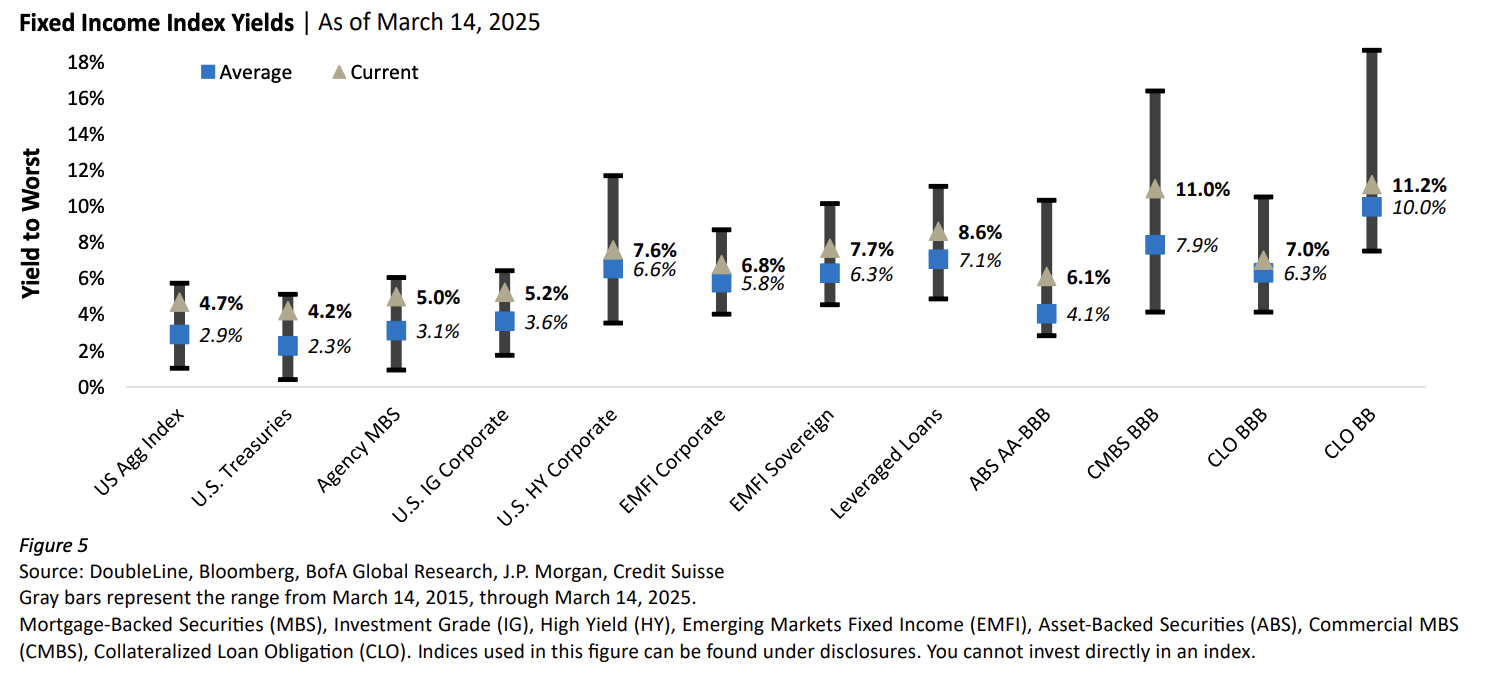
In contrast to the low-yield environment to which investors grew accustomed from 2012 to 2021, today’s yields across fixed income remain above their 10-year averages. (Figure 5)
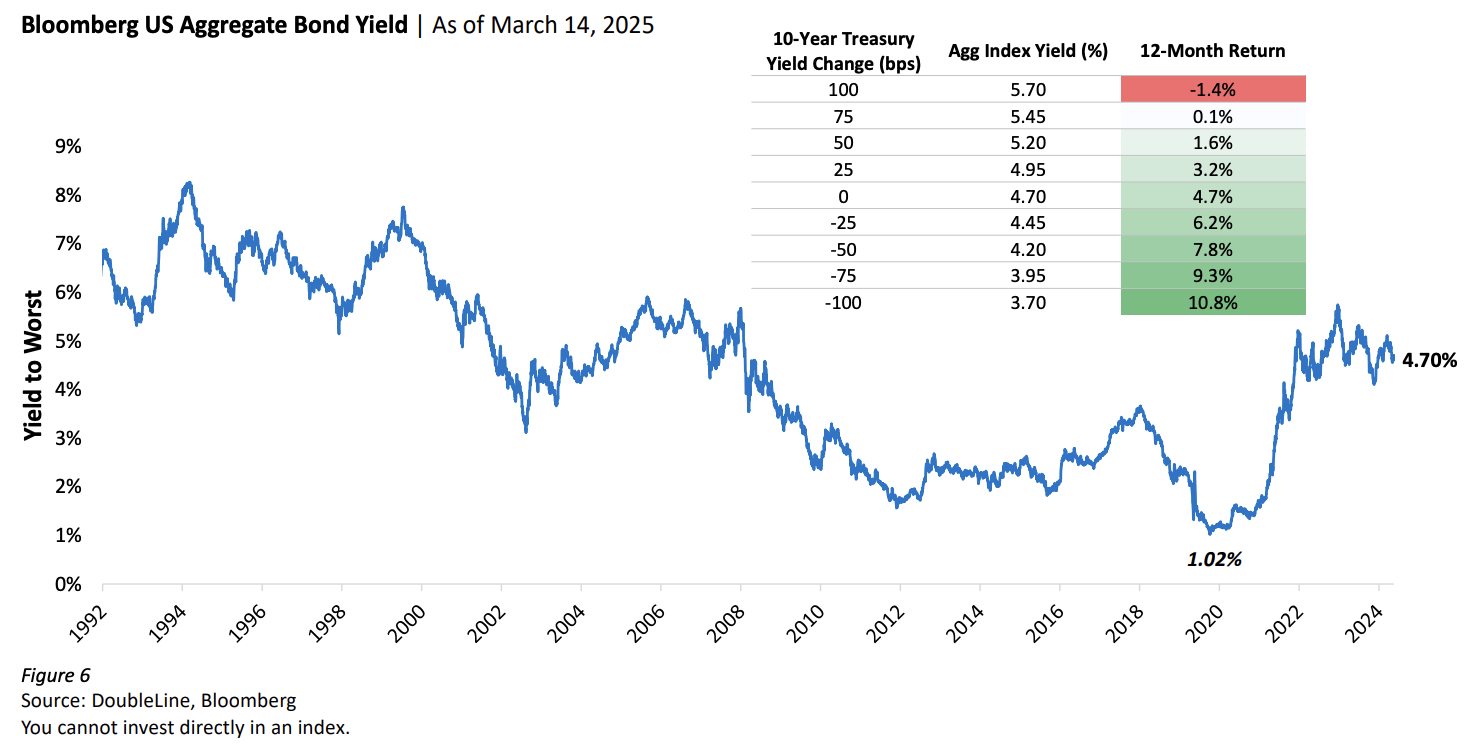
Above-average yields can help to not only increase income and returns but also better protect on the downside if interest rates were to rise or credit spreads were to widen in a risk-off environment. (Figure 6)
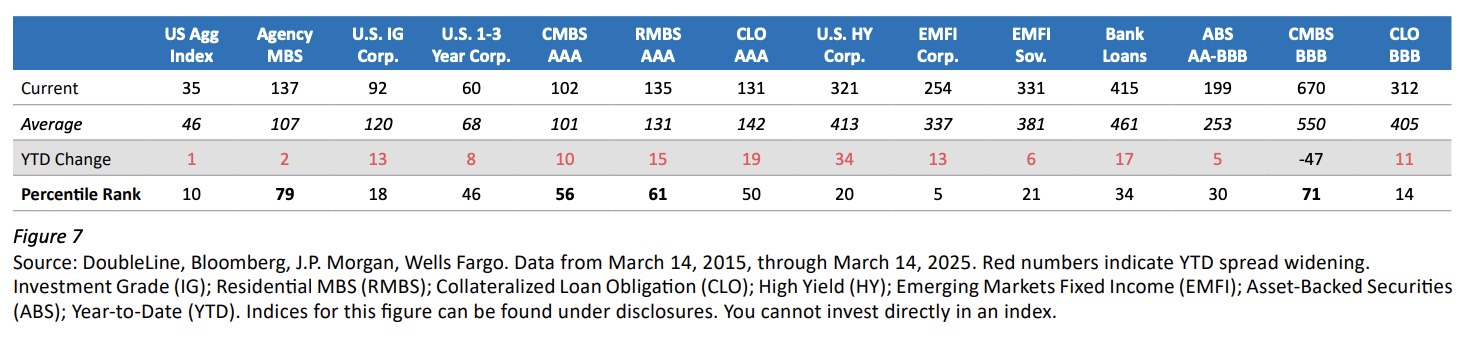
While yields remain attractive, spreads are generally tight. Areas of securitized sectors, however, remain wide of their 10-year averages, with mortgage-backed securities (MBS) and commercial MBS (CMBS) exhibiting the largest percentile differentials. (Figure 7)
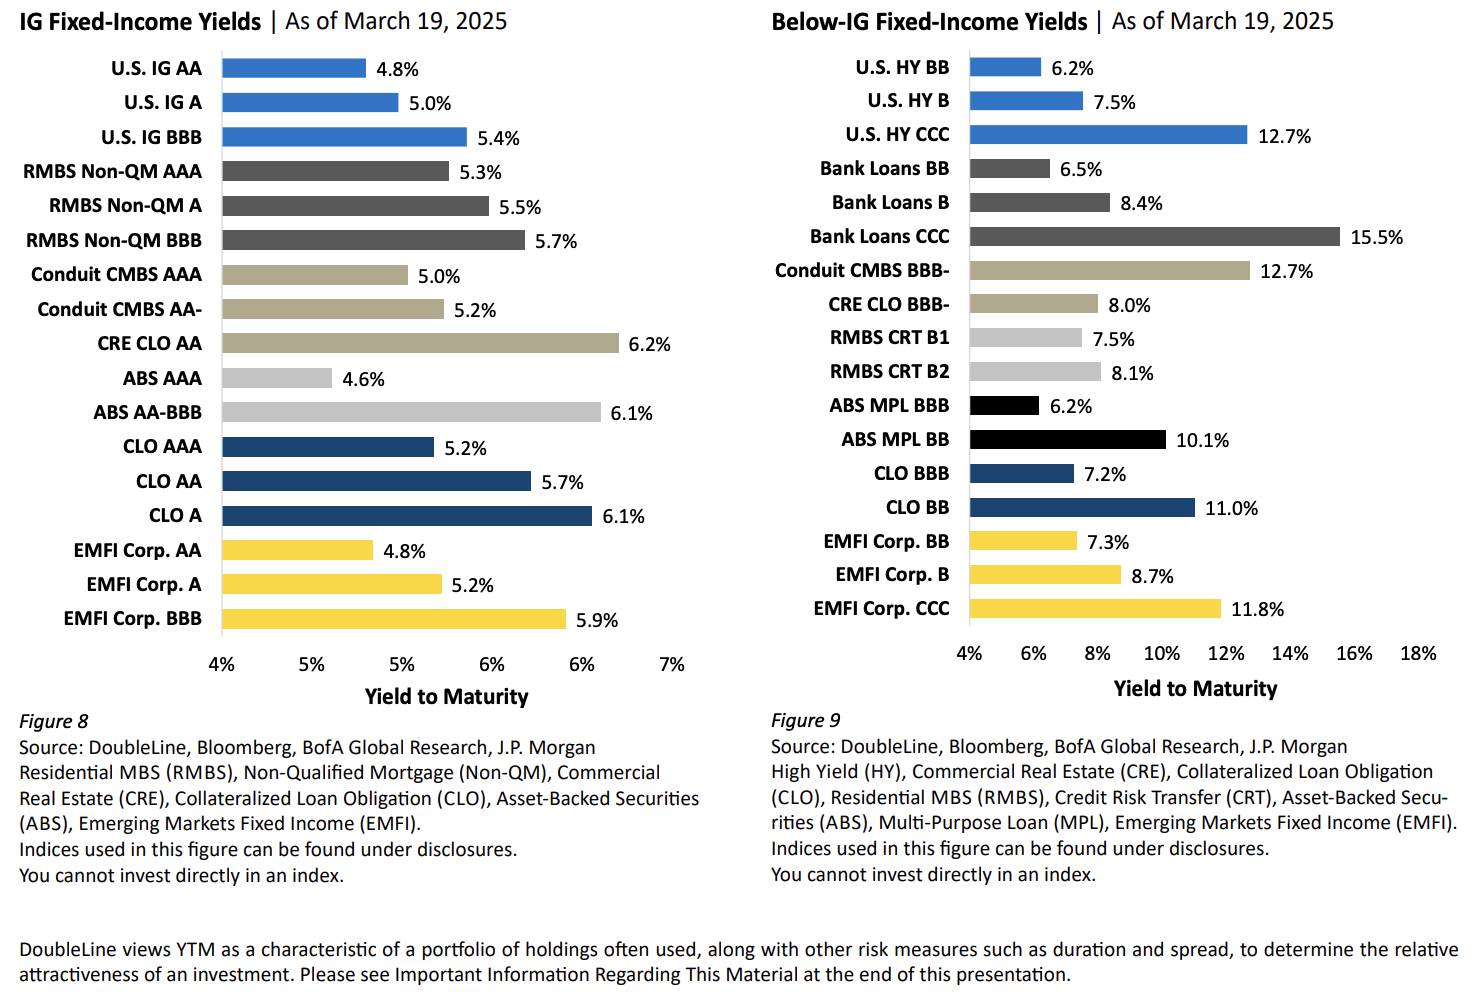
Today’s corporate and securitized credit markets offer attractive yields for investors, ranging from over 5% for investment grade (IG) bonds to yields in the high single and low double digits for below-IG securities. (Figures 8 and 9)
Additionally, investors looking to potentially provide a high-single-digit total return and generate 6% to 7% in current income might want to consider a strictly multi-sector credit approach. Given relatively tight credit spreads, creating a well-diversified credit portfolio, while not overreaching for yield in low-quality credits, could provide investors an opportunity to generate returns slightly below the long-term return of U.S. equities while likely providing a smoother ride with less volatility and lower drawdowns.
To view the DoubleLine Fixed Income Outlook in its entirety, including sector outlooks from DoubleLine's investment teams, please visit: https://doubleline.com/markets-insights/fixed-income-outlook/
© DoubleLine
Read more commentaries by DoubleLine